Navigating the ExtraHop System
The ExtraHop system provides access to network activity data and detection details through a dynamic and highly customizable user interface.
| Video: | See the related training: Complete UI Fundamentals Learning Path |
Supported browsers
The following browsers are compatible with all ExtraHop systems. Apply the accessibility and compatibility features provided by your browser to access content through assistive technology tools.
- Firefox
- Google Chrome
- Microsoft Edge
- Safari
| Important: | Internet Explorer 11 is no longer supported. We recommend that you install the latest version of any supported browser. |
Layout and menus
Global navigation elements are located at the top of the page and contain links to the main sections of the system. Within each section, the left pane contains links to specific pages or data.
The following figure shows both global and left pane navigation elements.
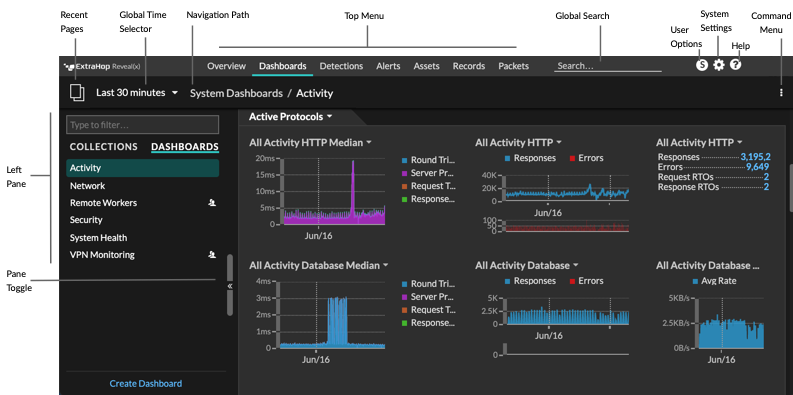
Here are definitions of each global navigation element:
- Overview pages
- Overview pages enable you to quickly evaluate the scope of suspicious activity on your
network, learn about protocol activity and device connections, and investigate inbound
and outbound traffic on your network.
- View the Security Overview for information about security detections on your network.
- View the Network Overview for information about active devices on your network.
- View the Perimeter Overview for information about traffic traveling in and out of your network.
- Dashboards
- Click Dashboards to view, create, or share dashboards for monitoring any aspect of your network or applications. System dashboards give you an instant view of the activity and potential security threats on your network.
- Alerts
- Click Alerts to view information about each alert generated during the time interval.
- Detections
- If your packet or flow sensor is connected to the ExtraHop Machine Learning Service,
the top level navigation shows the Detections menu. Click
Detections to view detections identified from your wire data.
You can access stored detections even if your sensor is disconnected from the Machine
Learning Service.
Note: Machine learning detections require a connection to ExtraHop Cloud Services. - Assets
- Click Assets to find any application, network, or device discovered by the ExtraHop system. You can view protocol metrics for your assets, active users, or network activity by protocol.
- Records
- If your ExtraHop system is configured with a recordstore, the top level navigation shows the Records menu. Click Records to query for all stored records for the current time interval. Records are structured information about transactions, messages, and network flows.
- Packets
- If your ExtraHop system is configured with a packetstore, the top level navigation shows the Packets menu. Click Packets to query for all stored packets for the current time interval.
- Global search field
- Type the name of any device hostname or IP address, application, or network to find a match on your sensor or console. If you have a connected recordstore, you can search for saved records. If you have a connected packetstore, you can search for packets.
- Help icon
- See help information for the page that you are currently viewing. To access the most current and comprehensive set of ExtraHop documentation, visit the ExtraHop Documentation website.
- System Settings icon
- Access system configuration options, such as Triggers, Alerts, Scheduled Reports, and Custom Devices, and click to view the ExtraHop system and version. Click System Notices to view a list of features in the most current version and any system notices such as expiring licenses or available firmware upgrades.
- User option icon
- Log in and log out of your sensor or console, change your password, select the display theme, set a language, and access API options.
- Pane toggle
- Collapse or expand the left pane.
- Global Time Selector
- Change the time interval to view application and network activity that was observed by the ExtraHop system for a specific time period. The global time interval is applied to all metrics across the system and does not change as you navigate to different pages.
- Recent pages
- See a list of the most recent pages you visited in a drop-down menu and make a selection to go back to a previous page. Repeated pages are deduplicated and condensed to save space.
- Navigation path
- View where you are in the system and click a page name in the path to navigate back to that page.
- Command menu drop-down
- Click to access specific actions for the page you are viewing. For example, when you
click Dashboards at the top of the page, the command menu
 provides actions for changing
dashboard properties or creating a new dashboard.
provides actions for changing
dashboard properties or creating a new dashboard.
Start analyzing data
Begin your data analysis journey with the ExtraHop system by following the basic workflows listed below. As you become familiar with the ExtraHop system, you can complete more advanced tasks, such as installing bundles and building triggers.
Here are some basic ways to navigate and work with the ExtraHop system to analyze network activity.
- Monitor metrics and investigate interesting data
- Good starting points are the Network Activity dashboard and Network Performance dashboard, which show
you summaries of important metrics about application performance on your network. When
you see a spike in traffic, errors, or server processing time, you can interact with
dashboard data to drill down and identify which clients, servers,
methods, or other factors contributed to the unusual activity.
You can then continue performance monitoring or troubleshooting by creating a custom dashboard to track a set of interesting metrics and devices.
Check out the following walkthroughs to learn more about monitoring data in dashboards:
- Search for a specific device and investigate related metrics and transactions
- If you want to investigate a slow server, you can search for the server in the ExtraHop system by device name or IP
address and then investigate the server's activity on a protocol page. Was
there a spike in response errors or requests? Was server processing time too high or did
network latency affect the rate of data transfer? Click on different protocols on the
Devices page to investigate more metric data collected by the ExtraHop system. Drill down by
peer IP addresses to see which clients or applications the server talked to.
If your ExtraHop system is connected to a recordstore, you can investigate entire transactions that the server participated in by creating a record query.
Check out the following walkthroughs to learn more about exploring metrics and records:
- Get visibility into changes to your network by searching for protocol activity
- You can get a top-down view of your network by looking at built-in protocol groups. An
protocol group is a collection of devices automatically grouped together by the ExtraHop
system based on the protocol traffic observed over the wire. For example, you can find
new or decommissioned servers that are actively communicating over a protocol by creating an activity
map.
If you find a collection of devices that you want to continue monitoring, you can add a device tag or custom device name to make those devices easier to find in the ExtraHop system. You can also create a custom device group or a custom dashboard to monitor device group activity.
Advanced workflows for customizing your ExtraHop system
After becoming familiar with basic workflows, you can customize your ExtraHop system by setting up alert notifications, creating custom metrics, or installing bundles.
- Set up alerts
- Alerts track specified metrics to notify you of traffic deviations that might indicate an issue with a network device. Configure a threshold alert to notify you when a monitored metric crosses a defined value. Configure a trend alert to notify you when a monitored metric deviates from the normal trends observed by the system.
- Build a trigger to create custom metrics and applications
- Triggers are custom scripts
that perform an action upon a pre-defined event. Triggers require planning to make sure
a trigger doesn't negatively impact system performance.
Check out the following walkthroughs to learn more about exploring metrics and records:
Thank you for your feedback. Can we contact you to ask follow up questions?