Analyze System Health charts to assess trigger performance
Triggers are a powerful tool that can provide detailed insight about your environment. However, triggers consume resources and affect system performance, which is why you must monitor and assess the impact of triggers on your ExtraHop system through system health tools.
In this walkthrough, you will learn how to create a bad trigger, evaluate the negative performance impact with system health tools, and then correct the bad trigger. You will also learn how to create a dashboard to continue monitoring trigger performance.
The tasks in this walkthrough will help you answer the following questions about the impact of triggers on the ExtraHop system:
- Has my new trigger resulted in an exception error?
- How many exceptions errors have occurred?
- What is the performance impact of the my new trigger?
Prerequisites
- You must have access to an ExtraHop system with a user account that has limited write or full write privileges.
- Your ExtraHop system must have SMTP traffic.
- Familiarize yourself with the concepts in this walkthrough by reading the System Health dashboard and Triggers sections in the ExtraHop System User Guide.
- Familiarize yourself with the processes of creating triggers and dashboards by completing the Trigger Walkthrough and the Dashboard Walkthrough.
Create a trigger with exceptions
In this procedure, you will create a simple trigger that logs the processing time of SMTP responses. You will introduce a deliberate error into the trigger configuration to ensure that a trigger exception occurs.
Next steps
Let the trigger run for at least ten minutes, and then check the System Health dashboard.| Tip: | Always check trigger performance charts on the System Health dashboard after you create a new trigger or modify an existing one. By only checking trigger results, such as metrics on a custom dashboard or record queries, you might miss the full picture. For example, a trigger might appear to collect metrics as expected, but might also be consuming a large amount of resources, which could block the trigger queue and lead to triggers getting dropped from the queue. |
Review trigger charts on the System Health dashboard
The System Health dashboard contains charts that pertain to the health and performance of ExtraHop system components and services. In this procedure, you will consult trigger performance charts on the System Health dashboard to check the impact of the trigger you created in the previous section.
| Note: | The performance results reported for the example trigger on your system will differ from the results displayed in this section. |
-
In the upper right corner of the window, click the System Settings icon
 and then select
System Health.
and then select
System Health.
-
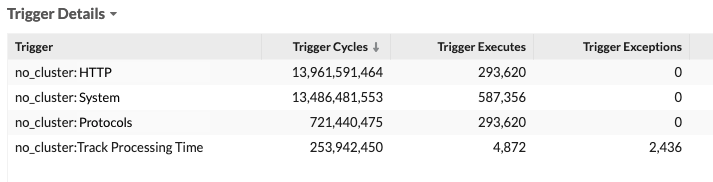
Scroll down to the Triggers region of the dashboard and locate the
Trigger Details chart.
This chart lists the most active triggers on your system along with the cycles, executes, and exceptions associated with those triggers.
-
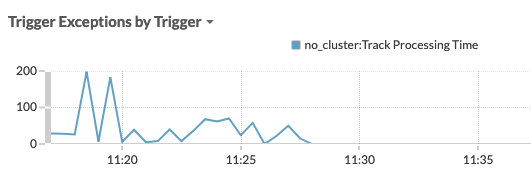
Scroll down the System Health dashboard and locate the Trigger Exceptions by
Trigger chart. The chart displays the Track Processing Time trigger you created,
similar to the following figure:
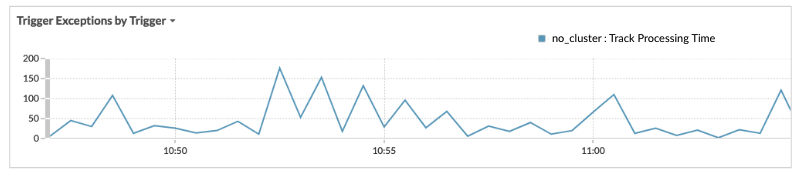
This chart displays which triggers have exceptions and the number of exceptions generated in the specified time range. Timestamps can help you locate exception error messages in the debug log.
Tip: To highlight a single line in the chart, click the name of the trigger, and then select Hold Focus from the drop-down menu. -
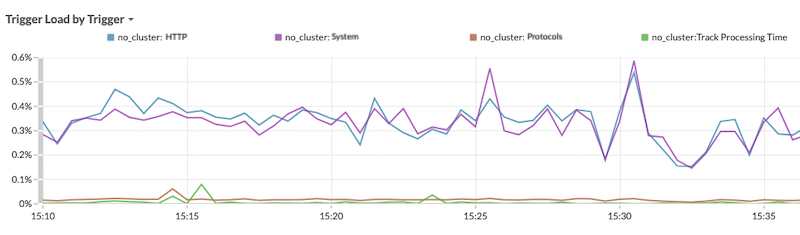
Scroll up on the System Health dashboard and locate the Trigger Load by
Trigger chart. This chart lists the percentage of cycles on the ExtraHop system that are being consumed by each trigger.
Fix the trigger and view results on the System Health page
In this procedure, you will view exceptions in the trigger debug log that identify where the problem occurs in the trigger script, and then you will resolve the error.
-
In the upper right corner of the window, click the System Settings icon and then select
Triggers.
-
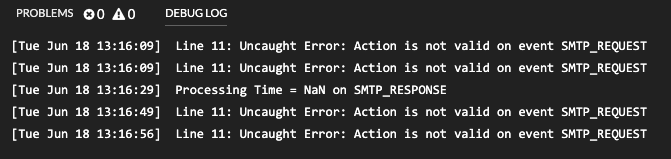
Click the Debug Log tab.
In this walkthrough, the debug log displays output similar to the following figure:
-
Click the Editor tab, and then locate line 12 in the
script to identify the action that is invalid on SMTP requests. In the following
figure, line 12 shows that the action is to access the
processingTime property on events:
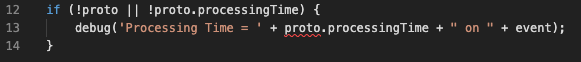
This information combined with the information from debug log error messages shows that accessing the processingTime property is invalid on SMTP request events.
-
In the upper right corner of the window, click the System Settings icon and then select
System Health.
-
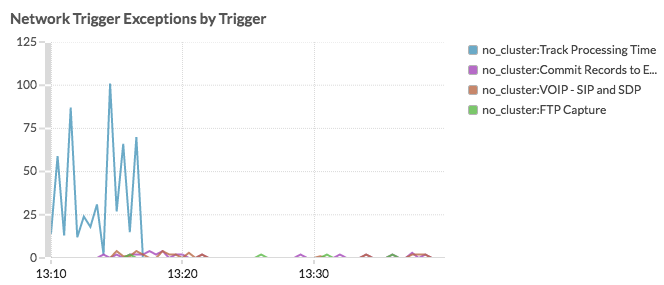
Wait 5-10 minutes, and then scroll to the Trigger
Exceptions chart that should look similar to the following
figure:
Create a trigger performance dashboard
In this section, you will create a custom trigger performance dashboard and add several charts discussed in this walkthrough.
Adding system health metrics to a dashboard enables you to customize how you view the data such as choosing the chart type, adding chart notes and tips in text boxes, or adding multiple metrics to a chart.
If you are unfamiliar with creating dashboards, complete the Dashboard Walkthrough. For comprehensive information and procedures for creating and customizing dashboards, see the Dashboards section of the ExtraHop System User Guide.
-
Click the command menu
 in
the upper-right corner, and select New Dashboard.
in
the upper-right corner, and select New Dashboard.
-
Click Save to return to your dashboard.
The chart should look similar to the following figure:
-
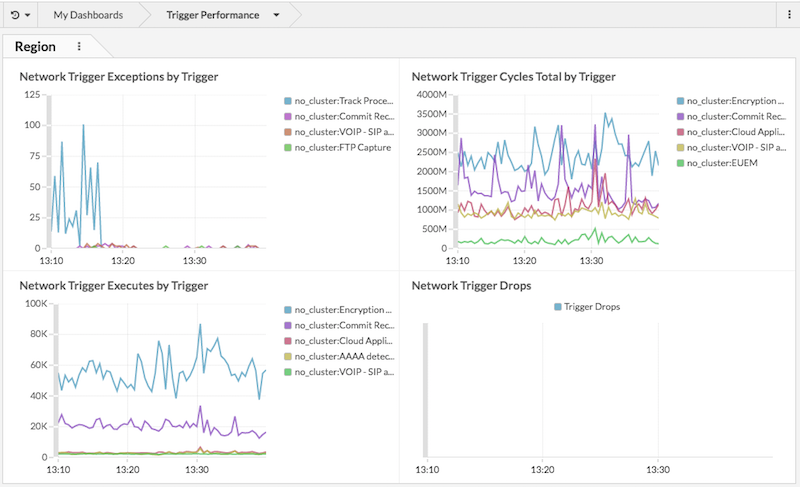
Click Exit Layout Mode from the upper-right corner.
The dashboard should look similar to the following figure:
Next steps
| Tip: | As a next step, you can upload the ExtraHealth Bundle to the ExtraHop system, which installs a dashboard that contains a wide variety of system health charts. Customize the ExtraHealth dashboard to suit your needs, or copy the charts you want to a new dashboard. To learn about bundles, see the Bundles section of the ExtraHop System User Guide. |
Thank you for your feedback. Can we contact you to ask follow up questions?