Introduction to the ExtraHop system
This guide explains how the ExtraHop system collects and analyzes your data and how the core system components and functionalities help you access detections, metrics, transactions, and packets about the traffic on your network.
| Video: | See the related training: ExtraHop System Overview |
Platform Architecture
The ExtraHop system is customized with modular components that combine to satisfy your unique environmental needs.
Modules
ExtraHop modules offer a combination of solutions, components, and cloud-based services that deliver value for multiple use cases.
Modules are available for Network Detection and Response (NDR) and Network Performance Monitoring (NPM), with additional modules for Intrusion Detection Systems (IDS) and Packet Forensics.
Administrators can grant users role-based access to the NDR module, NPM module, or both.
- Network Performance Monitoring
- The NPM module allows privileged users to complete the following types of system
tasks.
- View, create, and modify custom dashboards. Users can also select a dashboard for their default landing page.
- Configure alerts and notification by email for those alerts.
- View performance detections.
- Network Detection and Response
- The NDR module allows privileged users to complete the following types of system
tasks.
- View the Security Overview page.
- View security detections.
- View, create, and modify investigations.
- View threat briefings.
Users granted access to both modules are allowed to complete all of these tasks. See the Migration Guide to learn more about migrating users to role-based access with these modules.
These additional modules are also available for specific use cases:
- Packet Forensics
- The Packet Forensics module can be combined with either the NDR or NPM module to provide full packet capture, storage, and retrieval.
- Intrusion Detection Systems
- The IDS module must be combined with the NDR module and provides detections based on
industry-standard IDS signatures. Most ExtraHop packet sensors are eligible for
the IDS module, as long as the sensor is licensed for the NDR module.
Note: Throughput might be affected when more than one module is enabled on the sensor.
Features
The ExtraHop system provides an extensive feature set that enables you to organize and analyze detections, metrics, records, and packets associated with the traffic on your network.
Module and system access are determined by user privileges that are managed by your ExtraHop Administrator.
Global features
- Network Overview
- Perimeter Overview
- Activity maps
- Active Directory dashboard
- Generative AI dashboard
- Scheduled dashboard reports
- Detection tracking
- Assets
- Geomap
- Records
- Packets
- Integrations (Reveal(x) 360 only)
- API access
- Analysis priorities
- Metric catalog
- Bundles
- Triggers
NDR module features
- Security Overview
- AI Search Assistant
- Executive Reports
- Built-in security dashboards
- Security detections
- MITRE map
- Investigations
- Tuning rules for security detections
- Notification rules for security detections and threat briefings
- Threat Briefings
- Threat Intelligence
NPM module features
- Custom dashboards
- Built-in performance dashboards
- Performance detections
- Tuning rules for performance detections
- Notification rules for performance detections
- Alerts
Solutions
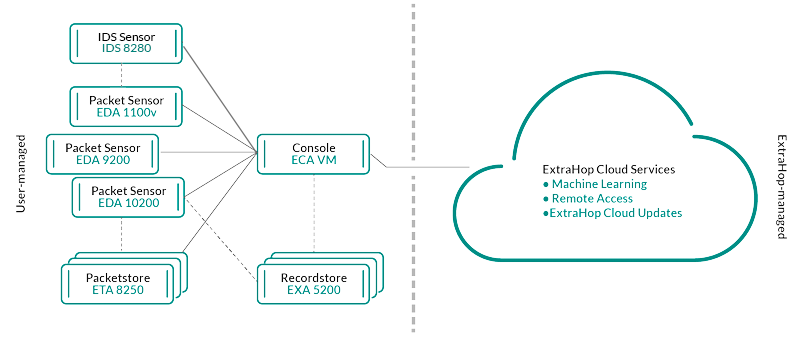
- Reveal(x) Enterprise
- Reveal(x) Enterprise is a self-managed solution that comprises sensors,
consoles, packetstores, recordstores, and access to ExtraHop Cloud
Services.
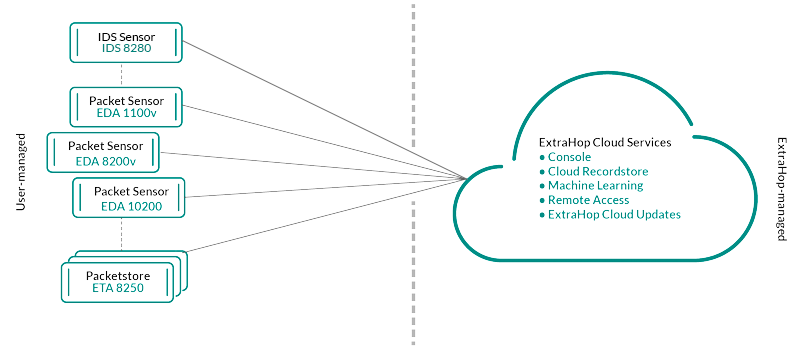
- Reveal(x) 360
- Reveal(x) 360 is a software-as-a-service (SaaS) solution that comprises sensors and packetstores and includes a cloud-based
recordstore, a console, and access to ExtraHop Cloud
Services.
Components
Each solution offers a set of components based on your environmental needs: sensors, packetstores, recordstores, and a console for centralized management and unified data views.
- Packet sensors
- Packet sensors capture, store, and analyze metric data about your network. Multiple levels of data analysis, collection, and storage are available by sensor size. These sensors are available in both NPM and NDR modules as physical, virtual, and cloud-based options in sizes that are based on your analysis needs.
- IDS sensors
- Intrusion Detection System (IDS) sensors integrate with packet sensors to generate detections based on industry-standard IDS signature. IDS sensors are deployed as an add-on module to the NDR module. IDS sensors are a physical appliance with a companion packet sensor and are available for Reveal(x) 360 or Reveal(x) Enterprise environments.
- Flow sensors
- Flow sensors are available for Reveal(x) 360 only and exclusively collect VPC flow logs so that you can see traffic managed by AWS SaaS services.
- Recordstores
- Recordstores integrate with sensors and consoles to store transaction and flow records that can be queried from throughout the ExtraHop system. Recordstores can be deployed as standalone physical or virtual options, supported as third-party connections to Splunk or BiqQuery from Reveal(x) Enterprise, and are available in packages with NPM and NDR modules.
- Packetstores
- Packetstores integrate with sensors and consoles to provide continuous packet capture and sufficient storage for deeper investigations and forensic needs. Packetstores can be deployed as standalone physical or virtual options and are available as an add-on Packet Forensics module for both NPM and NDR modules.
- Consoles
- Consoles provide a browser-based interface that provides a command center for all connected components. Consoles can be deployed as standalone virtual or cloud-based options for Reveal(x) Enterprise and are included with Reveal(x) 360.
The following table provides an overview of the options available for each solution.
| Reveal(x) Enterprise | Reveal(x) 360 | |||
|---|---|---|---|---|
| Physical | Virtual/Cloud | Physical | Virtual/Cloud | |
| Packet sensor | ||||
| IDS sensor | IDS 9380 | IDS 9380 | ||
| Flow sensor | N/A | N/A | N/A |
EFC 1291v AWS (VPC) EFC 1292v (NetFlow) |
| Packetstore |
Included with Ultra subscriptions |
|||
| Recordstore | EXA 5200 | N/A | Included with Premium and Ultra subscriptions | |
| Console | N/A | N/A | Included with all subscriptions | |
ExtraHop Cloud Services
Smart Sensor Analytics
The ExtraHop system offers a browser-based interface with tools that enable you to explore and visualize data, investigate findings in both top-down and bottom-up workflows, and customize how you collect, view, and share your network data. Advanced users can automate and script both administrative and user tasks through the ExtraHop REST API and customize data collection through the ExtraHop Trigger API, which is a JavaScript IDE tool.
At the core of the ExtraHop system is a smart sensor that captures, stores, and analyzes metric data about your network—and offers different levels of data analysis, collection, and storage based on your needs. Sensors are provisioned with storage that supports 30 days of metric lookback. Note that actual lookback varies by traffic patterns, transaction rates, the number of endpoints, and the number of active protocols.
Consoles act as a command center with connections to multiple sensors, recordstores, and packetstores that are distributed across data centers and branch offices. All Reveal(x) 360 deployments include a console; Reveal(x) Enterprise can deploy virtual or cloud variations.
Consoles provide unified data views across all your sites and enable you to sync certain advanced configurations (such as triggers and alerts) and settings (tuning parameters, analysis priorities, and recordstores).
The following sections describe the major functional components of the ExtraHop system and how they work together.
Sensor Types
The type of sensor you deploy determines the type of data that is collected, stored, and analyzed.
Wire data
Packet sensors and Intrusion Detection System (IDS) sensors passively observe unstructured packets through a port mirror or tap and store the data in the local datastore. The packet data goes through real-time stream processing that transforms the packets into structured wire data through the following stages:
- TCP state machines are recreated to perform full-stream reassembly.
- Packets are collected and grouped into flows.
- The structured data is analyzed and processed in the following ways:
- Transactions are identified.
- Devices are automatically discovered and classified by their activity.
- Metrics are generated and associated with protocols and sources, and the metric data is then aggregated into metric cycles.
- As new metrics are generated and stored, and the datastore becomes full, the oldest existing metrics are overwritten according to the first-in first-out (FIFO) principle.
Flow data
A flow is a set of packets that are part of a single connection between two endpoints. Flow sensors are available for Reveal(x) 360 and offer continuous network visibility based on VPC flow logs to help secure AWS environments. VPC flow logs enable you to capture information about the IP traffic going to and from network interfaces in your VPC and are recorded as flow log records, which are log events that consist of fields that describe the traffic flow. This log data enables you to search for threats with advanced machine-learning detections.
Flow logs are ingested, deduplicated, and then grouped into flows. The flows are then enriched with data (such as MAC addresses) queried from AWS EC2 APIs.
The flows are then analyzed and processed in the following ways:
- Devices are automatically discovered and classified by their activity observed over specific ports.
- Basic L2-L4 metrics are generated and aggregated into metric cycles.
- ExFlow record types are generated and published.
Metrics, Records, and Packets
ExtraHop sensors collect and store multiple depths of network interaction as metrics. Metrics are aggregated observations about endpoint interactions over time. Packetstores collect and store the raw data transferred between two endpoints as packets. Recordstores collect and store records, which are structured information about transaction, message, and network flows.
You can view and query all of these interactions from individual sensors or from a console that is connected to a complex deployment of sensors, packetstores, and recordstores.
For example, when a client sends an HTTP request to a web server, here is what each data type contains:
- The packet contains the raw data that was sent and received in the interaction.
- The related record contains the time-stamped metadata about the interaction: when the request happened, the IP address of the client and server, the requested URI, any error messages.
- The related metric (HTTP Requests) contains an aggregate of that interaction with other observed interactions during the specified time period, such as how many requests occurred, how many of those requests were successful, how many clients sent requests, and how many servers received the requests.
Both metrics and records can be customized to extract and store specific metadata with JavaScript-based triggers. While the ExtraHop system has over 4600 built-in metrics, you might want to create a custom metric that collects and aggregates 404 errors from only critical web servers. And, you might want to maximize your record storage space by only collecting transactions that occurred over a suspicious port.
Device discovery
After a device is discovered, the ExtraHop system begins to collect metrics based on the analysis level configured for that device. You can Find a device by their MAC address, IP address, or name (such as a hostname observed from DNS traffic, NetBIOS name, Cisco Discovery Protocol (CDP) name, DHCP name, or a custom name that you assigned to the device).
The ExtraHop system can discover and track devices by their MAC address (L2 Discovery) or by their IP addresses (L3 Discovery). L2 Discovery offers the advantage of tracking metrics for a device even if the IP address is changed or reassigned through a DHCP request. By default, the ExtraHop system is configured for L2 Discovery.
Device IPv4 and IPv6 addresses are discovered from Address Resolution Protocol (ARP) messages, Neighbor Discovery Protocol (NDP) responses, local broadcasts, or local subnet multicast traffic. The MAC address and IP address for devices appear in search results throughout the system with the device information.
L2 Discovery
In L2 Discovery, the ExtraHop system creates a device entry for every local MAC address discovered over the wire. IP addresses are mapped to the MAC address, but metrics are stored with the device MAC address even if the IP address changes.
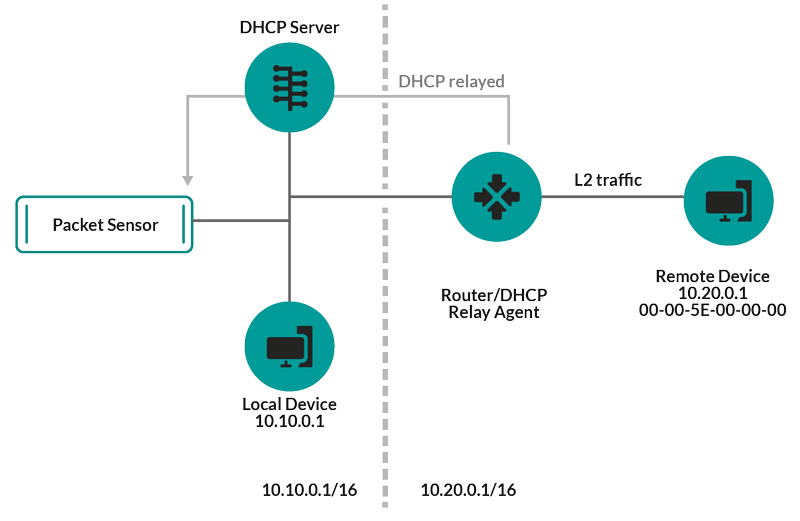
IP addresses observed outside of locally-monitored broadcast domains are aggregated at one of the incoming routers in your network. If a device sends a DHCP request through a router acting as a DHCP relay agent, the ExtraHop system detects and maps the IP address to the device MAC address. If the IP address changes for the device with a subsequent request through the DHCP relay agent, the ExtraHop system updates its mapping and continues to keep track of the device metrics by the MAC address.
Both MAC address and IP address are discovered for the remote device.
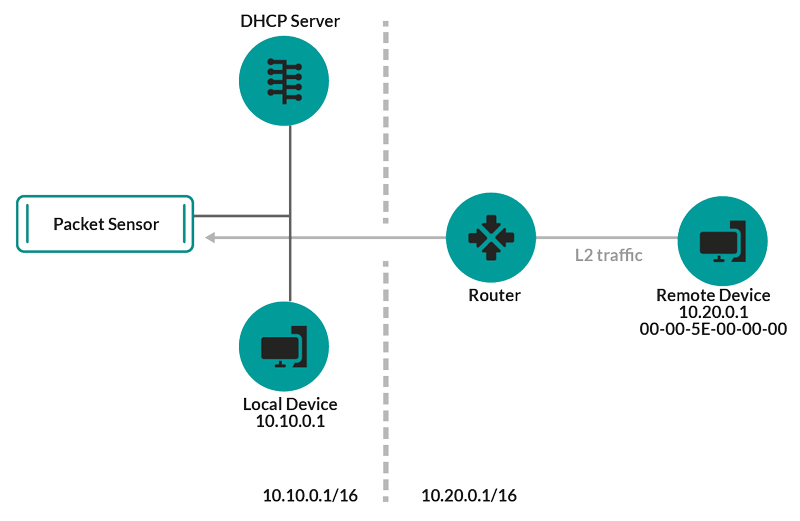
If a DHCP relay agent is not configured, remote devices can be discovered by their IP addresses through Remote L3 Discovery.
L3 Discovery
In L3 Discovery, the ExtraHop system creates and links two entries for each local discovered device: an L2 parent entry with a MAC address and an L3 child entry with IP addresses and the MAC address.
Here are some important considerations about L3 discovery:
- If a router has proxy ARP enabled, the ExtraHop system creates an L3 device for each IP address that the router answers ARP requests for.
- If you have a proxy ARP configured in your network, the ExtraHop system might automatically discover remote devices.
- L2 metrics that cannot be associated with a particular L3 child device (for example, L2 broadcast traffic) are associated with the L2 parent device.
Remote L3 Discovery
If the ExtraHop system detects an IP address that does not have associated ARP or NDP traffic, that device is considered a remote device. Remote devices are not automatically discovered, but you can add a remote IP address range and discover devices that are outside of the local network. A device entry is created for each IP address that is observed within the remote IP address range. (Remote devices do not have L2 parent entries.)
Only the IP address is discovered for the remote device.
Here are some recommendations about when to configure Remote L3 Discovery:
- Your client devices are on a network segment that is not directly tapped.
- Your organization has a remote office without an on-site ExtraHop system but users at that site access central data center resources that are directly monitored by an ExtraHop system. The IP addresses at the remote site can be discovered as devices.
- A cloud service or other type of off-site service hosts your remote applications and has a known IP address range. The remote servers within this IP address range can be individually tracked.
VPN Discovery
VPN Discovery enables the ExtraHop system to correlate the private, RFC-1918 IP addresses assigned to VPN clients with their public, external IP addresses. This enriched visibility into north-south traffic reduces barriers when investigating security incidents and performance issues that involve external VPN clients. (This feature requires a VPN gateway that is manually assigned by the user.)Threat Detection
The ExtraHop system offers both machine-learning and rules-based detections that identify active or potential threats, network weaknesses that are vulnerable to exploits, and suboptimal configurations that can degrade network performance.
Additionally, charts, visualizations, and device activity maps enable proactive threat hunting.
Detection Tuning
Reduce noise and surface only critical detections by adding details about your network that help identify known parameters such as trusted domains and vulnerability scanners.Additionally, you can create tuning rules that hide specific detections or participants and further reduce unwanted noise.
Network Locality
By default, any device with an RFC1918 IP address (included in a 10/8, 172.16/12, or 192.168/16 CIDR block) is classified on the system as an internal device.However, because some network environments include non-RFC1918 IP addresses as part of their internal network, you can change the internal or external classification for IP addresses from the Network Localities page.
Threat Intelligence
The ExtraHop system includes curated threat intelligence feeds from ExtraHop and Crowdstrike Falcon that are updated through the cloud as new threats are discovered. You can also add threat collections from a third-party.Threat Briefings
Threat briefings provide information about imminent threats that are targeting networks. Updated detections, targeted record and packet queries, and affected devices are presented as a starting point for your investigation, accessed from the Security Overview page.Integrations
Reveal(x) 360 provides several third-party integrations that can enhance detection and response management and provide better visibility into network traffic.- Cortex XSOAR
- Export ExtraHop detections, run response playbooks, and query device details in Cortex XSOAR.
- CrowdStrike
- View details about CrowdStrike devices, and contain those devices from the ExtraHop system.
- CrowdStrike Falcon LogScale
- Specify filter criteria for ExtraHop security detections and export results to CrowdStrike Falcon LogScale.
- Microsoft 365
- Import Microsoft 365 detections and events, monitor Microsoft 365 metrics in built-in dashboards, and view risk event details in records.
- Microsoft Protocol Decryption
- Decrypt traffic over Microsoft protocols such as LDAP, RPC, SMB, and WSMan to improve detection of security attacks within your Microsoft Windows environment.
- QRadar
- Export and view ExtraHop detections in your QRadar SIEM.
- Splunk
- Export and view ExtraHop detections in your Splunk SIEM.
- Splunk SOAR
- Export and view ExtraHop detections, metrics, and packets in your Splunk SOAR solution.
Thank you for your feedback. Can we contact you to ask follow up questions?