Monitor database health in a dashboard
When someone reports that a database query failed or is too slow, several questions come to mind. Finding the answers can be a time-consuming endeavour. You might spend hours combing the logs of database instances just to narrow down where the issue began.
With the ExtraHop system, metrics about every database transaction on your network are located in one place. A dashboard in the ExtraHop system offers a central location for exploring this information and building helpful charts.
Dashboards are flexible and customizable, letting you build several types of charts that reveal different types of database metrics, which can shed light on underlying causes of database issues.
- How many database errors do I have?
- When did the errors occur?
- What is the percentage of database errors on my network?
- Which servers are sending database errors?
- What are the slowest database instances?
Prerequisites
- You must have access to an ExtraHop system with a user account that has limited or full write privileges.
- Your ExtraHop system must also have network data with database traffic. The ExtraHop system supports modules for major databases, including IBM DB2, IBM Informix, Microsoft SQL Server, MongoDB, MySQL, Oracle, PostgreSQL, Sybase ASE, and Sybase IQ.
- Familiarize yourself with the concepts in this walkthrough by reading the Dashboards topic.
If you do not have access to database server data or the required privileges, you can perform this walkthrough in the ExtraHop demo.
Create a dashboard
To create your own dashboard to display database metrics, complete the following steps.
- Log in to the ExtraHop system through https://<extrahop-hostname-or-IP-address>.
- At the top of the page, click Dashboards.
-
Click the command menu
 in the upper right corner and select New
Dashboard to create an empty dashboard.
in the upper right corner and select New
Dashboard to create an empty dashboard.
- Type a name for your dashboard in the Title field. For this walkthrough, type Database Health.
- Click Create. When you create a new dashboard, a workspace opens in an editable layout mode. This workspace contains a single region and two empty widgets: a chart and a text box.
-
Text box widgets can include custom explanatory text about a dashboard or
chart. For this walkthrough, however, we won't be adding text. Delete the text
box by completing the following steps:
-
Click the command menu in the upper right corner of the text box
widget and select Delete.
- Click Delete Widget.
-
Click the command menu
Next steps
Let's add database error metrics to the empty chart.How many errors do I have?
These steps show you how to create a chart to display the number of database errors for a specified time interval.
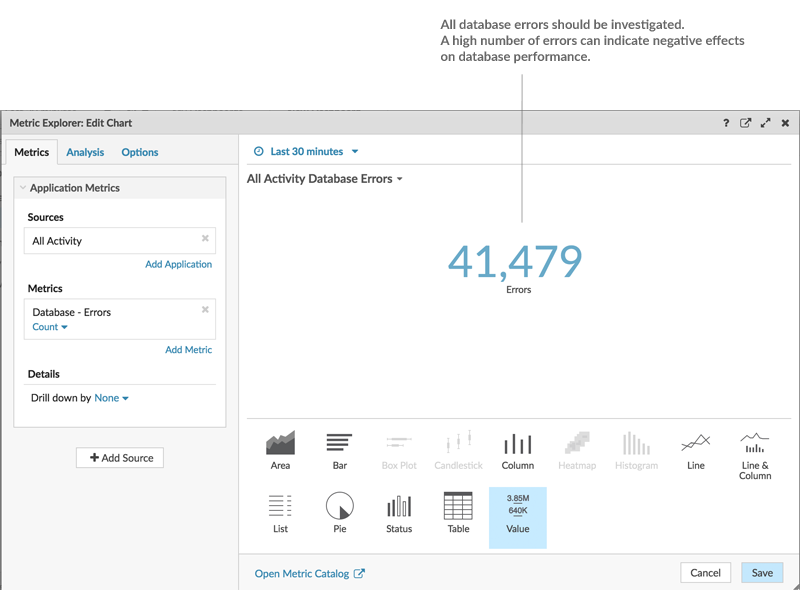
Database errors are a general indicator of the stability and health of an application. In the ExtraHop system, database errors are the number of request operations that failed on all database instances. Any database error should be investigated.
To build the dashboard charts in this walkthrough, you'll select the All Activity application as the source. All Activity is a metric source that is available by default to all users and contains metrics about all of the devices discovered on your network.
-
From the bottom of the window, click the Value
chart.
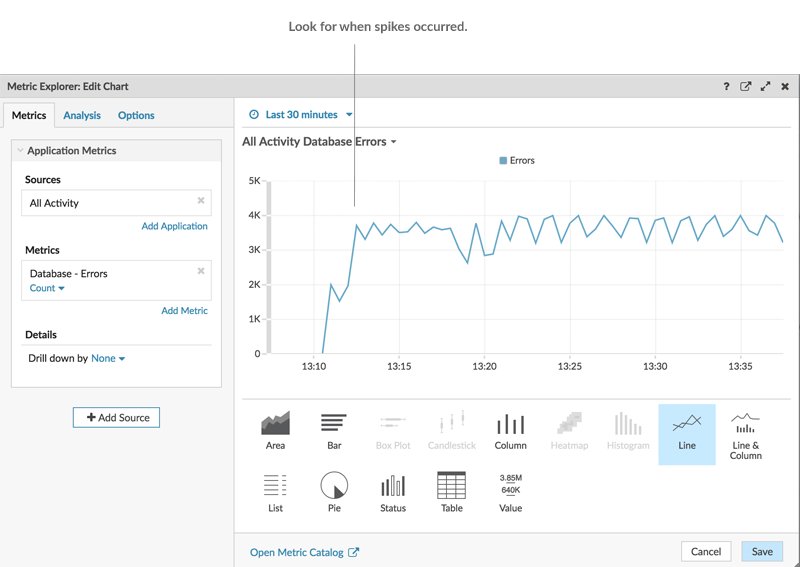
When did the errors occur?
Now that you have determined the scope of database errors, let's take a look at when the errors occurred and how they changed over time.
-
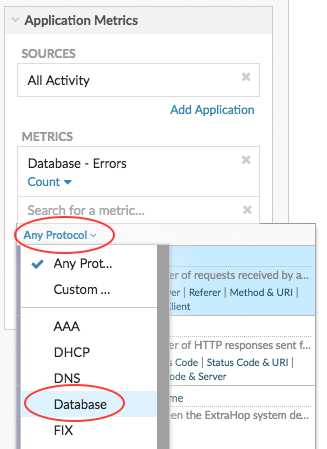
In the Metrics field, click Any Protocol and select
Database. This shortcut helps narrow down your search
for metrics by protocol.
-
From the bottom of the page, click the Line chart.
Next steps
Let's continue to add more database error charts to reveal a bigger picture about database errors on your network.What is the percentage of errors happening on my network?
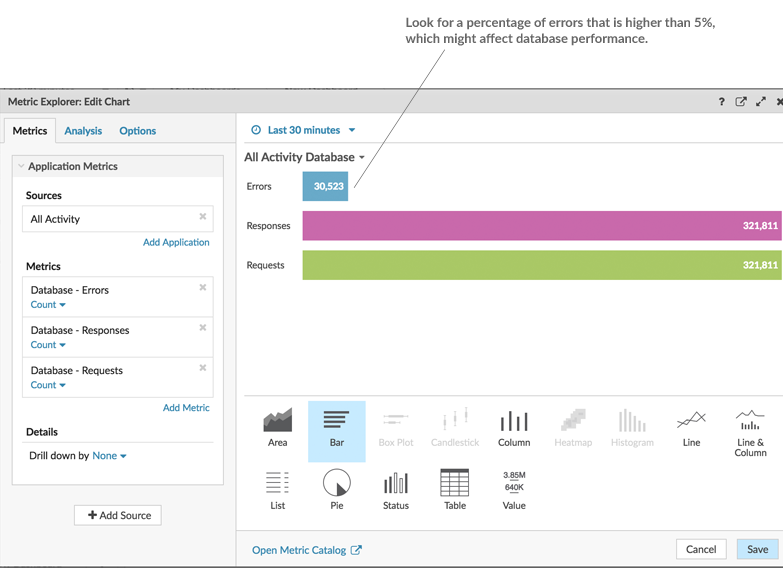
Comparing the number of database errors to the number of database transactions (requests and responses) can help you gauge the scope of issues on your network.
-
From the bottom of the page, click the Bar chart. You
can now calculate the ratio of errors to transactions.
Next steps
You now have three charts that help you visualize the health of databases in your network. Next, let's add charts that help you drill into the cause of database errors.Which operations methods are causing the errors?
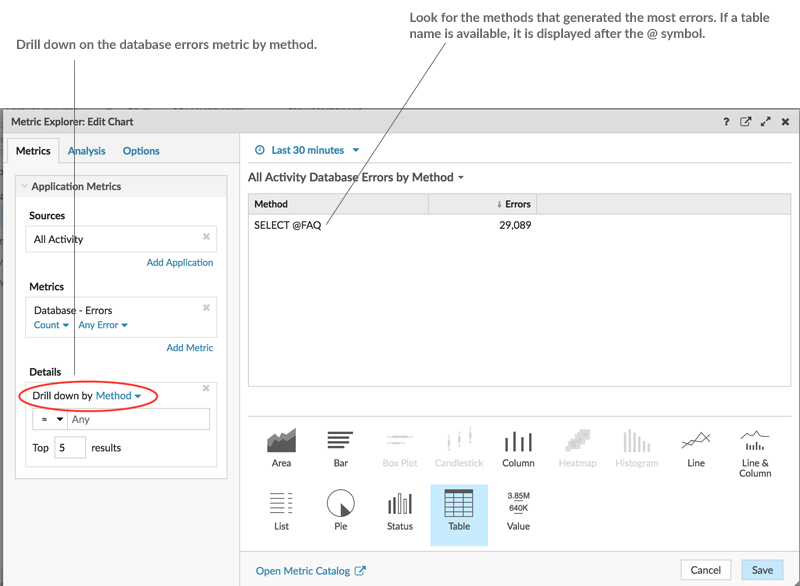
Methods describe database operations. Uncovering the methods associated with database errors can help you determine the type of instance related to the database errors. If an operation is called against a table, the table name is displayed after an @ symbol.
-
In the same chart you are editing, click Drill down by
<None> from the Details section and select
Methods. In a dashboard, you can drill down on a
top-level metric, such as database errors, and view up to 20 of the methods that
contributed to the overall number of database errors on your network.
Next steps
You now have a chart that helps you track database errors to specific operations. Next, let's track a metric about database performance.Evaluate server processing times by server
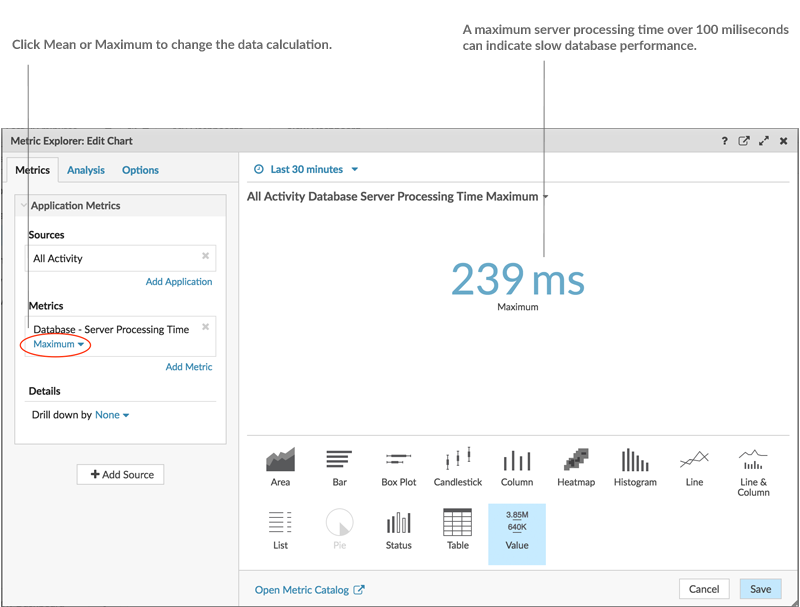
Let's explore the performance of database instances by looking at the server processing time metric. In the ExtraHop system, server processing time is calculated as the time it takes the server to send the first packet of a response after receiving the last packet of a request. High server processing time can indicate resource contention.
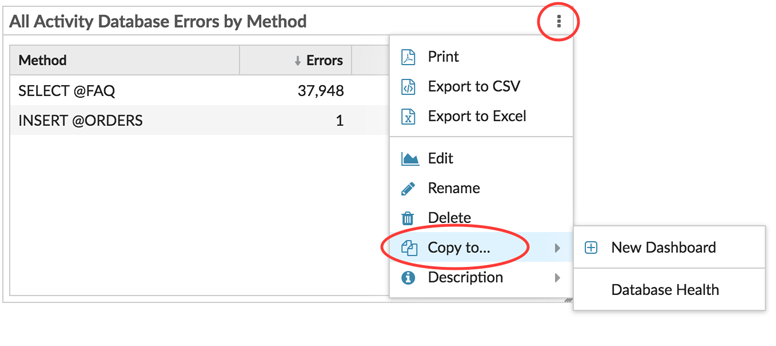
Before adding a processing time chart to your dashboard, let's first add another region to the dashboard to organize the charts into logical groups.
-
On one of the charts, click the command menu in the upper right
corner.
-
Hover over Copy to… and select the name of your
dashboard from the menu. The most recently created dashboards are listed at the
bottom of the flyout menu. This step creates a copy of the chart in a new
region.
-
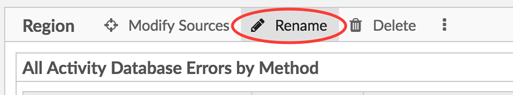
In the new region, click Rename. Type
Database Performance and then click
Save.
-
At the bottom of the window, click the Value chart. This
value represents the slowest time a database instance took to process a query
and prepare the response.
-
In the Details section, click Drill down by <None>
and then select Server.
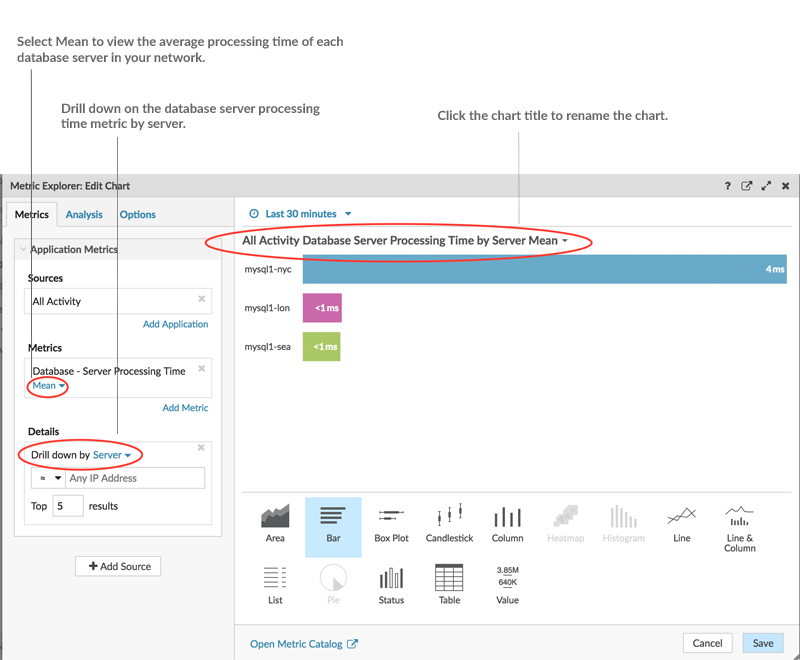
Note: To display more servers, type a larger number into the Top results field. You can view up to 20 drill-down items in a dashboard chart.
Next steps
Your dashboard is complete! You can now monitor the general health of database transactions on your network. The following sections offer additional tips for analyzing database metrics from your dashboard.Compare different time intervals
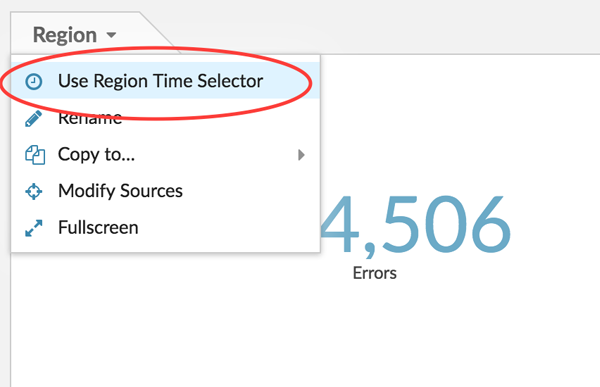
By applying a delta comparison of time intervals to your charts, you can see changes in data from two time intervals side-by-side.
-
Click the region header and select Use Region Time
Selector.
-
Click Save. You will now see the delta comparison of
metrics in all charts within the region.
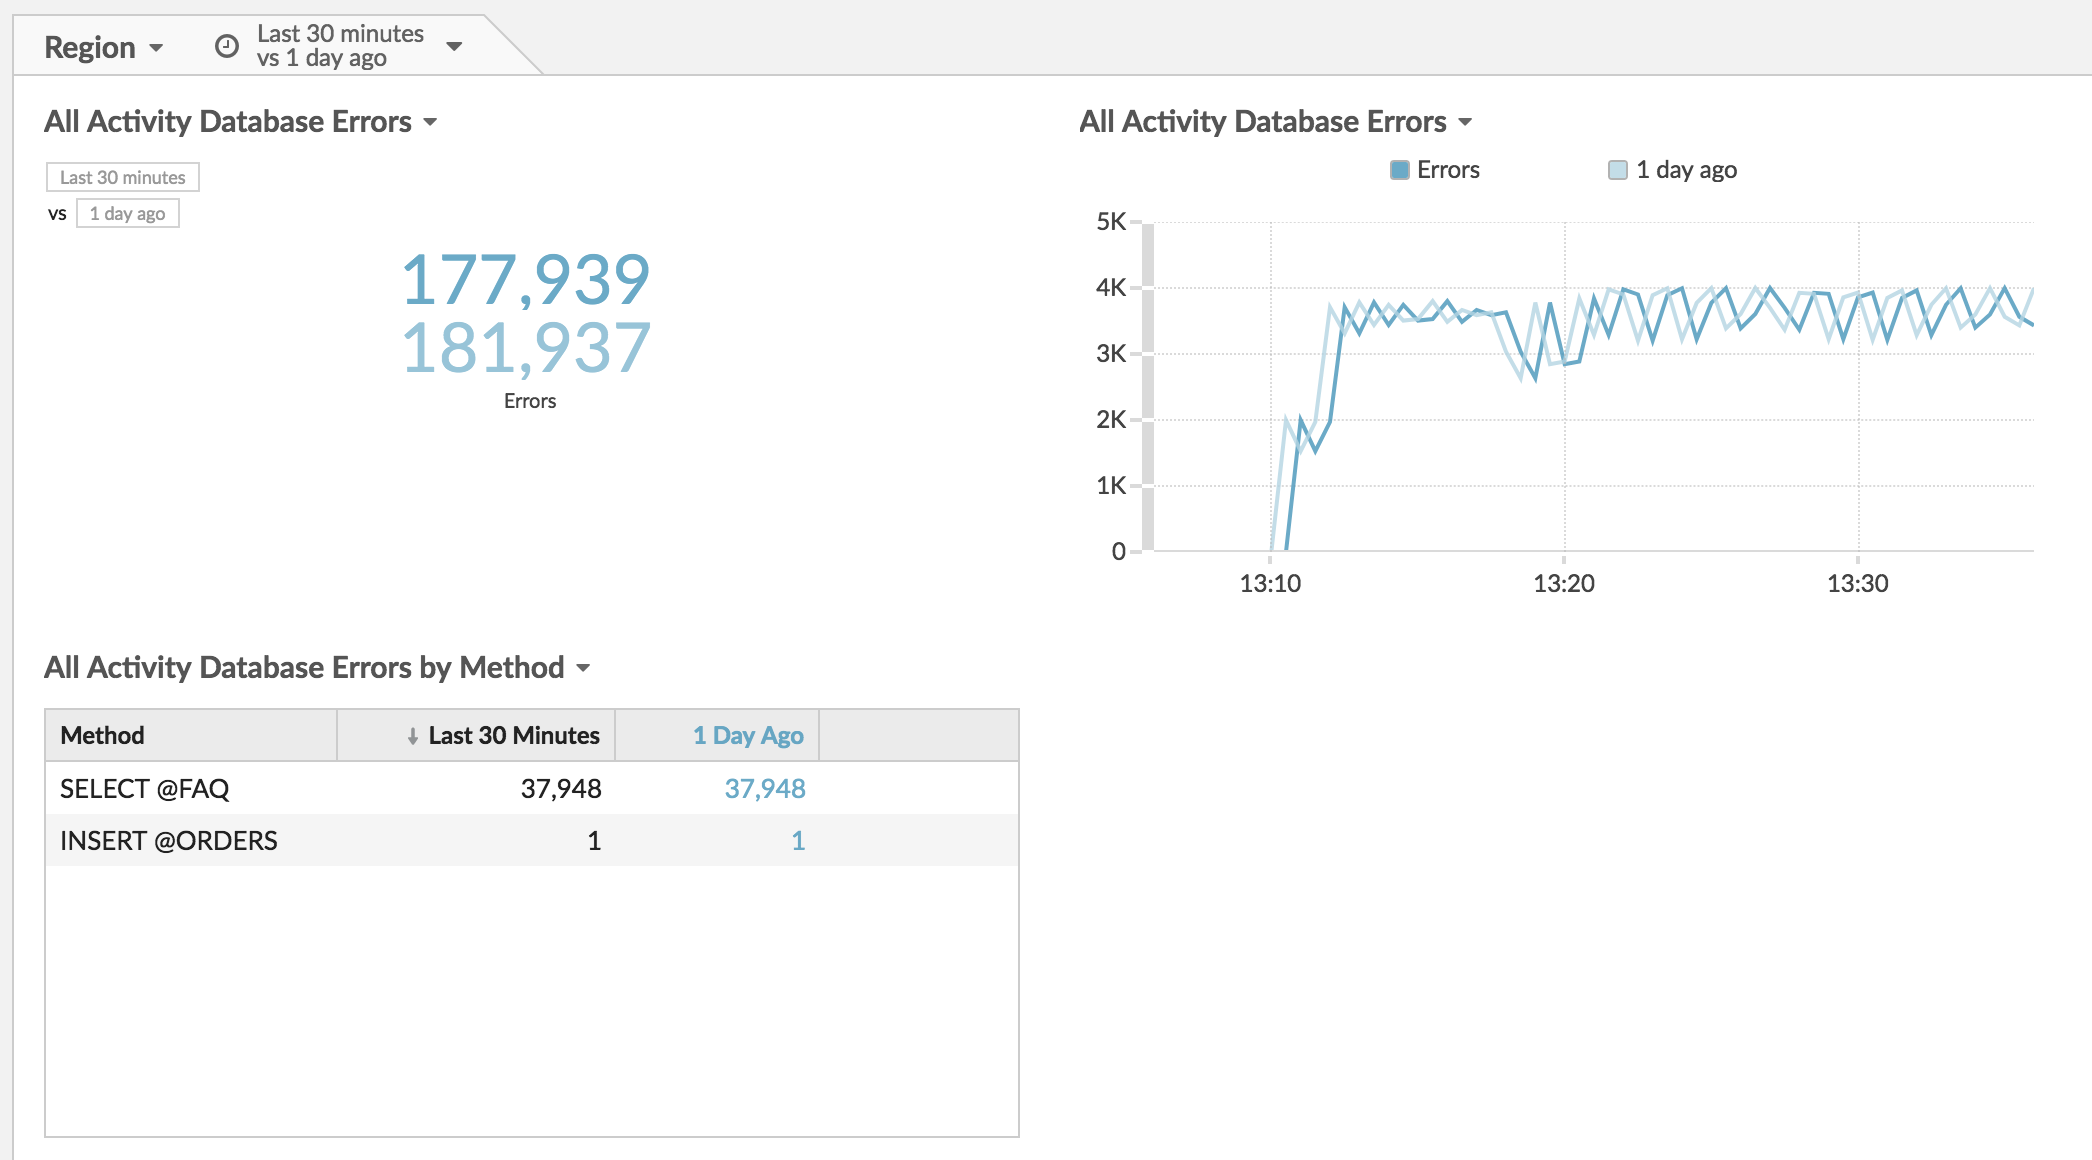
Note: You can perform a delta comparison for the entire dashboard by changing the global time interval. The global time interval is located at the top left corner of the dashboard page.
Additional database metrics to monitor
Database errors and server processing time are a couple of sources of information about the health of database traffic. Here are suggestions for other metrics that you can add to your dashboard to answer the following questions.
| Question | Database metric | Database metrics to add to your dashboard |
|---|---|---|
| Who is connecting to a database instance? | Database Requests, drill down by User | The ExtraHop system tracks who creates a session (connection) with a database server instance. A database user is determined during the negotiation phase of a connection to a database instance. In the ExtraHop system, database users are listed by login name, or as anonymous, unknown, and pre-login. |
| Are database servers experiencing a significant load? | Database Requests |
Requests cover a range of operations: connection negotiations, session configuration, data definition language (DDL), data modification language (DML), or data reads (select). The number of requests provide insight into the load on a database instance. Fluctuations in requests can indicate when a service might become resource-constrained. |
| Is the network affecting database transactions? | Database Round Trip Time | Round trip time (RTT) is calculated by observing the time it takes for packets to travel across the network between the database server and client. A high RTT can indicate network latency. |
Thank you for your feedback. Can we contact you to ask follow up questions?