Monitor DNS errors in a dashboard
The Domain Name System (DNS) is an essential service for resolving hostnames to IP addresses. Any system that needs to locate and communicate with other systems depends on DNS.
While DNS is typically a resilient service that you might not worry much about, DNS server errors can wreak havoc on the end-user experience for email, authentication systems, websites, and databases.
To monitor when and where DNS errors occur on your network, we recommend that you build a dashboard in the ExtraHop system. Dashboards include multiple types of charts that reveal different types of information about a single metric, which can help shed light on the underlying cause of DNS errors.
- How many DNS errors do I have?
- What is the percentage of DNS errors on my network?
- When did the DNS errors occur?
- Which queries are causing DNS errors?
- Which DNS servers are returning the errors?
- Are DNS errors affecting the performance of my other servers (such as database or applications)?
Prerequisites
- You must have access to an ExtraHop system with a user account that has limited or full write privileges.
- Your ExtraHop system must also have network data with DNS traffic.
- Familiarize yourself with the concepts in this walkthrough by reading the Dashboards topic.
If you do not have access to DNS server data or the right privileges, you can perform this walkthrough in the ExtraHop demo.
Create a dashboard
To create your own dashboard to display DNS metrics, complete the following steps:
- Log in to the ExtraHop system through https://<extrahop-hostname-or-IP-address>.
- At the top of the page, click Dashboards.
-
Click the command menu
 in the upper right corner and select New
Dashboard to create an empty dashboard.
in the upper right corner and select New
Dashboard to create an empty dashboard.
- Type a name for your dashboard in the Title field. For this walkthrough, type DNS Errors.
- Click Create. When you create a new dashboard, a workspace opens in an editable layout mode. This workspace contains a single region and two empty widgets: a chart and a text box.
-
Text box widgets can include custom explanatory text about a dashboard or
chart. For this walkthrough, however, we won't be adding text. Delete the text
box by completing the following steps:
-
Click the command menu in the upper right corner of the text box
widget and select Delete.
- Click Delete Widget.
-
Click the command menu
Next steps
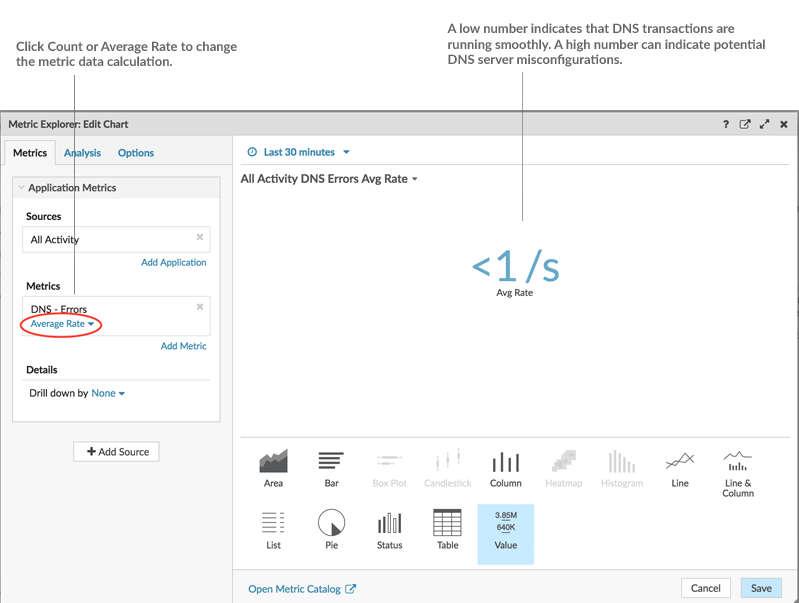
Let's add DNS error metrics to the empty chart.How many errors do I have?
These steps show you how to create a chart to display the DNS error rate for a specified time interval.
To build dashboard charts in this walkthrough, you'll select the All Activity application as a source. All Activity is a metric source that is available by default to all users and contains metrics about all of the devices discovered on your network.
-
Click Count and select Average
Rate.
Next steps
Let's continue to add more DNS error charts to reveal a bigger picture about DNS errors on your network.What is the percentage of errors happening on my network?
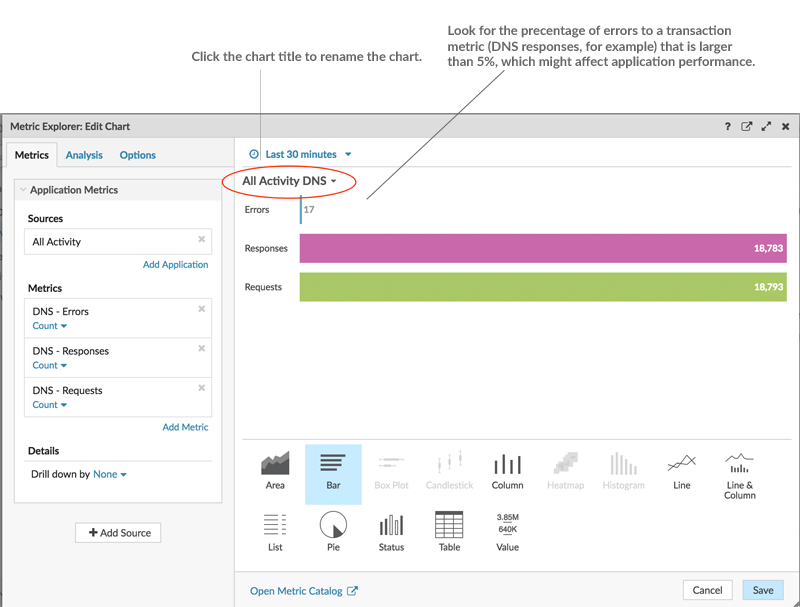
Comparing the number of DNS errors to the number of DNS transactions (requests and responses) can help you gauge the scope of DNS issues on your network.
-
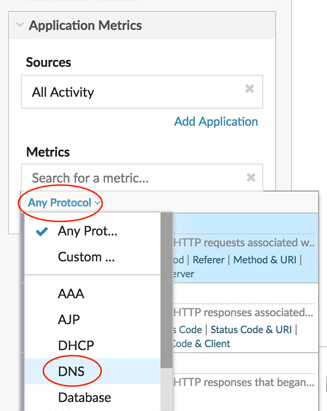
In the Metrics field, click Any Protocol and select
DNS. This shortcut can help you narrow down your
search for metrics by protocol.
-
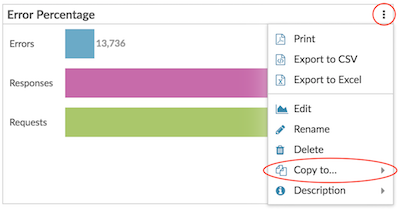
Click the chart title and select Rename. Type
Error Percentage in the custom title field.
Next steps
You can now calculate the ratio of DNS errors to DNS transactions.When did the DNS errors occur?
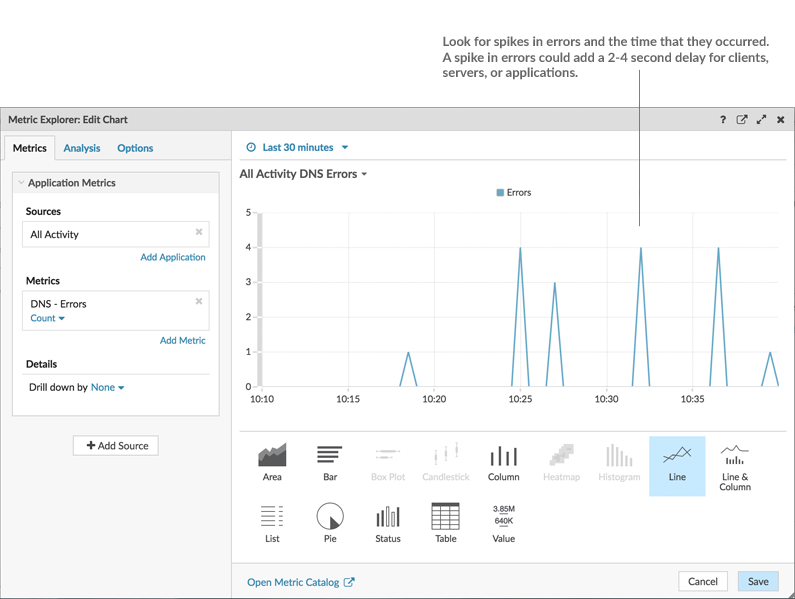
Now that you have determined the scope of DNS errors, let's take a look at when the errors occurred and how they changed over time.
-
From the bottom of the page, click Line chart.
Next steps
You now have three charts that help you visualize the health of DNS transactions occurring on your network. Next, let's add charts that help you drill into the cause of DNS errors and see the effect they're having on your overall network.Which host queries are causing the DNS errors?
A host query is sent by a client to retrieve the IP address for a hostname (for example, for "extrahop.com") from a DNS server. If the DNS server responds to the query with an error, the server might be misconfigured for the domain associated with the hostname.
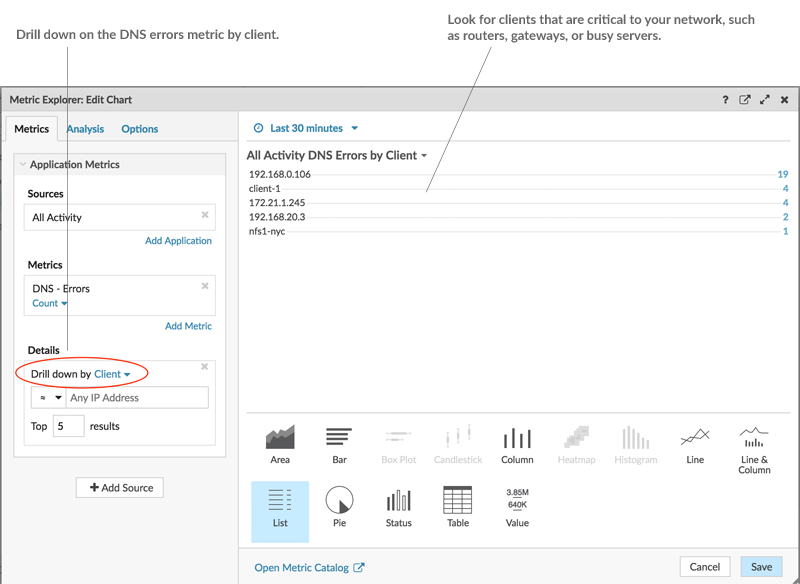
You can drill down on the DNS error metric in a chart to display up to 20 of the top hostname queries that contributed to the total number of DNS errors on your network.
Before adding a new host queries chart to your dashboard, let's first add another region to the dashboard to better organize the current charts into logical groups.
-
On the "Error Percentage" chart, click the command menu in the upper right
corner.
-
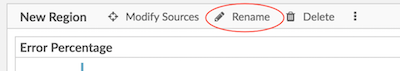
In the new region, click Rename. Type DNS
Error Details and click Save.
-
In the Details section, click Drill down by <None>
and select Host Query.
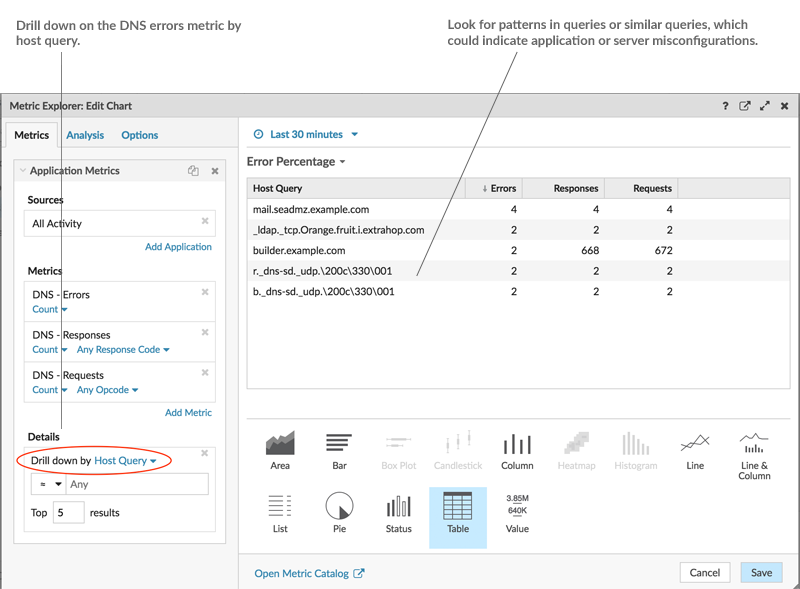
Tip: To display more queries, type a larger number into the Top results field. You can view up to 20 drill-down items in a dashboard chart.
Next steps
After identifying queries that are not resolving or causing errors, you can begin to troubleshoot the DNS server configurations in your network environment.Which DNS servers are returning errors?
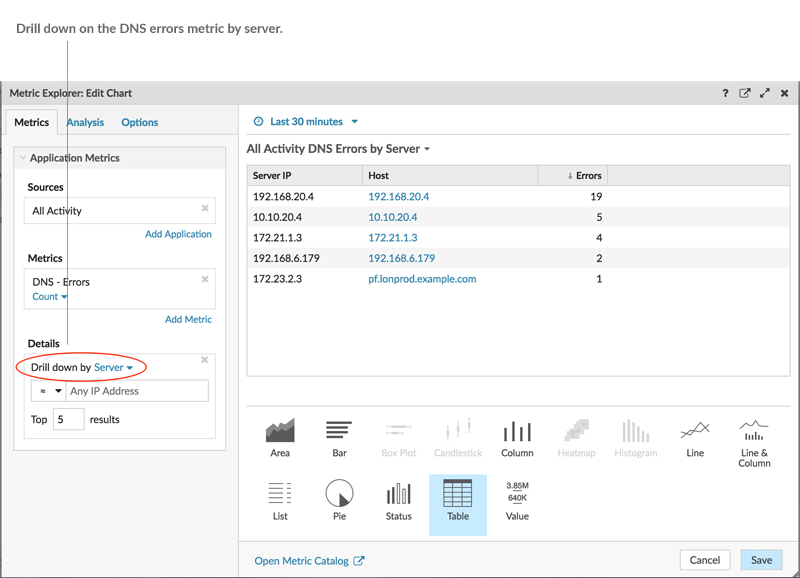
Knowing which servers are returning DNS errors and how many errors each server sent can help you troubleshoot DNS issues.
-
In the Details section, click Drill down by <None>
and select Server.
Next steps
You can now determine which servers sent the most DNS errors, potentially due to server misconfigurations.Are DNS errors affecting the performance of my other servers?
You can determine which applications, databases, and other servers are negatively affected by DNS errors. Let's create a chart that breaks down the number of DNS errors by the clients that received the most errors.
-
In the Details section, click Drill down by <None>
and select Client.
Note: You can add a sparkline to your list chart to view how the number of metrics for each client changed over time. Click the Options tab and select Include sparkline.
Next steps
Your dashboard is complete! You can now monitor DNS errors for troubleshooting. The following sections offer additional tips for analyzing DNS issues from your dashboard.Compare different time intervals
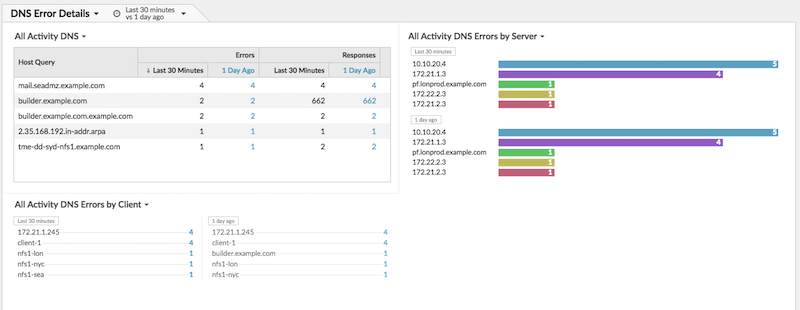
By applying a delta comparison of time intervals to your charts, you can see changes in data from two time intervals side-by-side.
-
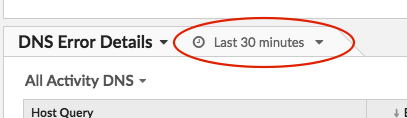
Next to the DNS Error Details region header, click Last 30
Minutes.
-
Click Save. You will now see a comparison of metrics in
all charts within the region, as shown in the figure below.
Note: You can do a delta comparison for the entire dashboard by changing the global time interval. The global time interval is located at the top left corner of the dashboard page.
Additional DNS metrics to monitor
DNS errors are one source of information about the health of DNS traffic in your network. The following table has additional metrics that you can add to your dashboard to answer the following questions:
| Question | DNS metric | Description |
|---|---|---|
| Are DNS servers dropping requests? | DNS Request Timeouts | DNS requests that don't receive a response from a DNS server are potential bottlenecks. Server timeouts can cause slowdowns and breakage for servers, clients, and applications. |
| Are there security breaches related to DNS? | DNS Requests, drill down by host query and filter for "WPAD" or "ISATAP." | Web Proxy Auto Discovery (WPAD) and Intra-Site Automatic Tunnel Addressing Protocol (ISATAP) are examples of host queries that are related to known security risks. |
| Is the network affecting DNS transactions? | DNS Round Trip Time | Round trip time (RTT) is calculated by observing the time it takes for packets to travel across the network between devices. A high RTT can indicate network latency. |
Thank you for your feedback. Can we contact you to ask follow up questions?