Explore metrics in the ExtraHop system to investigate DNS failures
The DNS (domain name system) protocol is critical for supporting internet traffic. It often works without issues. However, DNS servers are commonly misconfigured or overloaded in IT environments, which can affect internet performance.
There are many ways to explore DNS metrics in the ExtraHop system. In this walkthrough, we'll show you how to review DNS metrics in a dashboard, navigate to DNS protocol pages, and drill-down on interesting metrics to identify potentially-affected devices.
- Is there a network or DNS issue that is affecting internet performance?
- What are the number of DNS failures on my network?
- Which clients are affected by DNS issues?
- Learn about interpreting DNS metrics in the ExtraHop system by viewing our online training module, Quick Peek: DNS.
- Learn about problem DNS queries and errors that you can monitor in your own environment by installing the ExtraHop DNS Bundle. This bundle contains a dashboard with pre-configured charts and detailed explanations about key DNS errors.
- Learn how to build a dashboard to monitor DNS errors.
Prerequisites
- Familiarize yourself with the concepts in this walkthrough by reading the Protocol Metrics Reference and the Metrics FAQ.
- You must have access to an ExtraHop system with DNS server traffic, or you can perform this walkthrough in the ExtraHop demo.
Identify DNS issues with system dashboards
If a slow internet issue is reported, look at the system dashboards to determine whether the issue is related to network throughput or to the DNS protocol.
-
Confirm that the Network Throughput and L2
Packets charts show normal or consistent peaks, similar to the
figure below. A large discrepancy between maximum rates and average rates can
indicate network issues are affecting internet performance. Otherwise, continue
your investigation into DNS metrics.

-
Scroll down to the All Activity DNS Server Processing Time
and All Activity DNS charts.
-
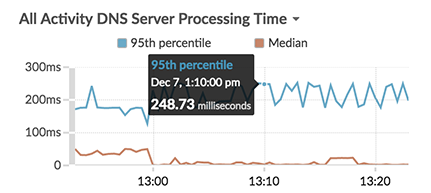
The All Activity DNS Server Processing Time chart
shows you the time between the last packet of a DNS request from a
client and the first packet of a DNS response from the server. Hover
over the median to compare the processing time at the same time point. A
large difference between the median value and 95th percentile indicates
that something might be wrong with a DNS server in your network.
-
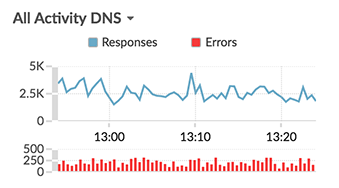
The All Activity DNS chart correlates responses
and errors. A spike in errors can add delays of two to four seconds for
clients, servers, applications, and customers. In the figure below, the
proportion of responses to errors looks consistent.
-
The All Activity DNS Server Processing Time chart
shows you the time between the last packet of a DNS request from a
client and the first packet of a DNS response from the server. Hover
over the median to compare the processing time at the same time point. A
large difference between the median value and 95th percentile indicates
that something might be wrong with a DNS server in your network.
View the number of DNS Request Timeouts
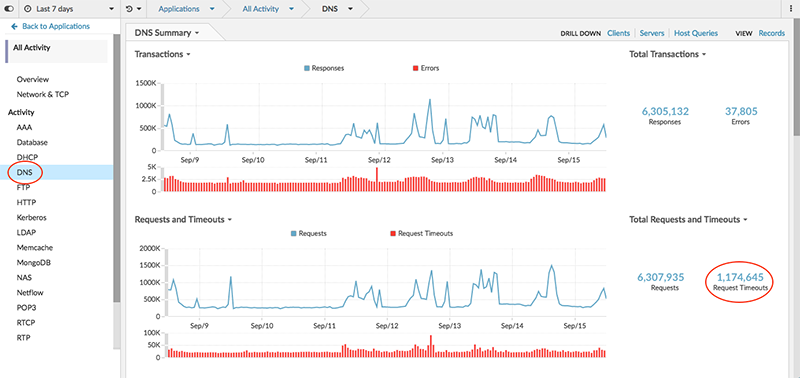
The DNS metric, Request Timeouts, indicates a failure to fulfill a DNS request. DNS servers that are not fulfilling requests can negatively affect application and internet performance. Let's look at the total number of Request Timeouts for DNS servers on our network on a protocol page. The protocol page for the All Activity application provides an overview of important metrics for all the activity across your network, including DNS protocol activity. We can then drill-down to see which DNS servers are timing out.
-
View the number of Request Timeouts. In the figure below,
the number is high (1,174,645) and worth investigating further.
-
Click the metric value for Request Timeouts and then select
Server, as shown in the figure below.
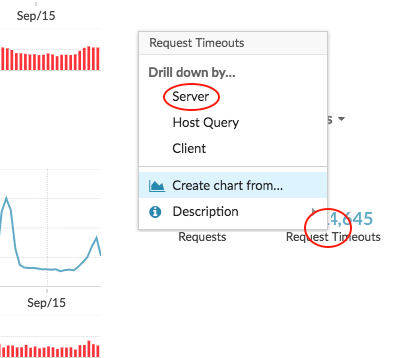
A detail metric page appears that displays all the server IP addresses in your network with request timeouts. -
Note which devices have the highest number of Request Timeouts. In the figure
below, this is Device 192.168.35.103.

Find the clients affected by DNS Request Timeouts
You can now identify which clients sent requests to this DNS server and might be affected by DNS Request Timeouts.
-
In the DRILL DOWN section near the top of the page, click
Clients.
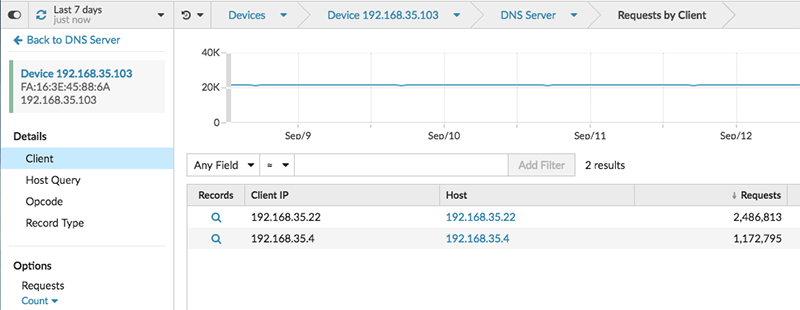
A detail metric page appears that displays all the client IP addresses that sent requests to the DNS server.
Next steps
From this detail metric page, you can also learn about which host queries and record types were included in the requests by selecting an option in the Details section of the left pane. Or, investigate related metrics for each client by clicking the link in the Host column.Based on the data you gathered, you can now contact the team responsible for maintaining this specific DNS server, because it might be misconfigured or experiencing other issues.
Thank you for your feedback. Can we contact you to ask follow up questions?