Introduction to the ExtraHop system
The ExtraHop system provides a comprehensive network detection and response solution for tracking security threats and IT operations. You can monitor how applications consume network resources, how systems and devices communicate with each other, and how transactions flow across the data link layer (L2) to application layer (L7) in your network.
This guide explains how the ExtraHop system collects and analyzes your data and how the core system functionalities can help you access top-level and detailed metrics, transactions, and packets about the traffic on your network.
Smart Sensor Analytics
ExtraHop system provides a smart sensor that captures, stores, and analyzes metric data about your network—and offers different levels of data analysis, collection, and storage based on your needs. The sensor is provisioned with storage to support 30 days of metric lookback. Note that actual lookback varies by traffic patterns, transaction rates, the number of endpoints, and the number of active protocols.
The browser-based system interface provides tools that enable you to explore and visualize data, investigate findings in both top-down and bottoms-up workflows, and customize how you collect, view, and share your network data.
Metric Analytics
The ExtraHop system collects and stores multiple depths of network interactions. Packets are the raw data transferred between two endpoints. Records are structured information about transaction, message, and network flows. Metrics are aggregated observations about endpoint interactions over time.
For example, when a client sends an HTTP request to a web server, here is what each data type contains:
- The packet contains the raw data that was sent and received in the interaction.
- The related record contains the time-stamped metadata about the interaction: when the request happened, the IP address of the client and server, the requested URI, any error messages.
- The related metric (HTTP Requests) contains an aggregate of that interaction with other observed interactions during the specified time period, such as how many requests occurred, how many of those requests were successful, how many clients sent requests, and how many servers received the requests.
Both metrics and records can be customized to extract and store specific metadata with JavaScript-based triggers. While the ExtraHop system has over 4600 built-in metrics, you might want to create a custom metric that collects and aggregates 404 errors from only critical web servers. And, you might want to maximize your record storage space by only collecting transactions that occurred over a suspicious port.
Data feeds
The type of data feed you connect to the ExtraHop system determines how data is collected, stored, and analyzed.
Wire data
The ExtraHop system passively collects a copy of unstructured packets through a port mirror or tap and stores the data in the local datastore. The copied data goes through real-time stream processing that transforms the packets into structured wire data through the following stages:
- TCP state machines are recreated to perform full-stream reassembly.
- Packets are collected and grouped into flows.
- The structured data is analyzed and processed in the following ways:
- Transactions are identified
- Devices are automatically discovered and classified by their activity.
- Metrics are generated and associated with protocols and sources, and the metric data is then aggregated into metric cycles.
- As new metrics are generated and stored, and the datastore becomes full, the oldest existing metrics are overwritten according to the first-in first-out (FIFO) principle.
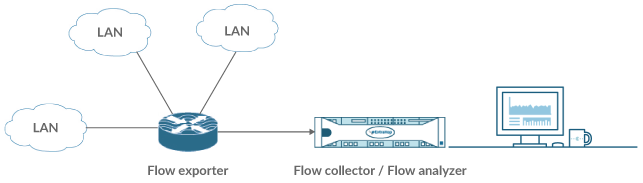
Flow data
Alternatively, you can configure the ExtraHop system to collect flows from machine data on remote networks. A flow is a set of packets that are part of a single connection between two endpoints. By analyzing flows of network traffic, an administrator can identify the top network flows (most bytes consumed), top network talkers (highest throughput), total number of bytes, and the total number of packets per router interface.
- NetFlow v5
- The Cisco proprietary protocol that defines a flow as a unidirectional flow of packets that share the following values: ingress interface, source and destination IP address, IP protocol, source and destination ports, and the type of service. NetFlow v5 has a fixed record format with 20 fields and cannot be customized.
- NetFlow v9
- An adapted version of NetFlow v5 where the record format is template based. NetFlow v9 has 60+ fields in the records and can be customized. In the ExtraHop system, these records are only partially parsed until the template packet is detected.
- IPFIX
- An open standard based on the NetFlow v9 standard. The ExtraHop system supports only the native format; formats where the Enterprise bit is set outside of a trigger are not supported.
- AppFlow
- The Citrix implementation of IPFIX with customized extensions to include application-level information such as HTTP URLs, HTTP request methods, status codes, and so on.
- sFlow
- A sampling technology for monitoring traffic in data networks. sFlow samples every nth packet and sends it to the collector whereas NetFlow sends data from every flow to the collector. The primary difference between sFlow and NetFlow is that sFlow is network layer independent and can sample anything. NetFlow v5 is IP based, but v9 and IPFIX can also look at Layer 2.
Flow log data (Reveal(x) only)
The ExtraHop system passively collects data from flow logs on a flow sensor to help analyze interactions to and from your network interfaces. Data from flow logs can include network traffic, service events, and cloud instances, all of which can be monitored through metrics and detections on a flow sensor.
Software frame deduplication
The ExtraHop system removes duplicate L2 and L3 frames and packets when metrics are collected and aggregated from your network activity by default. L2 deduplication removes identical Ethernet frames (where the Ethernet header and the entire IP packet must match); L3 deduplication removes TCP or UDP packets with identical IP ID fields on the same flow (where only the IP packet must match).
The ExtraHop system checks for duplicates and removes only the immediately-previous packet both on the flow (for L3 deduplication) or globally (for L2 deduplication) if the duplicate arrives within 1 millisecond of the original packet.
By default, the same packet traversing different VLANs is removed by L3 deduplication. In addition, packets must have the same length and the same IP ID, and TCP packets also must have the same TCP checksum.
L2 duplication usually only exists if the exact same packet is seen through the data feed, which is typically related to an issue with port mirroring. L3 duplication is often the result of mirroring the same traffic across multiple interfaces of the same router, which can show up as extraneous TCP retransmissions in the ExtraHop system.
The System Health page contains charts that display L2 and L3 duplicate packets that were removed by the ExtraHop system. Deduplication works across 10Gbps ports by default and across 1Gbps ports if software RSS is enabled. L3 deduplication currently is supported only for IPv4, not IPv6.
Device discovery
The ExtraHop system can discover and track devices by their MAC address (L2 Discovery) or by their IP addresses (L3 Discovery). L2 Discovery offers the advantage of tracking metrics for a device even if the IP address is changed or reassigned through a DHCP request.
Device IPv4 and IPv6 addresses are learned from Address Resolution Protocol (ARP) messages, the Neighbor Discovery Protocol (NDP) responses, local broadcasts, or local subnet multicast traffic. The MAC address and IP address for devices appear in search results and throughout the system with the device information.
After a device is discovered, the ExtraHop system begins to collect metrics based on the analysis level configured for that device through analysis priorities. You can search for devices by their MAC address, IP address, or name (such as a hostname observed from DNS traffic, NetBIOS name, Cisco Discovery Protocol (CDP) name, DHCP name, or a custom name that you assigned to the device).
| Important: | Previous versions of the ExtraHop system were configured for L3 Discovery by default. If your ExtraHop system is upgraded to version 8.0, the Device Discovery settings do not change automatically. If you switch to L2 Discovery, metrics begin accumulating on different devices with the same IP address. Learn how to enable L2 Discovery. |
L2 Discovery
The ExtraHop system creates a device entry for every local MAC address discovered over the wire. IP addresses are mapped to the MAC address, but metrics are stored with the device MAC address even if the IP address changes.
IP addresses observed outside of locally-monitored broadcast domains are aggregated at one of the incoming routers in your network. If a device sends a DHCP request through a router acting as a DHCP relay agent, the ExtraHop system detects and maps the IP address to the device MAC address. If the IP address changes for the device with a subsequent request through the DHCP relay agent, the ExtraHop system updates its mapping and continues to keep track of the device metrics by the MAC address.
Both MAC address and IP address are discovered for the remote device.
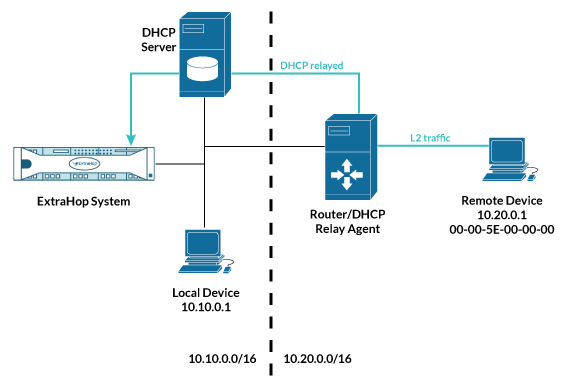
If a DHCP relay agent is not configured, remote devices can be discovered by their IP addresses through Remote L3 Discovery.
L3 Discovery
When L3 Discovery is enabled, the ExtraHop system creates and links two entries for each local discovered device: an L2 parent entry with a MAC address and an L3 child entry with IP addresses and the MAC address.
Here are some important considerations about L3 discovery:
-
If a router has proxy ARP enabled, the ExtraHop system creates an L3 device for each IP address that the router answers ARP requests for.
-
If you have a proxy ARP configured in your network, the ExtraHop system might automatically discover remote devices.
-
L2 metrics that cannot be associated with a particular L3 child device (for example, L2 broadcast traffic) are associated with the L2 parent device.
-
L2 parent devices that are not gateways or custom devices do not count towards your licensed analysis capacity. These devices are configured for the L2 Parent Analysis level.
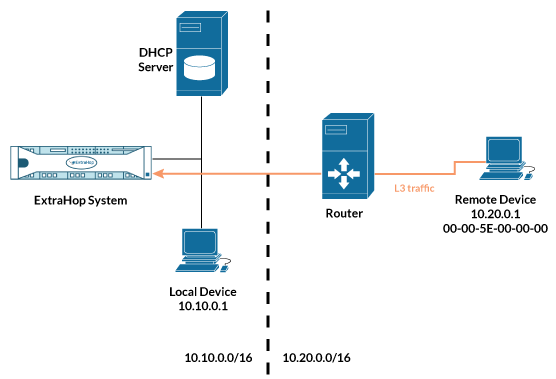
Remote L3 Discovery
If the ExtraHop system detects an IP address that does not have associated ARP or NDP traffic, that device is considered a remote device. Remote devices are not automatically discovered, but you can add a remote IP address range and discover devices that are outside of the local network. A device entry is created for each IP address that is observed within the remote IP address range. (Remote devices do not have L2 parent entries.)
Only the IP address is discovered for the remote device.
Here are some conditions about when you should configure Remote L3 Discovery:
-
Your organization has a remote office without an on-site ExtraHop system but users at that site access central data center resources that are directly monitored by an ExtraHop system. The IP addresses at the remote site can be discovered as devices.
-
A cloud service or other type of off-site service hosts your remote applications and has a known IP address range. The remote servers within this IP address range can be individually tracked.
Network locality
By default, any device with an RFC1918 IP address (included in a 10/8, 172.16/12, or 192.168/16 CIDR block) is classified on the system as an internal device.
However, because some network environments include non-RFC1918 IP addresses as part of their internal network, you can change the internal or external classification for IP addresses from the Network Localities page.
Centralized Management
The ExtraHop system can be configured as a centralized system with connections to multiple sensors, data warehouses, and packetstores that are distributed across data centers, branch offices, and cloud services.
The system interface on the Command appliance and Reveal(x) 360 provides visibility across all of your data in a single view and enables you to sync certain advanced configurations (such as triggers and alerts) and settings (tuning parameters, analysis priorities, and recordstores)
Here are some benefits to centralized management:
- Create a dashboard that displays sensor data from each of your remote offices.
- Query for records and view detections that show potential issues across multiple sites.
- Limit user accounts to a single system instead of creating multiple accounts for each sensor.
Thank you for your feedback. Can we contact you to ask follow up questions?