Protocol Metrics Reference
This guide provides definitions for all of the built-in metric charts in the ExtraHop system. Charts are available by protocol, by asset, and in system dashboards.
Metrics are real-time measurements of your network behavior that the ExtraHop system calculates from wire or flow data. The ExtraHop system can analyze and classify over 5,000 metrics from network traffic, and then associate the metrics with a source—the assets on your network, such as applications, devices, activity groups, or networks.
Working with metrics
Here are some ways you can work with metrics:
- Select an asset as a metric source throughout the ExtraHop system when creating dashboard charts, configuring alerts, or building triggers.
- View metrics and access protocol pages from a Device Overview page.
- View metrics in the system Security, Network, and Activity dashboards.
- Drill down from top-level metrics to view detail metrics pages, which provide a list of metric values for a specific key (such as a client or server IP address). For example, if you are looking at the total number of errors, click the number and select Servers to see which servers returned the errors.
- Add additional sources or metrics to a chart.
- View all built-in and custom metrics available in the Metric Catalog.
- Create a custom metric to collect data that is not included a built-in metric.
- Export chart data to Excel or CSV.
- Create a PDF of a dashboard or chart.
- Create a chart
- Create an activity map.
- Search for devices by protocol activity.
- Find detections.
Types of metrics
Each metric in the ExtraHop system is classified into a metric type. Understanding the distinctions between metric types can help you configure charts or write triggers to capture custom metrics. For example, a heatmap chart can only display dataset metrics.
- Count
- The number of events that occurred over a specific time period. You can view count metrics as a rate or a total count. For example, a byte is recorded as a count, and can either represent a throughput rate (as seen in a time series chart) or total traffic volume (as seen in a table). Rates are helpful for comparing counts over different time periods. A count metric can be calculated as a per-second average over time. When viewing high-precision, or 1-second, bytes and packet metrics, you can also view a maximum rate and minimum rate. Count metrics include errors, packets, and responses.
- Count rate
-
The number of events that occurred over a specific time period. Count rate metrics and count metrics are calculated the same way. However, count rate metrics capture additional details that enable you to view the maximum and minimum rate for an interval. Count rate metrics include bytes and packets.
- Distinct count
-
The number of unique events that occurred during a selected time interval. The distinct count metric provides an estimate of the number of unique items placed into a set during the selected time interval. Estimates are calculated with the HyperLogLog algorithm.
- Dataset
- A distribution of data that can be calculated into percentile values. Dataset metrics include processing time and round trip time.
- Maximum
- A single data point that represents the maximum value from a specified time period.
- Sampleset
- A summary of data about a detail metric. Selecting a sampleset metric in a chart enables you to display a mean (average) and standard deviation over a specified time period.
- Snapshot
- A data point that represents a single point in time.
Metrics by protocol
Each protocol page includes built-in charts with top-level metrics about your assets. These metric charts can be copied to your dashboards.
AAA
The ExtraHop system collects metrics about Authentication, Authorization, and Accounting (AAA) protocol activity. AAA is a security framework that includes application-level network access protocols such as RADIUS, Diameter, TACACS, and TACACS+.
AAA application page
This page displays metric charts of AAA traffic associated with an application container on your network.
- Learn about charts on this page:
- Learn about working with metrics.
AAA Summary
The following charts are available in this region:
- Transactions
- This chart shows you when AAA errors and responses were associated with the
application. This information can help you see how active the application was at the
time the errors occurred.
In a healthy environment, the number of requests and responses should be roughly equal. For more information, see Requests and Responses.
Metric Description Responses The number of AAA responses. Errors The number of AAA response errors. - Total Transactions
- This chart displays the total number of AAA responses that were associated with the
application and how many of those responses contained errors.
Metric Description Responses The number of AAA responses. Errors The number of AAA response errors. - Performance (95th Percentile)
-
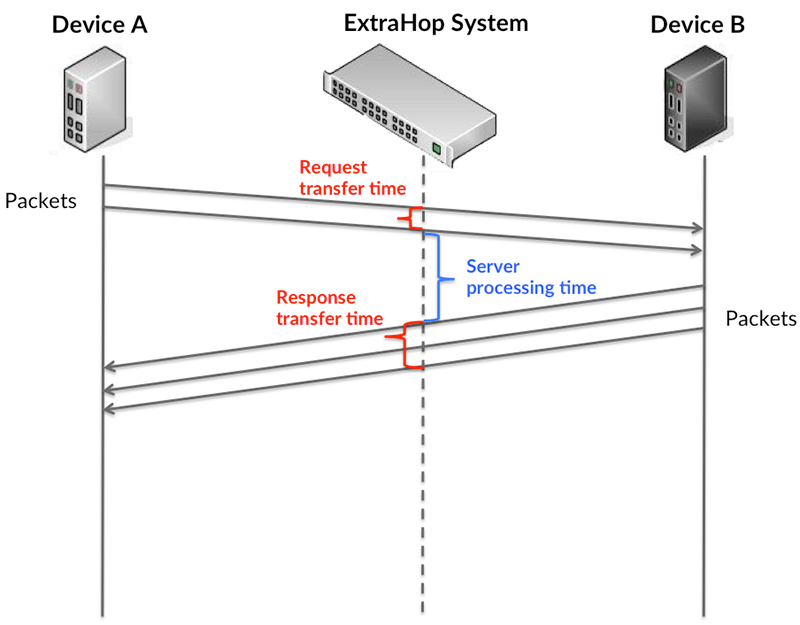
This chart shows the 95th percentile of timing metrics,
measured in milliseconds. The transfer and processing time metrics show parts of a
complete transaction. The request transfer time shows how long clients took to transmit
requests onto the network; the server processing time shows how long the servers took to
process requests; and the response transfer time shows how long the servers took to
transmit responses onto the network.
Transfer and processing times are calculated by measuring the time between when the first and last packets of requests and responses are seen by the ExtraHop system, as shown in the following figure:
It can be difficult to tell whether an issue is caused by a network or a device from looking only at transfer and processing times, because these metrics alone provide an incomplete picture. Therefore the round trip time (RTT) metric is also included in this chart. RTT metrics are a good indicator of how your network is performing. If you see high transfer or processing times, but the RTT is low, the issue is probably at the device-level. However, if the RTT, processing, and transfer times are all high, network latency might be affecting the transfer and processing times, and the issue might be with the network.
The RTT metric can help identify the source of the problem because it only measures how long an immediate acknowledgment takes to be sent from the client or server; it does not wait until all packets are delivered.
The ExtraHop system calculates the RTT value by measuring the time between the first packet of a request and the acknowledgment from the server, as shown in the following figure:
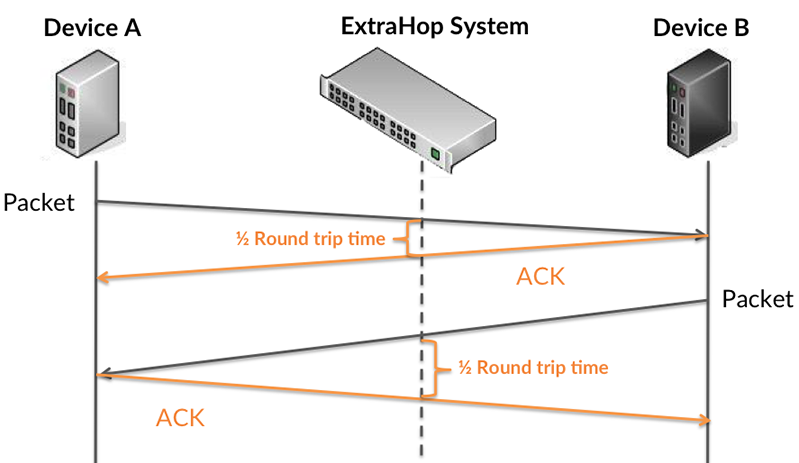
The request transfer time might be high because the client took a long time to transmit the request (possibly because the request was very large); however, the transfer time could also be high because the request took a long time to travel on the network (possibly because of network congestion).
Learn more about how the ExtraHop system calculates round trip time on the ExtraHop blog.
Metric Description Request Transfer Time The time between the ExtraHop system detecting the first packet and the last packet of an AAA request. A high number might indicate a large request or network delay. Server Processing Time The time between the ExtraHop system detecting the last packet of an AAA request and the first packet of the corresponding response. Response Transfer Time The time between the ExtraHop system detecting the first packet and the last packet of an AAA response. A high value might indicate a large response or network delay. Round Trip Time The time between when an AAA client or server sent a packet that required immediate acknowledgment and when the acknowledgment was received. The Performance (95th percentile) chart shows the highest value for a time period while filtering outliers; the 95th percentile is the highest value that falls below 95% of the values for a sample period. By displaying the 95th value, rather than the true maximum, the chart gives you a more accurate view of the data:
- Performance (95th)
-
This chart shows the 95th percentile of timing
metrics, measured in milliseconds. If an application is acting slow, performance
summary metrics can help you figure out whether the network or servers are causing the
issue. These metrics show the 95th percentile of time that servers took to process
requests from clients versus the 95th percentile time that packets from those requests
(and their respective responses) took to be transmitted across the network. High
server processing times indicate that clients are contacting slow servers. High TCP
round trip times indicate that clients are communicating over slow networks.
Metric Description Server Processing Time The time between the ExtraHop system detecting the last packet of an AAA request and the first packet of the corresponding response. Round Trip Time The time between when an AAA client or server sent a packet that required immediate acknowledgment and when the acknowledgment was received.
AAA Details
The following charts are available in this region:
- Top Methods
- This chart shows which AAA methods were associated with the application by breaking out the total number of AAA requests by method.
- Top Error Types
- This chart shows which AAA error types were associated with the application the most by breaking out the number of responses by error type.
AAA Performance
The following charts are available in this region:
- Server Processing Time Distribution
-
This chart breaks out server processing times in a histogram to
show the most common processing times, measured in milliseconds.
Metric Description Server Processing Time The time between the ExtraHop system detecting the last packet of an AAA request and the first packet of the corresponding response. - Server Processing Time
-
This chart shows the median processing time for the
application, measured in milliseconds.
Metric Description Server Processing Time The time between the ExtraHop system detecting the last packet of an AAA request and the first packet of the corresponding response. - Round Trip Time Distribution
-
This chart breaks out round trip times in a histogram to show the
most common round trip times, measured in milliseconds.
Metric Description Round Trip Time The time between when an AAA client or server sent a packet that required immediate acknowledgment and when the acknowledgment was received. - Round Trip Time
-
This chart shows the median round trip time for the application,
measured in milliseconds.
Metric Description Round Trip Time The time between when an AAA client or server sent a packet that required immediate acknowledgment and when the acknowledgment was received.
AAA Network Data
This region shows you TCP information that is related to the current protocol. In general, host stalls indicate that there is an issue with either a server or a client, and network stalls indicate that there is an issue with the network.
- Host Stalls
-
This chart shows the number of zero windows that were
associated with an application. Devices control the amount of data they receive by
specifying the number of packets that can be sent to them over a given time period.
When a device is sent more data than it can process, the device advertises a zero
window to ask its peer device to stop sending packets completely until the device
catches up. If you see a large number of zero windows, a server or client might not be
not fast enough to support the amount of data being received.
Metric Definition Request Zero Windows The number of zero window advertisements that were sent by AAA clients. A device advertises a Zero Window when incoming data is arriving too quickly to be processed. A large number of incoming Zero Windows indicates that a peer device was too slow to process the amount of data received.
Response Zero Windows The number of zero window advertisements sent by servers while receiving AAA requests. A device advertises a Zero Window when incoming data is arriving too quickly to be processed. A large number of outgoing Zero Windows indicates that a client was too slow to process the amount of data received.
- Total Host Stalls
- This chart shows the median number of zero window advertisements sent by devices.
- Network Stalls
-
This chart shows the number of retransmission
timeouts that occurred. Retransmission timeouts (RTOs) occur when a network drops too
many packets, usually due to packet collisions or buffer exhaustion. If a device sends
a request or response and does not receive confirmation within a specified amount of
time, the device retransmits the request. If too many retransmissions are
unacknowledged, an RTO occurs. If you see a large number of RTOs, the network might be
too slow to support the current level of activity.
Metric Definition RTOs In The number of retransmission timeouts caused by congestion when clients were sending AAA requests. An RTO is a 1-5 second stall in the TCP connection flow due to excessive retransmissions. If you see a large number of incoming RTOs, a device did not send an acknowledgment to the server quickly enough, or the network might be too slow to support the current level of activity. Depending on the timeout value configured in the operating system, this delay can be anywhere from 1 to 8 seconds.
RTOs Out The number of retransmission timeouts caused by congestion when servers were sending AAA responses. An RTO is a 1-5 second stall in the TCP connection flow due to excessive retransmissions. If you see a large number of outgoing RTOs, a device did not receive an acknowledgment from the server quickly enough, or the network might be too slow to support the current level of activity. Depending on the timeout value configured in the operating system, this delay can be anywhere from 1 to 8 seconds.
- Total Network Stalls
-
This chart shows the median number of
retransmission timeouts caused by congestion when clients and servers were sending
requests.
Metric Definition RTOs In The number of retransmission timeouts caused by congestion when clients were sending AAA requests. An RTO is a 1-5 second stall in the TCP connection flow due to excessive retransmissions. If you see a large number of incoming RTOs, a device did not send an acknowledgment to the server quickly enough, or the network might be too slow to support the current level of activity. Depending on the timeout value configured in the operating system, this delay can be anywhere from 1 to 8 seconds.
RTOs Out The number of retransmission timeouts caused by congestion when servers were sending AAA responses. An RTO is a 1-5 second stall in the TCP connection flow due to excessive retransmissions. If you see a large number of outgoing RTOs, a device did not receive an acknowledgment from the server quickly enough, or the network might be too slow to support the current level of activity. Depending on the timeout value configured in the operating system, this delay can be anywhere from 1 to 8 seconds.
AAA Metric Totals
The following charts are available in this region:
- Total Requests and Responses
-
Requests and responses represent the conversation taking place between clients and servers. If there are more requests than responses, clients might be sending more requests than servers can handle or the network might be too slow. To identify whether the issue is with the network or a server, check RTOs and zero windows in the Network Data section.
Note: It is unlikely that the total number of AAA requests and responses will be exactly equal, even in a healthy environment. For example, you might be viewing a time period that captures a response to a request that was sent before the start of the time period. In general, the greater the difference between responses and errors, the greater the chance that there is an issue with those transactions. Metric Description Requests The number of AAA requests that were sent. Responses The number of AAA responses. Errors The number of AAA response errors. Diameter Request The number of Diameter requests that were sent. Diameter is an updated version of the RADIUS AAA protocol. RADIUS Request The number of RADIUS (Remote Authentication Dial-In User Service) requests that were sent. Aborts The number of AAA protocol sessions that were aborted. - AAA Network Metrics
-
Metric Description Request Zero Windows The number of zero window advertisements that were sent by AAA clients. A device advertises a Zero Window when incoming data is arriving too quickly to be processed. Response Zero Windows The number of zero window advertisements sent by servers while receiving AAA requests. A device advertises a Zero Window when incoming data is arriving too quickly to be processed. Request RTOs The number of retransmission timeouts caused by congestion when clients were sending AAA requests. An RTO is a 1-5 second stall in the TCP connection flow due to excessive retransmissions. Response RTOs The number of retransmission timeouts caused by congestion when servers were sending AAA responses. An RTO is a 1-5 second stall in the TCP connection flow due to excessive retransmissions. Request L2 Bytes The number of L2 bytes sent that were associated with AAA requests. Response L2 Bytes The number of L2 bytes sent that were associated with AAA responses. Request Goodput Bytes The number of goodput bytes associated with AAA requests. Goodput refers to the throughput of the original data transferred and excludes other throughput such as protocol headers or retransmitted packets. Response Goodput Bytes The number of goodput bytes associated with AAA responses. Goodput refers to the throughput of the original data transferred and excludes other throughput such as protocol headers or retransmitted packets. Request Packets The number of packets sent that were associated with AAA requests. Response Packets The number of packets sent that were associated with AAA responses.
AAA client page
This page displays metric charts of AAA client traffic associated with a device on your network.
- Learn about charts on this page:
- Learn about working with metrics.
AAA Summary
The following charts are available in this region:
- Transactions
- This chart shows you when AAA errors occurred and how many responses the AAA client
received. This information can help you see how active the client was at the time it
received the errors.
In a healthy environment, the number of requests and responses should be roughly equal. For more information, see Requests and Responses.
Metric Description Responses The number of AAA responses that were received when the device was acting as an AAA client. Errors The number of AAA response errors that were received when the device was acting as an AAA client. - Total Transactions
- This chart displays the total number of AAA responses the client received and how many
of those responses contained errors.
Metric Description Responses The number of AAA responses that were received when the device was acting as an AAA client. Errors The number of AAA response errors that were received when the device was acting as an AAA client. - Performance (95th Percentile)
- This chart shows the 95th percentile of timing metrics, measured in milliseconds. The
server processing time shows how long servers took to process requests from clients.
Processing times are calculated by measuring the time between when the first and last
packets of requests and responses are seen by the ExtraHop system, as shown in the
following figure:
It can be difficult to tell whether an issue is caused by a network or a device from looking only at the processing time, because this metric alone provides an incomplete picture. Therefore the round trip time (RTT) metric is also included in this chart. RTT metrics are a good indicator of how your network is performing. If you see high processing times, but the RTT is low, the issue is probably at the device-level. However, if the RTT and processing times are both high, network latency might be affecting the transfer and processing times, and the issue might be with the network.
RTT only measures how long an immediate acknowledgment takes to be sent; it does not wait until all packets are delivered. Therefore, RTT is a good indicator of how your network is performing. If you see high processing times, but the TCP RTT is low, the issue is probably at the device-level. Check the network for latency issues if the TCP RTT and processing times are all both.
The RTT metric can help identify the source of the problem because it only measures how long an immediate acknowledgment takes to be sent from the client or server; it does not wait until all packets are delivered.
The processing time might be high because the server took a long time to transmit the response (possibly because the response was very large); however, the processing time could also be high because the response took a long time to travel on the network (possibly because of network congestion).
Learn more about how the ExtraHop system calculates round trip time on the ExtraHop blog.
Metric Description Server Processing Time The time between the ExtraHop system detecting the last packet of a sent AAA request and the first packet of the corresponding response when the device was acting as an AAA client. Round Trip Time The time between when an AAA client sent a packet that required immediate acknowledgment and when the acknowledgment was received. Round trip time (RTT) is a measurement of network latency. The Performance (95th percentile) chart shows the highest value for a time period while filtering outliers; the 95th percentile is the highest value that falls below 95% of the values for a sample period. By displaying the 95th value, rather than the true maximum, the chart gives you a more accurate view of the data:
- Performance Summary (95th Percentile)
-
This chart shows the 95th percentile of timing
metrics, measured in milliseconds. If a client is acting slow, performance summary
metrics can help you figure out whether the network or servers are causing the issue.
These metrics show the 95th percentile amount of time that servers took to process
requests from the client versus the 95th percentile time that packets from those
requests (and their respective responses) took to be transmitted across the network.
High server processing times indicate that the client is contacting slow servers. High
TCP round trip times indicate that the client is communicating over slow
networks.
Metric Description Server Processing Time The time between the ExtraHop system detecting the last packet of a sent AAA request and the first packet of the corresponding response when the device was acting as an AAA client. Round Trip Time The time between when an AAA client sent a packet that required immediate acknowledgment and when the acknowledgment was received. Round trip time (RTT) is a measurement of network latency.
AAA Details
The following charts are available in this region:
- Top Methods
- This chart shows which AAA methods the client called the most by breaking out the total number of requests the client sent by method.
- Top Error Types
- This chart shows which AAA error types the client received the most by breaking out the number of responses returned to the client by error type.
AAA Performance
The following charts are available in this region:
- Server Processing Time Distribution
-
This chart breaks out server processing times in a histogram to
show the most common processing times, measured in milliseconds.
Metric Description AAA Client Server Processing Time The time between the ExtraHop system detecting the last packet of a sent AAA request and the first packet of the corresponding response when the device was acting as an AAA client. - Server Processing Time
-
This chart shows the median processing time for the client,
measured in milliseconds.
Metric Description AAA Client Server Processing Time The time between the ExtraHop system detecting the last packet of a sent AAA request and the first packet of the corresponding response when the device was acting as an AAA client. - Round Trip Time Distribution
-
This chart breaks out round trip times in a histogram to show the
most common round trip times, measured in milliseconds.
Metric Description Round Trip Time The time between when an AAA client sent a packet that required immediate acknowledgment and when the acknowledgment was received. Round trip time (RTT) is a measurement of network latency. - Round Trip Time
-
This chart shows the median round trip time for the client, measured in
milliseconds.
Metric Description Round Trip Time The time between when an AAA client sent a packet that required immediate acknowledgment and when the acknowledgment was received. Round trip time (RTT) is a measurement of network latency.
Network Data
This region shows you TCP information that is related to the current protocol. In general, host stalls indicate that there is an issue with either the server or the client, and network stalls indicate that there is an issue with the network.
- Host Stalls
- This chart shows the number of zero windows that were advertised or received by the
device. Devices control the amount of data they receive by specifying the number of
packets that can be sent to them over a given time period. When a device is sent more
data than it can process, the device advertises a zero window to ask its peer device to
stop sending packets completely until the device catches up. If you see a large number
of zero windows, a server or client might not be not fast enough to support the amount
of data being received.
Metric Definition Zero Windows In The number of zero windows that were sent to the device to stop the flow of data over the connection. A device advertises a Zero Window when incoming data is arriving too quickly to be processed. A large number of zero windows in indicates that a peer device was too slow to process the amount of data received.
Zero Windows Out The number of zero windows that were sent from the device to stop the flow of data. A device advertises a Zero Window when incoming data is arriving too quickly to be processed. A large number of zero windows out indicates that the client was too slow to process the amount of data received.
- Network Stalls
-
This chart shows the number of retransmission timeouts that occurred. Retransmission timeouts (RTOs) occur when a network drops too many packets, usually due to packet collisions or buffer exhaustion. If a device sends a request or response and does not receive confirmation within a specified amount of time, the device retransmits the request. If too many retransmissions are unacknowledged, an RTO occurs. If you see a large number of RTOs, the network might be too slow to support the current level of activity.
Metric Definition RTOs In The number of retransmission timeouts (RTOs) caused by network congestion as peers were sending data to the current device. An RTO is a 1-5 second stall in the TCP connection flow due to excessive retransmissions. If you see a large number of RTOs in, the device did not send an acknowledgment to the server quickly enough, or the network might be too slow to support the current level of activity. Depending on the timeout value configured in the operating system, this delay can be anywhere from 1 to 8 seconds.
RTOs Out The number of retransmission timeouts (RTOs) caused by network congestion as the device was sending data to its peers. An RTO is a 1-5 second stall in the TCP connection flow due to excessive retransmissions. If you see a large number of RTOs out, the device did not receive an acknowledgment from the server quickly enough, or the network might be too slow to support the current level of activity. Depending on the timeout value configured in the operating system, this delay can be anywhere from 1 to 8 seconds.
AAA Metric Totals
The following charts are available in this region:
- Requests and Responses
-
Requests and responses represent the conversation taking place between clients and servers. If there are more requests than responses, the client might be sending more requests than the servers can handle or the network might be too slow. To identify whether the issue is with the network or the server, check RTOs and zero windows in the Network Data section.
Note: It is unlikely that the total number of AAA requests and responses will be exactly equal, even in a healthy environment. For example, you might be viewing a time period that captures a response to a request that was sent before the start of the time period. In general, the greater the difference between responses and errors, the greater the chance that there is an issue with those transactions. Metric Description Requests The number of AAA requests that were sent when the device was acting as an AAA client. Responses The number of AAA responses that were received when the device was acting as an AAA client. Errors The number of AAA response errors that were received when the device was acting as an AAA client. Diameter Request The number of Diameter requests that were sent when the device was acting as an AAA client. Diameter is an updated version of the RADIUS AAA protocol. RADIUS Request The number of RADIUS (Remote Authentication Dial-In User Service) requests that were sent when the device was acting as an AAA client. . Aborts The number of aborted sessions that occurred when the device was acting as an AAA client.
AAA server page
This page displays metric charts of AAA server traffic associated with a device on your network.
- Learn about charts on this page:
- Learn about working with metrics.
AAA Summary
The following charts are available in this region:
- Transactions
- This chart shows you when AAA errors occurred and how many AAA responses the server
sent. This information can help you see how active the server was at the time it
returned the errors.
In a healthy environment, the number of requests and responses should be roughly equal. For more information, see Requests and Responses.
Metric Description Responses The number of AAA responses that were sent when the device was acting as an AAA server. Errors The number of AAA response errors that were sent when the device was acting as an AAA server. - Total Transactions
-
This chart displays the total number of AAA responses the server sent and how many of those responses contained errors.
Metric Description Responses The number of AAA responses that were sent when the device was acting as an AAA server. Errors The number of AAA response errors that were sent when the device was acting as an AAA server. - Performance (95th Percentile)
- This chart shows the 95th percentile of timing metrics, measured in milliseconds. The
server processing time shows how long servers took to process requests from clients.
Processing times are calculated by measuring the time between when the first and last
packets of requests and responses are seen by the ExtraHop system, as shown in the
following figure:
It can be difficult to tell whether an issue is caused by a network or a device from looking only at the processing time, because this metric alone provides an incomplete picture. Therefore the round trip time (RTT) metric is also included in this chart. RTT metrics are a good indicator of how your network is performing. If you see high processing times, but the RTT is low, the issue is probably at the device-level. However, if the RTT and processing times are both high, network latency might be affecting the transfer and processing times, and the issue might be with the network.
RTT only measures how long an immediate acknowledgment takes to be sent; it does not wait until all packets are delivered. Therefore, RTT is a good indicator of how your network is performing. If you see high processing times, but the TCP RTT is low, the issue is probably at the device-level. Check the network for latency issues if the TCP RTT and processing times are all both.
The RTT metric can help identify the source of the problem because it only measures how long an immediate acknowledgment takes to be sent from the client or server; it does not wait until all packets are delivered.
The processing time might be high because the server took a long time to transmit the response (possibly because the response was very large); however, the processing time could also be high because the response took a long time to travel on the network (possibly because of network congestion).
Learn more about how the ExtraHop system calculates round trip time on the ExtraHop blog.
Metric Description Server Processing Time The time between the ExtraHop system detecting the last packet of a received AAA request and the first packet of the corresponding response when the device was acting as an AAA server. Round Trip Time The time between when an AAA server sent a packet that required an immediate acknowledgment and when the acknowledgment was received. Round trip time (RTT) is a measurement of network latency. The Performance (95th percentile) chart shows the highest value for a time period while filtering outliers; the 95th percentile is the highest value that falls below 95% of the values for a sample period. By displaying the 95th value, rather than the true maximum, the chart gives you a more accurate view of the data:
- Performance Summary (95th Percentile)
-
This chart shows the 95th percentile of timing
metrics, measured in milliseconds. If a server is acting slow, performance summary
metrics can help you figure out whether the network or the server is causing the
issue. The performance summary metrics show the 95th percentile amount of time the
server took to process requests from clients versus the 95th percentile time that
packets from those requests (and their respective responses) took to be transmitted
across the network. High server processing times indicate that the server is slow.
High RTTs indicate that the server is communicating over slow networks.
Metric Description Server Processing Time The time between the ExtraHop system detecting the last packet of a received AAA request and the first packet of the corresponding response when the device was acting as an AAA server. Round Trip Time The time between when an AAA server sent a packet that required an immediate acknowledgment and when the acknowledgment was received. Round trip time (RTT) is a measurement of network latency.
AAA Details
The following charts are available in this region:
- Top Methods
- This chart shows which AAA methods were called on the server the most by breaking out the total number of requests the server received by method.
- Top Error Types
- This chart shows which AAA error types the server returned the most by breaking out the total number of responses the server sent by error type.
AAA Performance
The following charts are available in this region:
- Server Processing Time Distribution
-
This chart breaks out server processing times in a histogram to
show the most common processing times, measured in milliseconds.
Metric Description AAA Server Server Processing Time The time between the ExtraHop system detecting the last packet of a received AAA request and the first packet of the corresponding response when the device was acting as an AAA server. - Server Processing Time
-
This chart shows the median processing time for the server,
measured in milliseconds.
Metric Description AAA Server Server Processing Time The time between the ExtraHop system detecting the last packet of a received AAA request and the first packet of the corresponding response when the device was acting as an AAA server. - Round Trip Time Distribution
-
This chart breaks out round trip times in a histogram to show the
most common round trip times, measured in milliseconds.
Metric Description Round Trip Time The time between when an AAA server sent a packet that required an immediate acknowledgment and when the acknowledgment was received. Round trip time (RTT) is a measurement of network latency. - Round Trip Time
-
This chart shows the median round trip time for the server, measured in
milliseconds.
Metric Description Round Trip Time The time between when an AAA server sent a packet that required an immediate acknowledgment and when the acknowledgment was received. Round trip time (RTT) is a measurement of network latency.
Network Data
This region shows you TCP information that is related to the current protocol. In general, host stalls indicate that there is an issue with either the server or the client, and network stalls indicate that there is an issue with the network.
- Host Stalls
- This chart shows the number of zero windows that were advertised or received by the
device. Devices control the amount of data they receive by specifying the number of
packets that can be sent to them over a given time period. When a device is sent more
data than it can process, the device advertises a zero window to ask its peer device to
stop sending packets completely until the device catches up. If you see a large number
of zero windows, a server or client might not be not fast enough to support the amount
of data being received.
Metric Definition Zero Windows In The number of zero windows that were sent to the device to stop the flow of data over the connection. A device advertises a Zero Window when incoming data is arriving too quickly to be processed. A large number of zero windows in indicates that a peer device was too slow to process the amount of data received.
Zero Windows Out The number of zero windows that were sent from the device to stop the flow of data. A device advertises a Zero Window when incoming data is arriving too quickly to be processed. A large number of zero windows out indicates that the client was too slow to process the amount of data received.
- Network Stalls
-
This chart shows the number of retransmission timeouts that occurred. Retransmission timeouts (RTOs) occur when a network drops too many packets, usually due to packet collisions or buffer exhaustion. If a device sends a request or response and does not receive confirmation within a specified amount of time, the device retransmits the request. If too many retransmissions are unacknowledged, an RTO occurs. If you see a large number of RTOs, the network might be too slow to support the current level of activity.
Metric Definition RTOs In The number of retransmission timeouts (RTOs) caused by network congestion as peers were sending data to the current device. An RTO is a 1-5 second stall in the TCP connection flow due to excessive retransmissions. If you see a large number of RTOs in, the device did not send an acknowledgment to the server quickly enough, or the network might be too slow to support the current level of activity. Depending on the timeout value configured in the operating system, this delay can be anywhere from 1 to 8 seconds.
RTOs Out The number of retransmission timeouts (RTOs) caused by network congestion as the device was sending data to its peers. An RTO is a 1-5 second stall in the TCP connection flow due to excessive retransmissions. If you see a large number of RTOs out, the device did not receive an acknowledgment from the server quickly enough, or the network might be too slow to support the current level of activity. Depending on the timeout value configured in the operating system, this delay can be anywhere from 1 to 8 seconds.
AAA Metric Totals
The following charts are available in this region:
- Requests and Responses
-
Requests and responses represent the conversation taking place between clients and servers. If there are more requests than responses, clients might be sending more requests than the server can handle or the network might be too slow. To identify whether the issue is with the network or the server, check RTOs and zero windows in the Network Data section.
Note: It is unlikely that the total number of AAA requests and responses will be exactly equal, even in a healthy environment. For example, you might be viewing a time period that captures a response to a request that was sent before the start of the time period. In general, the greater the difference between responses and errors, the greater the chance that there is an issue with those transactions. Metric Description Requests The number of AAA requests that were received when the device was acting as an AAA server. Responses The number of AAA responses that were sent when the device was acting as an AAA server. Errors The number of AAA response errors that were sent when the device was acting as an AAA server. Diameter Request The number of Diameter requests that were received when the device was acting as an AAA server. Diameter is an updated version of the RADIUS AAA protocol. RADIUS Request The number of RADIUS requests that the device received when acting as an AAA server. Aborts The number of aborted sessions that occurred when the device was acting as an AAA server.
AAA client group page
This page displays metric charts of AAA client traffic associated with a device group on your network.
- Learn about charts on this page:
- Learn about working with metrics.
AAA Summary for Group
The following charts are available in this region:
- Transactions
- This chart shows you when AAA errors occurred and how many responses the AAA clients
received. This information can help you see how active the clients were at the time they
received the errors.
In a healthy environment, the number of requests and responses should be roughly equal. For more information, see the Metrics for Group section below.
Metric Description Responses The number of AAA responses that were received when the device was acting as an AAA client. Errors The number of AAA response errors that were received when the device was acting as an AAA client. - Total Transactions
- This chart shows you how many AAA responses the clients received and how many of those
responses contained errors.
Metric Description Responses The number of AAA responses that were received when the device was acting as an AAA client. Errors The number of AAA response errors that were received when the device was acting as an AAA client.
AAA Details for Group
The following charts are available in this region:
- Top Group Members (AAA Clients)
- This chart shows which AAA clients in the group were most active by breaking out the total number of AAA requests the group sent by client.
- Top Methods
- This chart shows which AAA methods the group called the most by breaking out the total number of requests the group sent by method.
- Top Error Types
- This chart shows which AAA error types the group received the most by breaking out the number of responses returned to the group by error type.
AAA Metrics for Group
The following charts are available in this region:
- Total Requests and Responses
-
Requests
and responses represent the conversation taking place between clients and servers. If there
are more requests than responses, the clients might be sending more requests than servers
can handle or the network might be too slow.
Note: It is unlikely that the total number of requests and responses will be exactly equal, even in a healthy environment. For example, you might be viewing a time period that captures a response to a request that was sent before the start of the time period. In general, the greater the difference between responses and errors, the greater the chance that there is an issue with those transactions. Requests The number of AAA requests that were sent when the device was acting as an AAA client. Responses The number of AAA responses that were received when the device was acting as an AAA client. Errors The number of AAA response errors that were received when the device was acting as an AAA client. Diameter Request The number of Diameter requests that were sent when the device was acting as an AAA client. Diameter is an updated version of the RADIUS AAA protocol. RADIUS Request The number of RADIUS (Remote Authentication Dial-In User Service) requests that were sent when the device was acting as an AAA client. . Aborts The number of aborted sessions that occurred when the device was acting as an AAA client. - Server Processing Time
-
If a client group is acting slow, the server processing time
can help you figure out whether the issue is with the servers. The Server Processing Time
chart shows the median amount of time servers took to process requests from the clients,
measured in milliseconds. High server processing times indicate that the clients are
contacting slow servers.
Metric Description Server Processing Time The time between the ExtraHop system detecting the last packet of a sent AAA request and the first packet of the corresponding response when the device was acting as an AAA client.
AAA server group page
This page displays metric charts of AAA server traffic associated with a device group on your network.
- Learn about charts on this page:
- Learn about working with metrics.
AAA Summary for Group
The following charts are available in this region:
- Transactions
- This chart shows you when AAA errors occurred and how many AAA responses the servers
sent. This information can help you see how active the servers were at the time they
returned the errors.
In a healthy environment, the number of requests and responses should be roughly equal. For more information, see the Metrics for Group section below.
Metric Description Responses The number of AAA responses that were sent when the device was acting as an AAA server. Errors The number of AAA response errors that were sent when the device was acting as an AAA server. - Total Transactions
- This chart shows you how many AAA responses servers in the group sent and how many of
those responses contained errors.
Metric Description Responses The number of AAA responses that were sent when the device was acting as an AAA server. Errors The number of AAA response errors that were sent when the device was acting as an AAA server.
AAA Details for Group
The following charts are available in this region:
- Top Group Members (AAA Servers)
- This chart shows which AAA servers in the group were most active by breaking out the total number of AAA responses the group sent by server.
- Top Methods
- This chart shows which AAA methods were called on servers in the group the most by breaking out the total number of requests the group received by method.
- Top Error Types
- This chart shows which AAA error types the groups returned the most by breaking out the total number of responses the group sent by error type.
AAA Metrics for Group
The following charts are available in this region:
- Total Requests and Responses
-
Requests
and responses represent the conversation taking place between clients and servers. If there
are more requests than responses, clients might be sending more requests than the servers
can handle or the network might be too slow.
Note: It is unlikely that the total number of requests and responses will be exactly equal, even in a healthy environment. For example, you might be viewing a time period that captures a response to a request that was sent before the start of the time period. In general, the greater the difference between responses and errors, the greater the chance that there is an issue with those transactions. Metric Description Requests The number of AAA requests that were received when the device was acting as an AAA server. Responses The number of AAA responses that were sent when the device was acting as an AAA server. Errors The number of AAA response errors that were sent when the device was acting as an AAA server. Diameter Request The number of Diameter requests that were received when the device was acting as an AAA server. Diameter is an updated version of the RADIUS AAA protocol. RADIUS Request The number of RADIUS requests that the device received when acting as an AAA server. Aborts The number of aborted sessions that occurred when the device was acting as an AAA server. - Server Processing Time
-
The Server Processing Time chart shows the median amount of
time the servers took to process requests from clients, measured in milliseconds. High
server processing times indicate that the servers in a group are slow.
Metric Description Server Processing Time The time between the ExtraHop system detecting the last packet of a received AAA request and the first packet of the corresponding response when the device was acting as an AAA server.
ADWS
The ExtraHop system collects metrics about Active Directory Web Services (ADWS) activity. ADWS is a Windows interface that provides access to Active Directory through web services protocols.
| Note: | The ExtraHop system does not include any built-in metric pages for ADWS. However, you can view ADWS metrics by adding them to a custom page or dashboard. |
AJP
The ExtraHop system collects metrics about Apache JServ Protocol (AJP) activity. AJP is a binary format for communication between an Apache web server and an application server.
| Note: | The ExtraHop system does not include any built-in metric pages for AJP. However, you can view AJP metrics by adding them to a custom page or dashboard. |
AMF
The ExtraHop system collects metrics about Action Message Format (AMF) protocol activity. AMF is a format for encoding data transported between Adobe Flash clients and servers over HTTP requests and responses.
AMF client page
This page displays metric charts of AMF traffic associated with a device on your network.
- Learn about charts on this page:
- Learn about working with metrics.
AMF Summary
The following charts are available in this region:
- Transactions
- This chart shows you when AMF errors occurred and how many responses the AMF client
received. This information can help you see how active the client was at the time it
received the errors.
In a healthy environment, the number of requests and responses should be roughly equal. For more information, see Requests and Responses.
Metric Description Responses The number of responses that the device received when acting as an HTTP-AMF client. Errors The number of response errors that the device received when acting as an HTTP-AMF client. - Total Transactions
- This chart displays the total number of AMF responses the client received and how many
of those responses contained errors.
Metric Description Responses The number of responses that the device received when acting as an HTTP-AMF client. Errors The number of response errors that the device received when acting as an HTTP-AMF client. - Performance (95th Percentile)
-
This chart shows the 95th percentile of timing metrics, measured in
milliseconds. The transfer and processing time metrics show parts of a complete
transaction. The request transfer time shows how long the client took to transmit requests
onto the network; the server processing time shows how long servers took to process the
requests; and the response transfer time shows how long servers took to transmit responses
onto the network.
Transfer and processing times are calculated by measuring the time between when the first and last packets of requests and responses are seen by the ExtraHop system, as shown in the following figure:
It can be difficult to tell whether an issue is caused by a network or a device from looking only at transfer and processing times, because these metrics alone provide an incomplete picture. Therefore the round trip time (RTT) metric is also included in this chart. RTT metrics are a good indicator of how your network is performing. If you see high transfer or processing times, but the RTT is low, the issue is probably at the device-level. However, if the RTT, processing, and transfer times are all high, network latency might be affecting the transfer and processing times, and the issue might be with the network.
The RTT metric can help identify the source of the problem because it only measures how long an immediate acknowledgment takes to be sent from the client or server; it does not wait until all packets are delivered.
The ExtraHop system calculates the RTT value by measuring the time between the first packet of a request and the acknowledgment from the server, as shown in the following figure:
The request transfer time might be high because the client took a long time to transmit the request (possibly because the request was very large); however, the transfer time could also be high because the request took a long time to travel on the network (possibly because of network congestion).
Learn more about how the ExtraHop system calculates round trip time on the ExtraHop blog.
Request Transfer Time When the device is acting as an HTTP-AMF client, the time between the ExtraHop system detecting the first packet and last packet of sent requests. A high number might indicate a large request or network delay. Server Processing Time When the device is acting as an HTTP-AMF client, the time between the ExtraHop system detecting the last packet of the sent request and the first packet of the received response. Response Transfer Time When the device is acting as an HTTP-AMF client, the time between the ExtraHop system detecting the first packet and last packet of received responses. A high number might indicate a large response or network delay. Round Trip Time The time between when a AMF client sent a packet that required an immediate acknowledgment and when the client received the acknowledgment. Round trip time (RTT) is a measurement of network latency. The Performance (95th percentile) chart shows the highest value for a time period while filtering outliers; the 95th percentile is the highest value that falls below 95% of the values for a sample period. By displaying the 95th value, rather than the true maximum, the chart gives you a more accurate view of the data:
- Performance (95th)
-
This chart shows the 95th percentile of timing
metrics, measured in milliseconds. If a client is acting slow, performance summary
metrics can help you figure out whether the network or servers are causing the issue.
These metrics show the 95th percentile amount of time that servers took to process
requests from the client versus the 95th percentile time that packets from those
requests (and their respective responses) took to be transmitted across the network.
High server processing times indicate that the client is contacting slow servers. High
TCP round trip times indicate that the client is communicating over slow
networks.
Server Processing Time When the device is acting as an HTTP-AMF client, the time between the ExtraHop system detecting the last packet of the sent request and the first packet of the received response. Round Trip Time The time between when a AMF client sent a packet that required an immediate acknowledgment and when the client received the acknowledgment. Round trip time (RTT) is a measurement of network latency.
AMF Performance
The following charts are available in this region:
- Server Processing Time Distribution
-
This chart breaks out server processing times in a histogram to
show the most common processing times, measured in milliseconds.
Metric Description Server Processing Time When the device is acting as an HTTP-AMF client, the time between the ExtraHop system detecting the last packet of the sent request and the first packet of the received response. - Server Processing Time
-
This chart shows the median processing time for the client,
measured in milliseconds.
Metric Description Server Processing Time When the device is acting as an HTTP-AMF client, the time between the ExtraHop system detecting the last packet of the sent request and the first packet of the received response. - Round Trip Distribution
-
This chart breaks out round trip times in a histogram to show the
most common round trip times, measured in milliseconds.
Metric Description Round Trip Time The time between when a AMF client sent a packet that required an immediate acknowledgment and when the client received the acknowledgment. Round trip time (RTT) is a measurement of network latency. - Round Trip Time
-
This chart shows the median round trip time for the client, measured in
milliseconds.
Metric Description Round Trip Time The time between when a AMF client sent a packet that required an immediate acknowledgment and when the client received the acknowledgment. Round trip time (RTT) is a measurement of network latency.
Network Data
This region shows you TCP information that is related to the current protocol. In general, host stalls indicate that there is an issue with either the server or the client, and network stalls indicate that there is an issue with the network.
- Host Stalls
- This chart shows the number of zero windows that were advertised or received by the
device. Devices control the amount of data they receive by specifying the number of
packets that can be sent to them over a given time period. When a device is sent more
data than it can process, the device advertises a zero window to ask its peer device to
stop sending packets completely until the device catches up. If you see a large number
of zero windows, a server or client might not be not fast enough to support the amount
of data being received.
Metric Definition Zero Windows In The number of zero windows that were sent to the device to stop the flow of data over the connection. A device advertises a Zero Window when incoming data is arriving too quickly to be processed. A large number of zero windows in indicates that a peer device was too slow to process the amount of data received.
Zero Windows Out The number of zero windows that were sent from the device to stop the flow of data. A device advertises a Zero Window when incoming data is arriving too quickly to be processed. A large number of zero windows out indicates that the client was too slow to process the amount of data received.
- Network Stalls
-
This chart shows the number of retransmission timeouts that occurred. Retransmission timeouts (RTOs) occur when a network drops too many packets, usually due to packet collisions or buffer exhaustion. If a device sends a request or response and does not receive confirmation within a specified amount of time, the device retransmits the request. If too many retransmissions are unacknowledged, an RTO occurs. If you see a large number of RTOs, the network might be too slow to support the current level of activity.
Metric Definition RTOs In The number of retransmission timeouts (RTOs) caused by network congestion as peers were sending data to the current device. An RTO is a 1-5 second stall in the TCP connection flow due to excessive retransmissions. If you see a large number of RTOs in, the device did not send an acknowledgment to the server quickly enough, or the network might be too slow to support the current level of activity. Depending on the timeout value configured in the operating system, this delay can be anywhere from 1 to 8 seconds.
RTOs Out The number of retransmission timeouts (RTOs) caused by network congestion as the device was sending data to its peers. An RTO is a 1-5 second stall in the TCP connection flow due to excessive retransmissions. If you see a large number of RTOs out, the device did not receive an acknowledgment from the server quickly enough, or the network might be too slow to support the current level of activity. Depending on the timeout value configured in the operating system, this delay can be anywhere from 1 to 8 seconds.
AMF Metric Totals
The following charts are available in this region:
- Total Requests and Responses
- Requests and responses represent the conversation taking place between clients and
servers. If there are more requests than responses, the client might be sending more
requests than the servers can handle or the network might be too slow. To identify
whether the issue is with the network or the server, check RTOs and zero windows in the
Network Data
section.
Note: It is unlikely that the total number of AMF requests and responses will be exactly equal, even in a healthy environment. For example, you might be viewing a time period that captures a response to a request that was sent before the start of the time period. In general, the greater the difference between responses and errors, the greater the chance that there is an issue with those transactions. Metric Description Requests The number of requests that the device sent when acting as an HTTP-AMF client. Responses The number of responses that the device received when acting as an HTTP-AMF client. Responses Without Length The number of responses that had no length, that the device received when acting as an HTTP-AMF client. Errors The number of response errors that the device received when acting as an HTTP-AMF client. Requests Without Length The number of requests that had no length, that the device sent when acting as an HTTP-AMF client. - Request and Response Size
- This chart shows the average size of requests and responses.
Metric Description Request Size The distribution of sizes (in bytes) of requests that the device sent when acting as an HTTP-AMF client. Response Size The distribution of sizes (in bytes) of responses that the device received when acting as an HTTP-AMF client.
AMF server page
This page displays metric charts of AMF traffic associated with a device on your network.
- Learn about charts on this page:
- Learn about working with metrics.
AMF Summary
The following charts are available in this region:
- Transactions
- This chart shows you when AMF errors occurred and how many AMF responses the server
sent. This information can help you see how active the server was at the time it
returned the errors.
In a healthy environment, the number of requests and responses should be roughly equal. For more information, see Requests and Responses.
Metric Description Responses The number of responses that the device received when acting as an HTTP-AMF client. Errors The number of response errors that the device received when acting as an HTTP-AMF client. - Total Transactions
-
This chart displays the total number of AMF responses the server sent and how many of those responses contained errors.
Metric Description Responses The number of responses that the device sent when acting as an HTTP-AMF server. Errors The number of response errors that the device sent when acting as an HTTP-AMF server. - Performance Summary (95th Percentile)
-
This chart shows the 95th percentile of timing metrics, measured in
milliseconds. The transfer and processing time metrics show parts of a complete
transaction. The request transfer time shows how long clients took to transmit requests
onto the network; the server processing time shows how long the server took to process
requests; and the response transfer time shows how long the server took to transmit
responses onto the network.
Transfer and processing times are calculated by measuring the time between when the first and last packets of requests and responses are seen by the ExtraHop system, as shown in the following figure:
It can be difficult to tell whether an issue is caused by a network or a device from looking only at transfer and processing times, because these metrics alone provide an incomplete picture. Therefore the round trip time (RTT) metric is also included in this chart. RTT metrics are a good indicator of how your network is performing. If you see high transfer or processing times, but the RTT is low, the issue is probably at the device-level. However, if the RTT, processing, and transfer times are all high, network latency might be affecting the transfer and processing times, and the issue might be with the network.
The RTT metric can help identify the source of the problem because it only measures how long an immediate acknowledgment takes to be sent from the client or server; it does not wait until all packets are delivered.
The ExtraHop system calculates the RTT value by measuring the time between the first packet of a request and the acknowledgment from the server, as shown in the following figure:
The request transfer time might be high because the client took a long time to transmit the request (possibly because the request was very large); however, the transfer time could also be high because the request took a long time to travel on the network (possibly because of network congestion).
Learn more about how the ExtraHop system calculates round trip time on the ExtraHop blog.
Request Transfer Time When the device is acting as an HTTP-AMF server, the time between the ExtraHop system detecting the first packet and last packet of received requests.A high number might indicate a large request or network delay. Server Processing Time When the device is acting as an HTTP-AMF server, the time between the ExtraHop system detecting the last packet of the received request and first packet of the sent response. Response Transfer Time When the device is acting as an HTTP-AMF server, the time between the ExtraHop system detecting the first packet and last packet of sent responses. A high number might indicate a large response or network delay. Round Trip Time The time between when an AMF server sent a packet that required an immediate acknowledgment and when the server received the acknowledgment. Round trip time (RTT) is a measurement of network latency. The Performance (95th percentile) chart shows the highest value for a time period while filtering outliers; the 95th percentile is the highest value that falls below 95% of the values for a sample period. By displaying the 95th value, rather than the true maximum, the chart gives you a more accurate view of the data:
- Performance (95th Percentile)
-
This chart shows the 95th percentile of timing
metrics, measured in milliseconds. If a server is acting slow, performance summary
metrics can help you figure out whether the network or the server is causing the
issue. The performance summary metrics show the 95th percentile amount of time the
server took to process requests from clients versus the 95th percentile time that
packets from those requests (and their respective responses) took to be transmitted
across the network. High server processing times indicate that the server is slow.
High RTTs indicate that the server is communicating over slow networks.
Metric Description Server Processing Time When the device is acting as an HTTP-AMF client, the time between the ExtraHop system detecting the last packet of the sent request and the first packet of the received response. Round Trip Time The time between when an AMF server sent a packet that required an immediate acknowledgment and when the server received the acknowledgment. Round trip time (RTT) is a measurement of network latency.
AMF Performance
The following charts are available in this region:
- Server Processing Time Distribution
-
This chart breaks out server processing times in a histogram to
show the most common processing times, measured in milliseconds.
Metric Description Server Processing Time When the device is acting as an HTTP-AMF server, the time between the ExtraHop system detecting the last packet of the received request and first packet of the sent response. - Server Processing Time
-
This chart shows the median processing time for the server,
measured in milliseconds.
Metric Description Server Processing Time When the device is acting as an HTTP-AMF server, the time between the ExtraHop system detecting the last packet of the received request and first packet of the sent response. - Round Trip Time Distribution
-
This chart breaks out round trip times in a histogram to show the
most common round trip times, measured in milliseconds.
Metric Description Round Trip Time The time between when an AMF server sent a packet that required an immediate acknowledgment and when the server received the acknowledgment. Round trip time (RTT) is a measurement of network latency. - Round Trip Time
-
This chart shows the median round trip time for the server, measured in
milliseconds.
Metric Description Round Trip Time The time between when an AMF server sent a packet that required an immediate acknowledgment and when the server received the acknowledgment. Round trip time (RTT) is a measurement of network latency.
Network Data
This region shows you TCP information that is related to the current protocol. In general, host stalls indicate that there is an issue with either the server or the client, and network stalls indicate that there is an issue with the network.
- Host Stalls
- This chart shows the number of zero windows that were advertised or received by the
device. Devices control the amount of data they receive by specifying the number of
packets that can be sent to them over a given time period. When a device is sent more
data than it can process, the device advertises a zero window to ask its peer device to
stop sending packets completely until the device catches up. If you see a large number
of zero windows, a server or client might not be not fast enough to support the amount
of data being received.
Metric Definition Zero Windows In The number of zero windows that were sent to the device to stop the flow of data over the connection. A device advertises a Zero Window when incoming data is arriving too quickly to be processed. A large number of zero windows in indicates that a peer device was too slow to process the amount of data received.
Zero Windows Out The number of zero windows that were sent from the device to stop the flow of data. A device advertises a Zero Window when incoming data is arriving too quickly to be processed. A large number of zero windows out indicates that the client was too slow to process the amount of data received.
- Network Stalls
-
This chart shows the number of retransmission timeouts that occurred. Retransmission timeouts (RTOs) occur when a network drops too many packets, usually due to packet collisions or buffer exhaustion. If a device sends a request or response and does not receive confirmation within a specified amount of time, the device retransmits the request. If too many retransmissions are unacknowledged, an RTO occurs. If you see a large number of RTOs, the network might be too slow to support the current level of activity.
Metric Definition RTOs In The number of retransmission timeouts (RTOs) caused by network congestion as peers were sending data to the current device. An RTO is a 1-5 second stall in the TCP connection flow due to excessive retransmissions. If you see a large number of RTOs in, the device did not send an acknowledgment to the server quickly enough, or the network might be too slow to support the current level of activity. Depending on the timeout value configured in the operating system, this delay can be anywhere from 1 to 8 seconds.
RTOs Out The number of retransmission timeouts (RTOs) caused by network congestion as the device was sending data to its peers. An RTO is a 1-5 second stall in the TCP connection flow due to excessive retransmissions. If you see a large number of RTOs out, the device did not receive an acknowledgment from the server quickly enough, or the network might be too slow to support the current level of activity. Depending on the timeout value configured in the operating system, this delay can be anywhere from 1 to 8 seconds.
AMF Metric Totals
The following charts are available in this region:
- Total Requests and Responses
-
Requests and responses represent the conversation taking place between clients and servers. If there are more requests than responses, clients might be sending more requests than the server can handle or the network might be too slow. To identify whether the issue is with the network or the server, check RTOs and zero windows in the Network Data section.
Note: It is unlikely that the total number of AMF requests and responses will be exactly equal, even in a healthy environment. For example, you might be viewing a time period that captures a response to a request that was sent before the start of the time period. In general, the greater the difference between responses and errors, the greater the chance that there is an issue with those transactions. Metric Description Requests The number of requests that the device received when acting as an HTTP-AMF server. Responses The number of responses that the device sent when acting as an HTTP-AMF server. Responses Without Length The number of responses that had no length, that the device sent when acting as an HTTP-AMF server. Errors The number of response errors that the device sent when acting as an HTTP-AMF server. Requests Without Length The number of requests that had no length, that the device received when acting as an HTTP-AMF server. - Request and Response Size
- This chart shows the average size of requests and responses.
Metric Description Request Size The distribution of sizes (in bytes) of requests that the device received when acting as an HTTP-AMF server. Response Size The distribution of sizes (in bytes) of responses that the device sent when acting as an HTTP-AMF server.
AMF client group page
This page displays metric charts of AMF traffic associated with a device group on your network.
- Learn about charts on this page:
- Learn about working with metrics.
AMF Summary for Group
The following charts are available in this region:
- Transactions
- This chart shows you when AMF errors occurred and how many responses the AMF clients
received. This information can help you see how active the clients were at the time they
received the errors.
In a healthy environment, the number of requests and responses should be roughly equal. For more information, see the Metrics for Group section below.
Metric Description Responses The number of responses that the device received when acting as an HTTP-AMF client. Errors The number of response errors that the device received when acting as an HTTP-AMF client. - Total Transactions
- This chart shows you how many AMF responses the clients received and how many of those
responses contained errors.
Metric Description Responses The number of responses that the device received when acting as an HTTP-AMF client. Errors The number of response errors that the device received when acting as an HTTP-AMF client.
AMF Details for Group
The following charts are available in this region:
- Top Group Members (AMF Clients)
- This chart shows which AMF clients in the group were most active by breaking out the total number of AMF requests the group sent by client.
AMF Metrics for Group
The following charts are available in this region:
- Total Requests and Responses
-
Requests
and responses represent the conversation taking place between clients and servers. If there
are more requests than responses, the clients might be sending more requests than servers
can handle or the network might be too slow.
Note: It is unlikely that the total number of requests and responses will be exactly equal, even in a healthy environment. For example, you might be viewing a time period that captures a response to a request that was sent before the start of the time period. In general, the greater the difference between responses and errors, the greater the chance that there is an issue with those transactions. Metric Description Requests The number of requests that the device sent when acting as an HTTP-AMF client. Responses The number of responses that the device received when acting as an HTTP-AMF client. Responses Without Length The number of responses that had no length, that the device received when acting as an HTTP-AMF client. Errors The number of response errors that the device received when acting as an HTTP-AMF client. Requests Without Length The number of requests that had no length, that the device sent when acting as an HTTP-AMF client. - Server Processing Time
-
If a client group is acting slow, the server processing time
can help you figure out whether the issue is with the servers. The Server Processing Time
chart shows the median amount of time servers took to process requests from the clients,
measured in milliseconds. High server processing times indicate that the clients are
contacting slow servers.
Server Processing Time When the device is acting as an HTTP-AMF client, the time between the ExtraHop system detecting the last packet of the sent request and the first packet of the received response.
AMF server group page
This page displays metric charts of AMF traffic associated with a device group on your network.
- Learn about charts on this page:
- Learn about working with metrics.
AMF Summary for Group
The following charts are available in this region:
- Transactions
- This chart shows you when AMF errors occurred and how many AMF responses the servers
sent. This information can help you see how active the servers were at the time they
returned the errors.
In a healthy environment, the number of requests and responses should be roughly equal. For more information, see the Metrics for Group section below.
Metric Description Responses The number of responses that the device received when acting as an HTTP-AMF client. Errors The number of response errors that the device received when acting as an HTTP-AMF client. - Total Transactions
- This chart shows you how many AMF responses servers in the group sent and how many of those
responses contained errors.
Metric Description Responses The number of responses that the device received when acting as an HTTP-AMF client. Errors The number of response errors that the device received when acting as an HTTP-AMF client.
AMF Details for Group
The following charts are available in this region:
- Top Group Members (AMF Servers)
- This chart shows which AMF servers in the group were most active by breaking out the total number of AMF responses the group sent by server.
AMF Metrics for Group
The following charts are available in this region:
- Total Requests and Responses
-
Requests
and responses represent the conversation taking place between clients and servers. If there
are more requests than responses, clients might be sending more requests than the servers
can handle or the network might be too slow.
Note: It is unlikely that the total number of requests and responses will be exactly equal, even in a healthy environment. For example, you might be viewing a time period that captures a response to a request that was sent before the start of the time period. In general, the greater the difference between responses and errors, the greater the chance that there is an issue with those transactions. Metric Description Requests The number of requests that the device received when acting as an HTTP-AMF server. Responses The number of responses that the device sent when acting as an HTTP-AMF server. Responses Without Length The number of responses that had no length, that the device sent when acting as an HTTP-AMF server. Errors The number of response errors that the device sent when acting as an HTTP-AMF server. Requests Without Length The number of requests that had no length, that the device received when acting as an HTTP-AMF server. - Server Processing Time
-
The Server Processing Time chart shows the median amount of
time the servers took to process requests from clients, measured in milliseconds. High
server processing times indicate that the servers in a group are slow.
Metric Description Server Processing Time When the device is acting as an HTTP-AMF client, the time between the ExtraHop system detecting the last packet of the sent request and the first packet of the received response.
Database
The ExtraHop system collects metrics about database activity. Relational databases store, retrieve, and manage structured information through a database management system (DBMS) language. Activity for the following database languages is aggregated and displayed under Database metrics in the ExtraHop system:
- IBM DB2
- IBM Informix
- Microsoft SQL Server
- MySQL
- Oracle
- PostgreSQL
- Sybase ASE
- Sybase IQ
| Note: | The ExtraHop system also monitors MongoDB database activity, which is displayed through a separate set of metrics specific to MongoDB. |
Learn more by taking the Database Quick Peek training.
The following sections describe the top metrics that you should investigate for problems related to databases.
Errors
Database errors occur when a database request cannot be completed by the server. Errors can indicate a minor issue, such as a single log-in failure, or a more severe issue, such as an overloaded database server.When investigating database errors, you can start by reviewing the total number of errors in your environment on the page. You can view details about each error, including the raw error message reported by the database, by clicking the Errors icon.
On the page, you can break out metrics by database server by hovering over the Response Errors value and clicking By Server IP. You can then sort by the number of errors. If one database server is returning a large number of errors, you can click the server name, and then click the Errors icon to view the total number of errors for that server. However, if no server is contributing a large number of errors, the issue might be more complex, and you should investigate which methods were called on each database.
Methods
You can view which methods were called on databases in your environment. Poorly-formed database calls can cause performance issues, even if no errors exist. To see all methods that were called in your environment over a specified time interval, go to the page and click Methods.If a method is called on a table, the table name is displayed after an @ symbol. For example, CREATE @ Configuration displays metrics about how many times the CREATE method was called on a table named Configuration. Methods can be sorted by processing time, which is the amount of time between when a server receives a request and when the server sends a response. Long processing times can indicate that the database is poorly optimized or that statements are poorly formatted.
Custom metrics and records (requires a recordstore)
If the processing time for a database method is continuously long, you might want to investigate further by collecting the raw SQL statements that contain the method. You can record and view raw SQL statements by creating a custom metric or by generating records through a trigger. A custom metric enables you to view a graphical representation of the information; for example, you could create a chart of how many slow database requests occurred over time and break out each response by the SQL statement. Records enable you to view individual records of each event; for example, you could view exactly how much time it took the server to respond to each SQL statement.The following trigger runs when a database response event occurs. If a database server takes more than 100 milliseconds to respond to a SELECT request on the Configuration table, the trigger records the SQL statement of the request in a custom metric. The trigger also records the total number of database requests that took the server more than 100 milliseconds to respond to.
// Event: DB_RESPONSE
if (DB.processingTime > 100 && DB.method == "SELECT" && DB.table == "Configuration") {

  // Record a custom metric.
  Device.metricAddCount('slow_performers', 1);
  Device.metricAddDetailCount('slow_performers_by_statement', DB.statement, 1);
}The next trigger generates similar information, but in the form of a record for all database responses. The records contain the processing time, method, table name, and SQL statement for each response. After the records are collected, you can view the SQL statements for all SELECT requests on the Configuration table that took the server more than 100 milliseconds to respond to.
// Event: DB_RESPONSE
DB.commitRecord()
After you create a trigger, you must assign the trigger to the devices you want to monitor. If you create a custom metric, you must create a dashboard to view the custom metric.
- For more information about triggers, see Triggers.
- For more information about dashboards, see Dashboards.
- For more information about records, see Records.
Security considerations
- Database authentication can be vulnerable to brute force, which is a method for guessing credentials by submitting numerous authentication requests with different username and password combinations.
- Web applications that are vulnerable to SQL injection (SQLi) can send a database malicious SQL code that is injected into a legitimate data entry field (such as a password field).
- Database queries can enable enumeration, which is a reconnaissance technique that helps an attacker collect information.
- Database takeover attacks target database management systems (DBMS), which interact with file and operating systems on a server. An attacker submits malicious commands (for example, xp_cmdshell queries for Microsoft SQL Servers) in queries to the DBMS.
Database application page
This page displays metric charts of database traffic associated with an application container on your network.
- Learn about charts on this page:
- Learn about database security considerations
- Learn about working with metrics.
Database Summary
The following charts are available in this region:
- Transactions
- This chart shows you when database errors and responses were associated with the
application. This information can help you see how active the application was at the
time the errors occurred.
In a healthy environment, the number of requests and responses should be roughly equal. For more information, see Requests and Responses.
Metric Description Responses The number of database responses associated with the application. Errors The number of database request operations that failed on all database instances. All database errors should be investigated. - Total Transactions
- This chart displays the total number of database responses that were associated with
the application and how many of those responses contained errors.
Metric Description Responses The number of database responses associated with the application. Errors The number of database request operations that failed on all database instances. All database errors should be investigated. - Performance (95th Percentile)
-
This chart shows the 95th percentile of timing metrics,
measured in milliseconds. The transfer and processing time metrics show parts of a
complete transaction. The request transfer time shows how long clients took to transmit
requests onto the network; the server processing time shows how long the servers took to
process requests; and the response transfer time shows how long the servers took to
transmit responses onto the network.
Transfer and processing times are calculated by measuring the time between when the first and last packets of requests and responses are seen by the ExtraHop system, as shown in the following figure:
It can be difficult to tell whether an issue is caused by a network or a device from looking only at transfer and processing times, because these metrics alone provide an incomplete picture. Therefore the round trip time (RTT) metric is also included in this chart. RTT metrics are a good indicator of how your network is performing. If you see high transfer or processing times, but the RTT is low, the issue is probably at the device-level. However, if the RTT, processing, and transfer times are all high, network latency might be affecting the transfer and processing times, and the issue might be with the network.
The RTT metric can help identify the source of the problem because it only measures how long an immediate acknowledgment takes to be sent from the client or server; it does not wait until all packets are delivered.
The ExtraHop system calculates the RTT value by measuring the time between the first packet of a request and the acknowledgment from the server, as shown in the following figure:
The request transfer time might be high because the client took a long time to transmit the request (possibly because the request was very large); however, the transfer time could also be high because the request took a long time to travel on the network (possibly because of network congestion).
Learn more about how the ExtraHop system calculates round trip time on the ExtraHop blog.
Metric Description Server Processing Time The time it took for database instance to send the first packet of response after receiving the last packet of a database request operation. Round Trip Time The time it took for the server or client to send a packet and receive an acknowledgment (ACK). Round trip time might be calculated over the course of a TCP connection. A long round trip time (RTT) indicates network latency. The Performance (95th percentile) chart shows the highest value for a time period while filtering outliers; the 95th percentile is the highest value that falls below 95% of the values for a sample period. By displaying the 95th value, rather than the true maximum, the chart gives you a more accurate view of the data:
- Performance (95th)
-
This chart shows the 95th percentile of timing
metrics, measured in milliseconds. If an application is acting slow, performance
summary metrics can help you figure out whether the network or servers are causing the
issue. These metrics show the 95th percentile of time that servers took to process
requests from clients versus the 95th percentile time that packets from those requests
(and their respective responses) took to be transmitted across the network. High
server processing times indicate that clients are contacting slow servers. High TCP
round trip times indicate that clients are communicating over slow networks.
Metric Description Server Processing Time The time it took for database instance to send the first packet of response after receiving the last packet of a database request operation. Round Trip Time The time it took for the server or client to send a packet and receive an acknowledgment (ACK). Round trip time might be calculated over the course of a TCP connection. A long round trip time (RTT) indicates network latency.
Database Details
The following charts are available in this region:
- Top Methods
- This chart shows which database methods were associated with the application by breaking out the total number of database requests by method.
- Top Methods (Detailed)
- This chart shows which database methods were associated with the application by breaking out the total number of database requests by method.
- Top Users
- This chart shows which users were most active in the application by breaking out the total number of database requests sent by the application.
Database Performance
The following charts are available in this region:
- Server Processing Time Distribution
-
This chart breaks out server processing times in a histogram to
show the most common processing times, measured in milliseconds.
Metric Description Server Processing Time The time it took for database instance to send the first packet of response after receiving the last packet of a database request operation. - Server Processing Time
-
This chart shows the median processing time for the
application, measured in milliseconds.
Metric Description Server Processing Time The time it took for database instance to send the first packet of response after receiving the last packet of a database request operation. - Round Trip Time Distribution
-
This chart breaks out round trip times in a histogram to show the
most common round trip times, measured in milliseconds.
Metric Description Round Trip Time The time it took for the server or client to send a packet and receive an acknowledgment (ACK). Round trip time might be calculated over the course of a TCP connection. A long round trip time (RTT) indicates network latency. - Round Trip Time
-
This chart shows the median round trip time for the application,
measured in milliseconds.
Metric Description Round Trip Time The time it took for the server or client to send a packet and receive an acknowledgment (ACK). Round trip time might be calculated over the course of a TCP connection. A long round trip time (RTT) indicates network latency.
Network Data
This region shows you TCP information that is related to the current protocol. In general, host stalls indicate that there is an issue with either a server or a client, and network stalls indicate that there is an issue with the network.
- Host Stalls
-
This chart shows the number of zero windows that were
associated with an application. Devices control the amount of data they receive by
specifying the number of packets that can be sent to them over a given time period.
When a device is sent more data than it can process, the device advertises a zero
window to ask its peer device to stop sending packets completely until the device
catches up. If you see a large number of zero windows, a server or client might not be
not fast enough to support the amount of data being received.
Metric Definition Request Zero Windows The number of zero window advertisements sent by database clients. A device advertises a Zero Window when incoming data is arriving too quickly to be processed. A large number of incoming Zero Windows indicates that a peer device was too slow to process the amount of data received.
Response Zero Windows The number of zero window advertisements sent by servers while receiving database requests. A device advertises a Zero Window when incoming data is arriving too quickly to be processed. A large number of outgoing Zero Windows indicates that a client was too slow to process the amount of data received.
- Total Host Stalls
- This chart shows the median number of zero window advertisements sent by devices.
- Network Stalls
-
This chart shows the number of retransmission
timeouts that occurred. Retransmission timeouts (RTOs) occur when a network drops too
many packets, usually due to packet collisions or buffer exhaustion. If a device sends
a request or response and does not receive confirmation within a specified amount of
time, the device retransmits the request. If too many retransmissions are
unacknowledged, an RTO occurs. If you see a large number of RTOs, the network might be
too slow to support the current level of activity.
Metric Definition RTOs In The number of retransmission timeouts caused by congestion when clients were sending database requests. An RTO is a 1-5 second stall in the TCP connection flow due to excessive retransmissions. If you see a large number of incoming RTOs, a device did not send an acknowledgment to the server quickly enough, or the network might be too slow to support the current level of activity. Depending on the timeout value configured in the operating system, this delay can be anywhere from 1 to 8 seconds.
RTOs Out The number of retransmission timeouts caused by congestion when servers were sending database responses. An RTO is a 1-5 second stall in the TCP connection flow due to excessive retransmissions. If you see a large number of outgoing RTOs, a device did not receive an acknowledgment from the server quickly enough, or the network might be too slow to support the current level of activity. Depending on the timeout value configured in the operating system, this delay can be anywhere from 1 to 8 seconds.
- Total Network Stalls
- This chart shows the median number of retransmission timeouts caused by congestion when clients and servers were sending requests.
Database Metric Totals
The following charts are available in this region:
- Total Requests and Responses
-
Requests and responses represent the conversation taking place between clients and servers. If there are more requests than responses, clients might be sending more requests than servers can handle or the network might be too slow. To identify whether the issue is with the network or a server, check RTOs and zero windows in the Network Data section.
Note: It is unlikely that the total number of database requests and responses will be exactly equal, even in a healthy environment. For example, you might be viewing a time period that captures a response to a request that was sent before the start of the time period. In general, the greater the difference between responses and errors, the greater the chance that there is an issue with those transactions. Metric Description Requests The number of database requests associated with this application. Responses The number of database responses associated with the application. Errors The number of database request operations that failed on all database instances. All database errors should be investigated. - Database Network Metrics
-
Metric Description Request Zero Windows The number of zero window advertisements sent by database clients. A device advertises a Zero Window when incoming data is arriving too quickly to be processed. Response Zero Windows The number of zero window advertisements sent by servers while receiving database requests. A device advertises a Zero Window when incoming data is arriving too quickly to be processed. Request RTOs The number of retransmission timeouts caused by congestion when clients were sending database requests. An RTO is a 1-5 second stall in the TCP connection flow due to excessive retransmissions. Response RTOs The number of retransmission timeouts caused by congestion when servers were sending database responses. An RTO is a 1-5 second stall in the TCP connection flow due to excessive retransmissions. Request L2 Bytes The number of L2 bytes associated with database requests. Response L2 Bytes The number of L2 bytes associated with database responses. Request Goodput Bytes The number of goodput bytes associated with database requests. Goodput refers to the throughput of the original data transferred and excludes other throughput such as protocol headers or retransmitted packets. Response Goodput Bytes The number of goodput bytes associated with database responses. Goodput refers to the throughput of the original data transferred and excludes other throughput such as protocol headers or retransmitted packets. Request Packets The number of packets associated with database requests. Response Packets The number of packets associated with database responses.
Database client page
This page displays metric charts of database client traffic associated with a device on your network.
- Learn about charts on this page:
- Learn about database security considerations
- Learn about working with metrics.
Database Summary
The following charts are available in this region:
- Transactions
- This chart shows you when database errors occurred and how many responses the database
client received. This information can help you see how active the client was at the time
it received the errors.
If you see a large number of errors, you can view details about each error, including the raw error message reported by the database. However, if the number of errors is low, the issue might be more complex, and you should examine the ratio of requests to responses. In a healthy environment, the number of requests and responses should be roughly equal. For more information, see Requests and Responses.
Tip: To see more information about errors, click the Errors link at the top of the page. Metric Description Responses The number of responses received by this database client. Responses vary by the requested operation. Errors The number of error messages that were received by database clients. - Total Transactions
- This chart displays the total number of database responses the client received and how
many of those responses contained errors.
Metric Description Responses The number of responses received by this database client. Responses vary by the requested operation. Errors The number of error messages that were received by database clients. - Performance (95th Percentile)
-
This chart shows the 95th percentile of timing metrics, measured in
milliseconds. The transfer and processing time metrics show parts of a complete
transaction. The request transfer time shows how long the client took to transmit requests
onto the network; the server processing time shows how long servers took to process the
requests; and the response transfer time shows how long servers took to transmit responses
onto the network.
Transfer and processing times are calculated by measuring the time between when the first and last packets of requests and responses are seen by the ExtraHop system, as shown in the following figure:
It can be difficult to tell whether an issue is caused by a network or a device from looking only at transfer and processing times, because these metrics alone provide an incomplete picture. Therefore the round trip time (RTT) metric is also included in this chart. RTT metrics are a good indicator of how your network is performing. If you see high transfer or processing times, but the RTT is low, the issue is probably at the device-level. However, if the RTT, processing, and transfer times are all high, network latency might be affecting the transfer and processing times, and the issue might be with the network.
The RTT metric can help identify the source of the problem because it only measures how long an immediate acknowledgment takes to be sent from the client or server; it does not wait until all packets are delivered.
The ExtraHop system calculates the RTT value by measuring the time between the first packet of a request and the acknowledgment from the server, as shown in the following figure:
The request transfer time might be high because the client took a long time to transmit the request (possibly because the request was very large); however, the transfer time could also be high because the request took a long time to travel on the network (possibly because of network congestion).
Learn more about how the ExtraHop system calculates round trip time on the ExtraHop blog.
Metric Description Request Transfer Time When the device is acting as a database client, the time between the ExtraHop system detecting the first packet and last packet of sent requests. A high number might indicate a large request or network delay. Server Processing Time The time it took for this database client to receive the first packet of a response after sending the last packet of the query. Response Transfer Time When the device is acting as a database client, the time between the ExtraHop system detecting the first packet and last packet of received responses. A high number might indicate a large response or network delay. Round Trip Time The time between when a database client sent a packet that required an immediate acknowledgment and when the client received the acknowledgment. Round trip time (RTT) is a measurement of network latency. The Performance (95th percentile) chart shows the highest value for a time period while filtering outliers; the 95th percentile is the highest value that falls below 95% of the values for a sample period. By displaying the 95th value, rather than the true maximum, the chart gives you a more accurate view of the data:
- Performance (95th)
-
This chart shows the 95th percentile of timing
metrics, measured in milliseconds. If a client is acting slow, performance summary
metrics can help you figure out whether the network or servers are causing the issue.
These metrics show the 95th percentile amount of time that servers took to process
requests from the client versus the 95th percentile time that packets from those
requests (and their respective responses) took to be transmitted across the network.
High server processing times indicate that the client is contacting slow servers. High
TCP round trip times indicate that the client is communicating over slow
networks.
Metric Description Database Client Server Processing Time The time it took for this database client to receive the first packet of a response after sending the last packet of the query. Round Trip Time The time between when a database client sent a packet that required an immediate acknowledgment and when the client received the acknowledgment. Round trip time (RTT) is a measurement of network latency.
Database Details
The following charts are available in this region:
- Top Methods
- This chart shows which methods the client called the most by breaking out the total number of database requests the client sent by method.
- Top Status Codes
- This chart shows which status codes the client received the most by breaking out the number of responses returned to the client by status code.
- Top Users
- This chart shows which users were most active on the client by breaking out the total number of database requests sent by the client by user.
Database Performance
The following charts are available in this region:
- Server Processing Time Distribution
-
This chart breaks out server processing times in a histogram to
show the most common processing times, measured in milliseconds.
Metric Description Server Processing Time The time it took for this database client to receive the first packet of a response after sending the last packet of the query. - Server Processing Time
-
This chart shows the median processing time for the client,
measured in milliseconds.
Metric Description Server Processing Time The time it took for this database client to receive the first packet of a response after sending the last packet of the query. - Round Trip Time Distribution
-
This chart breaks out round trip times in a histogram to show the
most common round trip times, measured in milliseconds.
Metric Description Round Trip Time The time between when a database client sent a packet that required an immediate acknowledgment and when the client received the acknowledgment. Round trip time (RTT) is a measurement of network latency. - Round Trip Time
-
This chart shows the median round trip time for the client, measured in
milliseconds.
Metric Description Round Trip Time The time between when a database client sent a packet that required an immediate acknowledgment and when the client received the acknowledgment. Round trip time (RTT) is a measurement of network latency.
Network Data
This region shows you TCP information that is related to the current protocol. In general, host stalls indicate that there is an issue with either the server or the client, and network stalls indicate that there is an issue with the network.
- Host Stalls
- This chart shows the number of zero windows that were advertised or received by the
device. Devices control the amount of data they receive by specifying the number of
packets that can be sent to them over a given time period. When a device is sent more
data than it can process, the device advertises a zero window to ask its peer device to
stop sending packets completely until the device catches up. If you see a large number
of zero windows, a server or client might not be not fast enough to support the amount
of data being received.
Metric Definition Zero Windows In The number of zero windows that were sent to the device to stop the flow of data over the connection. A device advertises a Zero Window when incoming data is arriving too quickly to be processed. A large number of zero windows in indicates that a peer device was too slow to process the amount of data received.
Zero Windows Out The number of zero windows that were sent from the device to stop the flow of data. A device advertises a Zero Window when incoming data is arriving too quickly to be processed. A large number of zero windows out indicates that the client was too slow to process the amount of data received.
- Network Stalls
-
This chart shows the number of retransmission timeouts that occurred. Retransmission timeouts (RTOs) occur when a network drops too many packets, usually due to packet collisions or buffer exhaustion. If a device sends a request or response and does not receive confirmation within a specified amount of time, the device retransmits the request. If too many retransmissions are unacknowledged, an RTO occurs. If you see a large number of RTOs, the network might be too slow to support the current level of activity.
Metric Definition RTOs In The number of retransmission timeouts (RTOs) caused by network congestion as peers were sending data to the current device. An RTO is a 1-5 second stall in the TCP connection flow due to excessive retransmissions. If you see a large number of RTOs in, the device did not send an acknowledgment to the server quickly enough, or the network might be too slow to support the current level of activity. Depending on the timeout value configured in the operating system, this delay can be anywhere from 1 to 8 seconds.
RTOs Out The number of retransmission timeouts (RTOs) caused by network congestion as the device was sending data to its peers. An RTO is a 1-5 second stall in the TCP connection flow due to excessive retransmissions. If you see a large number of RTOs out, the device did not receive an acknowledgment from the server quickly enough, or the network might be too slow to support the current level of activity. Depending on the timeout value configured in the operating system, this delay can be anywhere from 1 to 8 seconds.
Database Metric Totals
The following charts are available in this region:
- Total Requests and Responses
- Requests and responses represent the conversation taking place between clients and
servers. If there are more requests than responses, the client might be sending more
requests than the servers can handle or the network might be too slow. To identify
whether the issue is with the network or the server, check RTOs and zero windows in the
Network Data
section.
Note: It is unlikely that the total number of database requests and responses will be exactly equal, even in a healthy environment. For example, you might be viewing a time period that captures a response to a request that was sent before the start of the time period. In general, the greater the difference between responses and errors, the greater the chance that there is an issue with those transactions. Metric Description Requests The number of requests sent by this database client. Requests cover a range of operations: connection negotiations, session configuration, data definition language (DDL), data modification language (DML), or data reads (select). Responses The number of responses received by this database client. Responses vary by the requested operation. Errors The number of error messages that were received by database clients. Aborted Requests The number of requests that this database client began to send before the connection abruptly closed. This client was unable to send the complete request because the connection timed out or the connection was closed with a TCP reset (RST) or FIN. Aborted Responses The number of responses that this database client began to receive before the connection abruptly closed. This client was unable to receive the complete response because the connection timed out or the connection was closed with a TCP reset (RST) or FIN. - Request and Response Size
- This chart shows the average size of requests and responses.
Metric Description Request Size The distribution of sizes (in bytes) of requests that the device sent when acting as a database client. Response Size The distribution of sizes (in bytes) of responses that the device received when acting as a database client.
Database server page
This page displays metric charts of database server traffic associated with a device on your network.
- Learn about charts on this page:
- Learn about database security considerations
- Learn about working with metrics.
Database Summary
The following charts are available in this region:
- Transactions
- This chart shows you when database errors occurred and how many database responses the
server sent. This information can help you see how active the server was at the time it
returned the errors.
If you see a large number of errors, you can view details about each error, including the raw error message reported by the database. However, if the number of errors is low, the issue might be more complex, and you should examine the ratio of requests to responses. In a healthy environment, the number of requests and responses should be roughly equal. For more information, see Requests and Responses.
Tip: To see more information about errors, click the Errors link at the top of the page. Responses The number of responses by all database instances on this server. Responses vary by the requested operation. For example, a response can include connection and session configurations, success or failure notifications, or a tabular data set. Errors The number of error messages that were sent by database servers. - Total Transactions
- This chart displays the total number of database responses the server sent and how
many of those responses contained errors.
Responses The number of responses by all database instances on this server. Responses vary by the requested operation. For example, a response can include connection and session configurations, success or failure notifications, or a tabular data set. Errors The number of error messages that were sent by database servers. - Performance (95th Percentile)
-
This chart shows the 95th percentile of timing metrics, measured in
milliseconds. The transfer and processing time metrics show parts of a complete
transaction. The request transfer time shows how long clients took to transmit requests
onto the network; the server processing time shows how long the server took to process
requests; and the response transfer time shows how long the server took to transmit
responses onto the network.
Transfer and processing times are calculated by measuring the time between when the first and last packets of requests and responses are seen by the ExtraHop system, as shown in the following figure:
It can be difficult to tell whether an issue is caused by a network or a device from looking only at transfer and processing times, because these metrics alone provide an incomplete picture. Therefore the round trip time (RTT) metric is also included in this chart. RTT metrics are a good indicator of how your network is performing. If you see high transfer or processing times, but the RTT is low, the issue is probably at the device-level. However, if the RTT, processing, and transfer times are all high, network latency might be affecting the transfer and processing times, and the issue might be with the network.
The RTT metric can help identify the source of the problem because it only measures how long an immediate acknowledgment takes to be sent from the client or server; it does not wait until all packets are delivered.
The ExtraHop system calculates the RTT value by measuring the time between the first packet of a request and the acknowledgment from the server, as shown in the following figure:
The request transfer time might be high because the client took a long time to transmit the request (possibly because the request was very large); however, the transfer time could also be high because the request took a long time to travel on the network (possibly because of network congestion).
Learn more about how the ExtraHop system calculates round trip time on the ExtraHop blog.
Request Transfer Time When the device is acting as a database server, the time between the ExtraHop system detecting the first packet and last packet of received requests. A high number might indicate a large request or network delay. Server Processing Time The time it took for this database server to send the first packet of a response after receiving the last packet of the query. Response Transfer Time When the device is acting as a database server, the time between the ExtraHop system detecting the first packet and last packet of sent responses. A high number might indicate a large response or network delay. Round Trip Time The time between when a database server sent a packet that required an immediate acknowledgment and when the server received the acknowledgment. Round trip time (RTT) is a measurement of network latency. The Performance (95th percentile) chart shows the highest value for a time period while filtering outliers; the 95th percentile is the highest value that falls below 95% of the values for a sample period. By displaying the 95th value, rather than the true maximum, the chart gives you a more accurate view of the data:
- Performance (95th)
-
This chart shows the 95th percentile of timing
metrics, measured in milliseconds. If a server is acting slow, performance summary
metrics can help you figure out whether the network or the server is causing the
issue. The performance summary metrics show the 95th percentile amount of time the
server took to process requests from clients versus the 95th percentile time that
packets from those requests (and their respective responses) took to be transmitted
across the network. High server processing times indicate that the server is slow.
High RTTs indicate that the server is communicating over slow networks.
Server Processing Time The time it took for this database server to send the first packet of a response after receiving the last packet of the query. Round Trip Time The time between when a database server sent a packet that required an immediate acknowledgment and when the server received the acknowledgment. Round trip time (RTT) is a measurement of network latency.
Database Details
The following charts are available in this region:
- Top Methods
- This chart shows which database methods were called on the server the most by breaking out the total number of requests the server received by method.
- Top Status Codes
- This chart shows which database status codes the server returned the most by breaking out the total number of responses the server sent by status code.
- Top Users
- This chart shows which users were most active on the server by breaking out the total number of database requests sent to the server by user.
Database Performance
The following charts are available in this region:
- Server Processing Time Distribution
-
This chart breaks out server processing times in a histogram to
show the most common processing times, measured in milliseconds.
Server Processing Time The time it took for this database server to send the first packet of a response after receiving the last packet of the query. - Server Processing Time
-
This chart shows the median processing time for the server,
measured in milliseconds.
Server Processing Time The time it took for this database server to send the first packet of a response after receiving the last packet of the query. - Round Trip Time Distribution
-
This chart breaks out round trip times in a histogram to show the
most common round trip times, measured in milliseconds.
Round Trip Time The time between when a database server sent a packet that required an immediate acknowledgment and when the server received the acknowledgment. Round trip time (RTT) is a measurement of network latency. - Round Trip Time
-
This chart shows the median round trip time for the server, measured in
milliseconds.
Round Trip Time The time between when a database server sent a packet that required an immediate acknowledgment and when the server received the acknowledgment. Round trip time (RTT) is a measurement of network latency.
Network Data
This region shows you TCP information that is related to the current protocol. In general, host stalls indicate that there is an issue with either the server or the client, and network stalls indicate that there is an issue with the network.
- Host Stalls
- This chart shows the number of zero windows that were advertised or received by the
device. Devices control the amount of data they receive by specifying the number of
packets that can be sent to them over a given time period. When a device is sent more
data than it can process, the device advertises a zero window to ask its peer device to
stop sending packets completely until the device catches up. If you see a large number
of zero windows, a server or client might not be not fast enough to support the amount
of data being received.
Metric Definition Zero Windows In The number of zero windows that were sent to the device to stop the flow of data over the connection. A device advertises a Zero Window when incoming data is arriving too quickly to be processed. A large number of zero windows in indicates that a peer device was too slow to process the amount of data received.
Zero Windows Out The number of zero windows that were sent from the device to stop the flow of data. A device advertises a Zero Window when incoming data is arriving too quickly to be processed. A large number of zero windows out indicates that the client was too slow to process the amount of data received.
- Network Stalls
-
This chart shows the number of retransmission timeouts that occurred. Retransmission timeouts (RTOs) occur when a network drops too many packets, usually due to packet collisions or buffer exhaustion. If a device sends a request or response and does not receive confirmation within a specified amount of time, the device retransmits the request. If too many retransmissions are unacknowledged, an RTO occurs. If you see a large number of RTOs, the network might be too slow to support the current level of activity.
Metric Definition RTOs In The number of retransmission timeouts (RTOs) caused by network congestion as peers were sending data to the current device. An RTO is a 1-5 second stall in the TCP connection flow due to excessive retransmissions. If you see a large number of RTOs in, the device did not send an acknowledgment to the server quickly enough, or the network might be too slow to support the current level of activity. Depending on the timeout value configured in the operating system, this delay can be anywhere from 1 to 8 seconds.
RTOs Out The number of retransmission timeouts (RTOs) caused by network congestion as the device was sending data to its peers. An RTO is a 1-5 second stall in the TCP connection flow due to excessive retransmissions. If you see a large number of RTOs out, the device did not receive an acknowledgment from the server quickly enough, or the network might be too slow to support the current level of activity. Depending on the timeout value configured in the operating system, this delay can be anywhere from 1 to 8 seconds.
Database Metric Totals
The following charts are available in this region:
- Requests and Responses
- Requests and responses represent the conversation taking place between clients and
servers. If there are more requests than responses, clients might be sending more
requests than the server can handle or the network might be too slow. To identify
whether the issue is with the network or the server, check RTOs and zero windows in the
Network Data
section.
Note: It is unlikely that the total number of database requests and responses will be exactly equal, even in a healthy environment. For example, you might be viewing a time period that captures a response to a request that was sent before the start of the time period. In general, the greater the difference between responses and errors, the greater the chance that there is an issue with those transactions. Requests The number of requests received by all database instances on this server. Requests cover a range of operations: connection negotiations, session configuration, data definition language (DDL), data modification language (DML), or data reads (select). Responses The number of responses by all database instances on this server. Responses vary by the requested operation. For example, a response can include connection and session configurations, success or failure notifications, or a tabular data set. Errors The number of error messages that were sent by database servers. Aborted Requests The number of requests this database server began to receive before the connection abruptly closed. This server was unable to receive the complete request because the connection timed out or the connection was closed with a TCP reset (RST) or FIN. Aborted Responses The number of responses this database server began to send before the connection abruptly closed. This server was unable to send the complete response because the connection timed out or the connection was closed with a TCP reset (RST) or FIN. - Request and Response Size
- This chart shows the average size of requests and responses.
Request Size The distribution of sizes (in bytes) of requests that the device received when acting as a database server. Response Size The distribution of sizes (in bytes) of responses that the device sent when acting as a database server.
Database client group page
This page displays metric charts of database client traffic associated with a device group on your network.
- Learn about charts on this page:
- Learn about database security considerations
- Learn about working with metrics.
Database Summary for Group
The following charts are available in this region:
- Transactions
- This chart shows you when database errors occurred and how many database responses the
servers sent. This information can help you see how active the servers were at the time
they returned the errors.
If you see a large number of errors, you can drill down to find the specific status codes returned in the requests and learn why servers were unable to fulfill the requests. However, if the number of errors is low, the issue might be more complex, and you should examine the ratio of database requests to database responses. In a healthy environment, the number of requests and responses should be roughly equal. For more information, see the Metrics for Group section below.
Tip: To see more information about errors, click the Errors link at the top of the page. Metric Description Responses The number of responses received by this database client. Responses vary by the requested operation. Errors The number of error messages that were received by database clients. - Total Transactions
- This chart shows you how many database responses the clients received and how many of
those responses contained errors.
Metric Description Responses The number of responses received by this database client. Responses vary by the requested operation. Errors The number of error messages that were received by database clients.
Database Details for Group
The following charts are available in this region:
- Top Group Members (Database Clients)
- This chart shows which database clients in the group were most active by breaking out the total number of database requests the group sent by client.
- Top Methods
- This chart shows which database methods the group called the most by breaking out the total number of requests the group sent by method.
- Top Status Codes
- This chart shows which database status codes the group received the most by breaking out the number of responses returned to the group by status code.
Database Metrics for Group
The following charts are available in this region:
- Total Requests and Responses
-
Requests
and responses represent the conversation taking place between clients and servers. If there
are more requests than responses, the clients might be sending more requests than servers
can handle or the network might be too slow.
Note: It is unlikely that the total number of requests and responses will be exactly equal, even in a healthy environment. For example, you might be viewing a time period that captures a response to a request that was sent before the start of the time period. In general, the greater the difference between responses and errors, the greater the chance that there is an issue with those transactions. Metric Description Requests The number of requests sent by this database client. Requests cover a range of operations: connection negotiations, session configuration, data definition language (DDL), data modification language (DML), or data reads (select). Responses The number of responses received by this database client. Responses vary by the requested operation. Errors The number of error messages that were received by database clients. Aborted Requests The number of requests that this database client began to send before the connection abruptly closed. This client was unable to send the complete request because the connection timed out or the connection was closed with a TCP reset (RST) or FIN. Aborted Responses The number of responses that this database client began to receive before the connection abruptly closed. This client was unable to receive the complete response because the connection timed out or the connection was closed with a TCP reset (RST) or FIN. - Server Processing Time
-
If a client group is acting slow, the server processing time
can help you figure out whether the issue is with the servers. The Server Processing Time
chart shows the median amount of time servers took to process requests from the clients,
measured in milliseconds. High server processing times indicate that the clients are
contacting slow servers.
Metric Description Server Processing Time The time it took for this database client to receive the first packet of a response after sending the last packet of the query.
Database server group page
This page displays metric charts of database server traffic associated with a device group on your network.
- Learn about charts on this page:
- Learn about database security considerations
- Learn about working with metrics.
Database Summary for Group
The following charts are available in this region:
- Total Transactions
- This chart shows you when database errors occurred and how many database responses the
servers sent. This information can help you see how active the servers were at the time
they returned the errors.
If you see a large number of errors, you can drill down to find the specific status code returned in the request and learn why the servers were unable to fulfill the requests. However, if the number of errors is low, the issue might be more complex, and you should examine the ratio of database requests to database responses. In a healthy environment, the number of requests and responses should be roughly equal. For more information, see the Metrics for Group section below.
Tip: To see more information about errors, click the Errors link at the top of the page. Responses The number of responses by all database instances on this server. Responses vary by the requested operation. For example, a response can include connection and session configurations, success or failure notifications, or a tabular data set. Errors The number of error messages that were sent by database servers. - Total Transactions
- This chart shows you how many database responses servers in the group sent and how many of those
responses contained errors.
Responses The number of responses by all database instances on this server. Responses vary by the requested operation. For example, a response can include connection and session configurations, success or failure notifications, or a tabular data set. Errors The number of error messages that were sent by database servers.
Database Details for Group
The following charts are available in this region:
- Top Group Members (Database Servers)
- This chart shows which database servers in the group were most active by breaking out the total number of database responses the group sent by server.
- Top Methods
- This chart shows which database methods were called on servers in the group the most by breaking out the total number of requests the group received by method.
- Top Status Code
- This chart shows which database status codes the groups returned the most by breaking out the total number of responses the group sent by status code.
Database Metrics for Group
The following charts are available in this region:
- Total Requests and Responses
-
Requests
and responses represent the conversation taking place between clients and servers. If there
are more requests than responses, clients might be sending more requests than the servers
can handle or the network might be too slow.
Note: It is unlikely that the total number of requests and responses will be exactly equal, even in a healthy environment. For example, you might be viewing a time period that captures a response to a request that was sent before the start of the time period. In general, the greater the difference between responses and errors, the greater the chance that there is an issue with those transactions. Requests The number of requests received by all database instances on this server. Requests cover a range of operations: connection negotiations, session configuration, data definition language (DDL), data modification language (DML), or data reads (select). Responses The number of responses by all database instances on this server. Responses vary by the requested operation. For example, a response can include connection and session configurations, success or failure notifications, or a tabular data set. Errors The number of error messages that were sent by database servers. Aborted Requests The number of requests this database server began to receive before the connection abruptly closed. This server was unable to receive the complete request because the connection timed out or the connection was closed with a TCP reset (RST) or FIN. Aborted Responses The number of responses this database server began to send before the connection abruptly closed. This server was unable to send the complete response because the connection timed out or the connection was closed with a TCP reset (RST) or FIN. - Server Processing Time
-
The Server Processing Time chart shows the median amount of
time the servers took to process requests from clients, measured in milliseconds. High
server processing times indicate that the servers in a group are slow.
Server Processing Time The time it took for this database server to send the first packet of a response after receiving the last packet of the query.
DHCP
The ExtraHop system collects metrics about Dynamic Host Configuration Protocol (DHCP) activity. DHCP is a protocol for dynamically distributing network configuration parameters.
DHCP application page
This page displays metric charts of DHCP traffic associated an application container on your network.
- Learn about charts on this page:
- Learn about working with metrics.
DHCP Summary
The following charts are available in this region:
- Transactions
- This chart shows you when DHCP errors and responses were associated with the
application. This information can help you see how active the application was at the
time the errors occurred.
In a healthy environment, the number of requests and responses should be roughly equal. For more information, see Requests and Responses.
Metric Description Responses The number of DHCP responses. Errors The number of DHCP response errors. - Total Transactions
- This chart displays the total number of DHCP responses that were associated with the
application and how many of those responses contained errors.
Metric Description Responses The number of DHCP responses. Errors The number of DHCP response errors. - Server Processing Time
- This chart shows DHCP server processing times broken out by percentile. Server
processing time shows how long servers took to process requests from clients, measured
in milliseconds. Server processing time is calculated by measuring the time between when
the last packet of a request and the first packet of a response is seen by the ExtraHop
system.
Metric Description Server Processing Time When the device is acting as a DHCP client, the time between the ExtraHop system detecting the last packet of the sent request and the first packet of the received response. - Server Processing Time Summary
- Shows the 95th percentile for server processing time, measured in milliseconds.
Metric Description Server Processing Time When the device is acting as a DHCP client, the time between the ExtraHop system detecting the last packet of the sent request and the first packet of the received response. The Server Processing Time Summary chart focuses on the 95th percentile to show the highest value for a time period while filtering outliers; the 95th percentile is the highest value that falls below 95% of the values for a sample period. The following chart shows how displaying the 95th value, rather than the true maximum, can give a more accurate view of the data:
DHCP Details
The following charts are available in this region:
- Top Request Message Types
- This chart shows which DHCP message types the application sent the most by breaking out the total number of requests the application sent by message type.
- Top Response Message Types
- This chart shows which DHCP message types the application received the most by breaking out the total number of responses the application received by message type.
DHCP Performance
The following charts are available in this region:
- Server Processing Time Distribution
-
This chart breaks out server processing times in a histogram to
show the most common processing times, measured in milliseconds.
Metric Description Server Processing Time The time between the ExtraHop system detecting the last packet of DHCP requests and the first packet of their corresponding responses. - Server Processing Time
-
This chart shows the median processing time for the
application, measured in milliseconds.
Metric Description Server Processing Time The time between the ExtraHop system detecting the last packet of DHCP requests and the first packet of their corresponding responses.
DHCP Metric Totals
The following charts are available in this region:
- Total Requests and Responses
-
Requests and responses represent the conversation taking place between clients and servers. If there are more requests than responses, clients might be sending more requests than servers can handle or the network might be too slow.
Note: It is unlikely that the total number of database requests and responses will be exactly equal, even in a healthy environment. For example, you might be viewing a time period that captures a response to a request that was sent before the start of the time period. In general, the greater the difference between responses and errors, the greater the chance that there is an issue with those transactions. Metric Description Requests The number of DHCP requests. Responses The number of DHCP responses. Errors The number of DHCP response errors. - DHCP Network Metrics
-
Metric Description Request L2 Bytes The number of L2 bytes associated with DHCP requests. Response L2 Bytes The number of L2 bytes associated with DHCP responses. Request Packets The number of packets associated with DHCP requests. Response Packets The number of packets associated with DHCP responses.
DHCP client page
This page displays metric charts of DHCP client traffic associated with a device on your network.
- Learn about charts on this page:
- Learn about working with metrics.
DHCP Summary
The following charts are available in this region:
- Transactions
- This chart shows you when DHCP errors occurred and how many responses the DHCP client
received. This information can help you see how active the client was at the time it
received the errors.
In a healthy environment, the number of requests and responses should be roughly equal. For more information, see Requests and Responses.
Metric Description Responses The number of responses that the device received when acting as a DHCP client. Errors When the device is acting as a DHCP client, the number of responses received with an error option. - Total Transactions
- This chart displays the total number of DHCP responses the client received and how
many of those responses contained errors.
Metric Description Responses The number of responses that the device received when acting as a DHCP client. Errors When the device is acting as a DHCP client, the number of responses received with an error option. - Server Processing Time
- This chart shows DHCP server processing times broken out by percentile. Server
processing time shows how long servers took to process requests from the client,
measured in milliseconds. Server processing time is calculated by measuring the time
between when the last packet of a request and the first packet of a response is seen by
the ExtraHop system.
Metric Description Server Processing Time When the device is acting as a DHCP client, the time between the ExtraHop system detecting the last packet of the sent request and the first packet of the received response. - Server Processing Time
- Shows the 95th percentile for server processing time, measured in milliseconds.
Metric Description Server Processing Time When the device is acting as a DHCP client, the time between the ExtraHop system detecting the last packet of the sent request and the first packet of the received response. The Server Processing Time Summary chart focuses on the 95th percentile to show the highest value for a time period while filtering outliers; the 95th percentile is the highest value that falls below 95% of the values for a sample period. The following chart shows how displaying the 95th value, rather than the true maximum, can give a more accurate view of the data:
DHCP Details
The following charts are available in this region:
- Top Request Message Types
- This chart shows which DHCP message types the client sent the most by breaking out the total number of requests the client sent by message type.
- Top Response Message Types
- This chart shows which DHCP message types the client received the most by breaking out the total number of responses the client received by message type.
DHCP Performance
The following charts are available in this region:
- Server Processing Time Distribution
-
This chart breaks out server processing times in a histogram to
show the most common processing times, measured in milliseconds.
Metric Description Server Processing Time When the device is acting as a DHCP client, the time between the ExtraHop system detecting the last packet of the sent request and the first packet of the received response. - Server Processing Time
- This chart shows the median server processing time, measured in milliseconds.
Metric Description Server Processing Time When the device is acting as a DHCP client, the time between the ExtraHop system detecting the last packet of the sent request and the first packet of the received response.
DHCP Metric Totals
The following charts are available in this region:
- Total Requests and Responses
- Requests and responses represent the conversation taking place between clients and
servers. If there are more requests than responses, the client might be sending more
requests than the servers can handle or the network might be too slow.
Note: It is unlikely that the total number of DHCP requests and responses will be exactly equal, even in a healthy environment. For example, you might be viewing a time period that captures a response to a request that was sent before the start of the time period. In general, the greater the difference between responses and errors, the greater the chance that there is an issue with those transactions. Metric Description Requests The number of requests sent by this DHCP client. Responses The number of responses that the device received when acting as a DHCP client. Errors When the device is acting as a DHCP client, the number of responses received with an error option.
DHCP server page
This page displays metric charts of DHCP server traffic associated with a device on your network.
- Learn about charts on this page:
- Learn about working with metrics.
DHCP Summary
The following charts are available in this region:
- Transactions
- This chart shows you when DHCP errors occurred and how many DHCP responses the server
sent. This information can help you see how active the server was at the time it
returned the errors.
In a healthy environment, the number of requests and responses should be roughly equal. For more information, see Requests and Responses.
Responses The number of responses that the device sent when acting as a DHCP server. Errors When the device is acting as a DHCP server, the number of responses sent with an error option. - Total Transactions
- This chart displays the total number of DHCP responses the server sent and how many of
those responses contained errors.
Responses The number of responses that the device sent when acting as a DHCP server. Errors When the device is acting as a DHCP server, the number of responses sent with an error option. - Server Processing Time
- This chart shows DHCP server processing times broken out by percentile. Server
processing time shows how long the server took to process requests from clients,
measured in milliseconds. Server processing time is calculated by measuring the time
between when the last packet of a request and the first packet of a response is seen by
the ExtraHop system.
Metric Description Server Processing Time When the device is acting as a DHCP server, the time between the ExtraHop system detecting the last packet of the received request and first packet of the sent response. - Server Processing Time
- Shows the 95th percentile for server processing time, measured in milliseconds.
Metric Description Server Processing Time When the device is acting as a DHCP server, the time between the ExtraHop system detecting the last packet of the received request and first packet of the sent response. The Server Processing Time Summary chart focuses on the 95th percentile to show the highest value for a time period while filtering outliers; the 95th percentile is the highest value that falls below 95% of the values for a sample period. The following chart shows how displaying the 95th value, rather than the true maximum, can give a more accurate view of the data:
DHCP Details
The following charts are available in this region:
- Top Request Message Types
- This chart shows which DHCP message types the server received the most by breaking out the total number of requests the server received by message type.
- Top Response Message Types
- This chart shows which DHCP message types the server sent the most by breaking out the total number of responses the server sent by message type.
DHCP Performance
The following charts are available in this region:
- Server Processing Time Distribution
-
This chart breaks out server processing times in a histogram to
show the most common processing times, measured in milliseconds.
Metric Description Server Processing Time When the device is acting as a DHCP server, the time between the ExtraHop system detecting the last packet of the received request and first packet of the sent response. - Server Processing Time
- This chart shows the median server processing time, measured in milliseconds.
Metric Description Server Processing Time When the device is acting as a DHCP server, the time between the ExtraHop system detecting the last packet of the received request and first packet of the sent response.
DHCP Metric Totals
The following charts are available in this region:
- Total Requests and Responses
-
Requests and responses represent the conversation taking place between clients and servers. If there are more requests than responses, clients might be sending more requests than the server can handle or the network might be too slow.
Note: It is unlikely that the total number of DHCP requests and responses will be exactly equal, even in a healthy environment. For example, you might be viewing a time period that captures a response to a request that was sent before the start of the time period. In general, the greater the difference between responses and errors, the greater the chance that there is an issue with those transactions. Metric Description Requests The number of requests that the device received when acting as a DHCP server. Responses The number of responses that the device sent when acting as a DHCP server. Errors When the device is acting as a DHCP server, the number of responses sent with an error option.
DHCP client group page
This page displays metric charts of DHCP client traffic associated with a device group on your network.
- Learn about charts on this page:
- Learn about working with metrics.
DHCP Summary for Group
The following charts are available in this region:
- Total Transactions
- This chart shows you when DHCP errors occurred and how many responses the DHCP clients
received. This information can help you see how active the clients were at the time they
received the errors.
In a healthy environment, the number of requests and responses should be roughly equal. For more information, see the Metrics for Group section below.
Metric Description Responses The number of responses that the device received when acting as a DHCP client. Errors When the device is acting as a DHCP client, the number of responses received with an error option. - Total Transactions
- This chart shows you how many DHCP responses the clients received and how many of
those responses contained errors.
Metric Description Responses The number of responses that the device received when acting as a DHCP client. Errors When the device is acting as a DHCP client, the number of responses received with an error option.
DHCP Details for Group
The following charts are available in this region:
- Top Group Members (DHCP Clients)
- This chart shows which DHCP clients in the group were most active by breaking out the total number of DHCP requests the group sent by client.
- Top Request Message Types
- This chart shows which DHCP message types the group sent the most by breaking out the total number of requests the group sent by message type.
- Top Response Message Types
- This chart shows which DHCP message types the group received the most by breaking out the total number of responses the group received by message type.
DHCP Metrics for Group
The following charts are available in this region:
- Total Requests and Responses
-
Requests
and responses represent the conversation taking place between clients and servers. If there
are more requests than responses, the clients might be sending more requests than servers
can handle or the network might be too slow.
Note: It is unlikely that the total number of requests and responses will be exactly equal, even in a healthy environment. For example, you might be viewing a time period that captures a response to a request that was sent before the start of the time period. In general, the greater the difference between responses and errors, the greater the chance that there is an issue with those transactions. Metric Description Requests The number of requests sent by this DHCP client. Responses The number of responses that the device received when acting as a DHCP client. Errors When the device is acting as a DHCP client, the number of responses received with an error option. - Server Processing Time
-
If a client group is acting slow, the server processing time
can help you figure out whether the issue is with the servers. The Server Processing Time
chart shows the median amount of time servers took to process requests from the clients,
measured in milliseconds. High server processing times indicate that the clients are
contacting slow servers.
Metric Description Server Processing Time When the device is acting as a DHCP client, the time between the ExtraHop system detecting the last packet of the sent request and the first packet of the received response.
DHCP server group page
This page displays metric charts of DHCP server traffic associated with a device group on your network.
- Learn about charts on this page:
- Learn about working with metrics.
DHCP Summary for Group
The following charts are available in this region:
- Transactions
- This chart shows you when DHCP errors occurred and how many DHCP responses the servers
sent. This information can help you see how active the servers were at the time they
returned the errors.
In a healthy environment, the number of requests and responses should be roughly equal. For more information, see the Metrics for Group section below.
Responses The number of responses that the device sent when acting as a DHCP server. Errors When the device is acting as a DHCP server, the number of responses sent with an error option. - Total Transactions
- This chart shows you how many DHCP responses the clients received and how many of
those responses contained errors.
Responses The number of responses that the device sent when acting as a DHCP server. Errors When the device is acting as a DHCP server, the number of responses sent with an error option.
DHCP Details for Group
The following charts are available in this region:
- Top Group Members (DHCP Servers)
- This chart shows which DHCP servers in the group were most active by breaking out the total number of DHCP responses the group sent by server.
- Top Request Message Types
- This chart shows which DHCP message types the server received the most by breaking out the total number of requests the server received by message type.
- Top Response Message Types
- This chart shows which DHCP message types the server sent the most by breaking out the total number of responses servers in the group sent by message type.
DHCP Metrics for Group
The following charts are available in this region:
- Total Requests and Responses
-
Requests
and responses represent the conversation taking place between clients and servers. If there
are more requests than responses, clients might be sending more requests than the servers
can handle or the network might be too slow.
Note: It is unlikely that the total number of requests and responses will be exactly equal, even in a healthy environment. For example, you might be viewing a time period that captures a response to a request that was sent before the start of the time period. In general, the greater the difference between responses and errors, the greater the chance that there is an issue with those transactions. Metric Description Requests The number of requests that the device received when acting as a DHCP server. Responses The number of responses that the device sent when acting as a DHCP server. Errors When the device is acting as a DHCP server, the number of responses sent with an error option. - Server Processing Time
-
The Server Processing Time chart shows the median amount of
time the servers took to process requests from clients, measured in milliseconds. High
server processing times indicate that the servers in a group are slow.
Metric Description Server Processing Time When the device is acting as a DHCP server, the time between the ExtraHop system detecting the last packet of the received request and first packet of the sent response.
DICOM
The ExtraHop system collects metrics about Digital Imaging and Communications in Medicine (DICOM) activity. DICOM is a standard protocol for storing biomedical images and transmitting those images over a network.
| Note: | The ExtraHop system does not include any built-in metric pages for DICOM. However, you can view DICOM metrics by adding them to a custom page or dashboard. |
DNS
The ExtraHop system collects metrics about Domain Name System (DNS) protocol activity. DNS is the naming system for network hosts and resources that are connected to the Internet. DNS servers map IP addresses to hostnames.
Learn more by taking the DNS Quick Peek training.
Security considerations
- DNS is noisy and difficult to monitor with traditional methods.
- DNS transmissions are usually sent over user datagram protocol (UDP), which is easily spoofed and vulnerable to attacks.
- DNS weaknesses can be exploited to help advanced persistent threat (APT) groups evade detection.
- DNS is prone to DNS tunneling, amplification attacks, denial of service (DoS) attacks, hijacking, cache poisoning, redirection attacks, and more.
- DNS reverse lookup requests can enable enumeration, which is a reconnaissance technique that helps an attacker discover internal hostnames.
DNS application page
This page displays metric charts of DNS traffic associated with an application container on your network.
- Learn about charts on this page:
- Learn about DNS security considerations
- Learn about working with metrics.
DNS Summary
The following charts are available in this region:
- Transactions
- This chart shows you when DNS errors and responses were associated with the
application. This information can help you see how active the application was at the
time the errors occurred.
In a healthy environment, the number of requests and responses should be roughly equal. For more information, see Requests and Responses.
Metric Description Responses The number of DNS responses associated with this application. Errors The number of DNS responses with errors that are associated with this application. - Total Transactions
- This chart displays the total number of DNS responses that were associated with the
application and how many of those responses contained errors.
Metric Description Responses The number of DNS responses associated with this application. Errors The number of DNS responses with errors that are associated with this application. - Requests and Timeouts
- This chart shows you when DNS requests and request timeouts occurred.
Metric Description Requests The number of DNS requests associated with this application. Request Timeouts The number of timeouts that occurred due to a repeated unanswered DNS query sent by clients to DNS servers. DNS timeouts can cause slowdowns and disruptions. - Total Requests and Timeouts
- This chart shows you the total number of DNS requests and request timeouts.
Metric Description Requests The number of DNS requests associated with this application. Request Timeouts The number of timeouts that occurred due to a repeated unanswered DNS query sent by clients to DNS servers. DNS timeouts can cause slowdowns and disruptions. - Server Processing Time
- This chart shows DNS server processing times broken out by percentile. Server
processing time shows how long servers took to process requests from clients, measured
in milliseconds. Server processing time is calculated by measuring the time between when
the last packet of a request and the first packet of a response is seen by the ExtraHop
system.
Metric Description Server Processing Time The time it took for this DNS client to receive the first response packet after sending a query request. A lengthy processing time can indicate latency. The Server Processing Time Summary chart focuses on the 95th percentile to show the highest value for a time period while filtering outliers; the 95th percentile is the highest value that falls below 95% of the values for a sample period. The following chart shows how displaying the 95th value, rather than the true maximum, can give a more accurate view of the data:
- Server Processing Time Summary
- Shows the 95th percentile for server processing time, measured in milliseconds.
Metric Description Server Processing Time The time it took for this DNS client to receive the first response packet after sending a query request. A lengthy processing time can indicate latency.
DNS Details
The following charts are available in this region:
- Top Opcodes
- This chart shows which DNS opcodes the application received the most by breaking out the number of responses returned to the application by opcode.
- Top Host Queries
- This chart shows which host queries the application made the most by breaking out the total number of requests the application sent by host query.
- Top Response Codes
- This chart shows which response codes the application received the most by breaking out the number of responses returned to the application by response code.
DNS Performance
The following charts are available in this region:
- Server Processing Time Distribution
-
This chart breaks out server processing times in a histogram to
show the most common processing times, measured in milliseconds.
Metric Description Server Processing Time The time it took for DNS servers to send the first packet of a response after receiving the last packet of a request. - Server Processing Time
-
This chart shows the median processing time for the
application, measured in milliseconds.
Metric Description Server Processing Time The time it took for DNS servers to send the first packet of a response after receiving the last packet of a request.
DNS Metric Totals
The following charts are available in this region:
- Total Requests and Responses
-
Requests and responses represent the conversation taking place between clients and servers. If there are more requests than responses, clients might be sending more requests than servers can handle or the network might be too slow.
Note: It is unlikely that the total number of database requests and responses will be exactly equal, even in a healthy environment. For example, you might be viewing a time period that captures a response to a request that was sent before the start of the time period. In general, the greater the difference between responses and errors, the greater the chance that there is an issue with those transactions. Metric Description Requests The number of DNS requests associated with this application. Responses The number of DNS responses associated with this application. Errors The number of DNS responses with errors that are associated with this application. Request Timeouts The number of timeouts that occurred due to a repeated unanswered DNS query sent by clients to DNS servers. DNS timeouts can cause slowdowns and disruptions. Truncated Requests The number of DNS requests that were sent but were truncated in transit. A truncated request is indicated by the truncated bit in the message and occurs when the message is larger than the underlying transmission channel allows. Truncated Responses The number of DNS responses that were sent but were truncated in transit. A truncated request is indicated by the truncated bit in the message and occurs when the message is larger than the underlying transmission channel allows. - DNS Network Metrics
-
Metric Description Request L2 Bytes The number of L2 bytes associated with DNS requests. Response L2 Bytes The number of L2 bytes associated with DNS responses. Request Packets The number of packets associated with DNS requests. Response Packets The number of packets associated with DNS responses.
DNS client page
This page displays metric charts of DNS client traffic associated with a device on your network.
- Learn about charts on this page:
- Learn about DNS security considerations
- Learn about working with metrics.
DNS Summary
The following charts are available in this region:
- Transactions
- This chart shows you when DNS errors occurred. The chart also shows you how many DNS
responses the client received so that you can see how active the client was at the time
it received the errors.
In a healthy environment, the number of requests and responses should be roughly equal. For more information, see Requests and Responses.
Responses The number of responses received by this DNS client. Errors The number of times this DNS client received error codes in response to a query. - Total Transactions
- This chart displays the total number of DNS responses the client received and how many
of those responses contained errors.
Metric Description Responses The number of responses received by this DNS client. Errors The number of times this DNS client received error codes in response to a query. - Requests and Timeouts
- This chart shows you when request timeouts occurred. The chart also shows you how many
DNS requests the client sent so that you can see how active the client was at the time
the timeouts occurred.
Requests The number of requests sent by this DNS client. Request Timeouts The number of timeouts that occurred due to a repeated unanswered DNS query request sent from this client to DNS servers. DNS request timeouts can cause slowdowns and disruptions. - Total Requests and Timeouts
- This chart shows you the total number of requests and request timeouts.
Requests The number of requests sent by this DNS client. Request Timeouts The number of timeouts that occurred due to a repeated unanswered DNS query request sent from this client to DNS servers. DNS request timeouts can cause slowdowns and disruptions. - Server Processing Time
- This chart shows DNS server processing times broken out by percentile. Server
processing time shows how long servers took to process requests from the client,
measured in milliseconds. Server processing time is calculated by measuring the time
between when the last packet of a request and the first packet of a response is seen by
the ExtraHop system. This chart does not appear if the device is in Flow Analysis.
Metric Description Server Processing Time The time it took for this DNS client to receive the first response packet after sending a query request. A lengthy processing time can indicate latency. The Server Processing Time chart focuses on the 95th percentile to show the highest value for a time period while filtering outliers; the 95th percentile is the highest value that falls below 95% of the values for a sample period. The following chart shows how displaying the 95th value, rather than the true maximum, can give a more accurate view of the data:
- Server Processing Time Summary
- Shows the 95th percentile for server processing time, measured in milliseconds. This
chart does not appear if the device is in Flow Analysis.
Metric Description Server Processing Time The time it took for this DNS client to receive the first response packet after sending a query request. A lengthy processing time can indicate latency.
DNS Details
The following charts are available in this region:
- Top Record Types
- This chart shows which record types the client requested the most by breaking out the total number of requests the client sent by record type.
- Top Host Queries
- This chart shows which host queries the client made the most by breaking out the total number of requests the client sent by host query.
- Top Response Codes
- This chart shows which response codes the client received the most by breaking out the number of responses returned to the client by response code.
DNS Performance
The following charts are available in this region unless the device is in Flow Analysis:
- Server Processing Time Distribution
-
This chart breaks out server processing times in a histogram to
show the most common processing times, measured in milliseconds.
Metric Description Server Processing Time The time it took for this DNS client to receive the first response packet after sending a query request. A lengthy processing time can indicate latency. - Server Processing Time
- This chart shows the median server processing time, measured in milliseconds.
Metric Description Server Processing Time The time it took for this DNS client to receive the first response packet after sending a query request. A lengthy processing time can indicate latency.
DNS Metric Totals
The following charts are available in this region:
- Total Requests and Responses
- Requests and responses represent the conversation taking place between clients and
servers. If there are more requests than responses, the client might be sending more
requests than the servers can handle or the network might be too slow.
Note: It is unlikely that the total number of DNS requests and responses will be exactly equal, even in a healthy environment. For example, you might be viewing a time period that captures a response to a request that was sent before the start of the time period. In general, the greater the difference between responses and errors, the greater the chance that there is an issue with those transactions. Metric Description Requests The number of requests sent by this DNS client. Responses The number of requests sent by this DNS client. Errors The number of times this DNS client received error codes in response to a query. Request Timeouts The number of timeouts that occurred due to a repeated unanswered DNS query request sent from this client to DNS servers. DNS request timeouts can cause slowdowns and disruptions. Truncated Requests The number of requests that were sent, but were truncated in transit, when the device is acting as a DNS client. A truncated request is indicated by the truncated bit in the message and occurs when the message is larger than the underlying transmission channel allows. Truncated Responses When the device is acting as a DNS client, the number of responses that were received but were truncated in transit. A truncated response is indicated by the truncated bit in the message and occurs when the message is larger than the underlying transmission channel allows.
DNS server page
This page displays metric charts of DNS server traffic associated with a device on your network.
- Learn about charts on this page:
- Learn about DNS security considerations
- Learn about working with metrics.
DNS Summary
The following charts are available in this region:
- Transactions
- This chart shows you when DNS errors occurred. The chart also shows you how many DNS
responses the server sent so that you can see how active the server was at the time it
returned the errors.
In a healthy environment, the number of requests and responses should be roughly equal. For more information, see Requests and Responses.
Metric Description Responses The number of responses sent by this DNS server. Errors The number of times this DNS server sent error codes in response to a query. - Total Transactions
- This chart displays the total number of DNS responses the server sent and how many of
those responses contained errors.
Metric Description Responses The number of responses sent by this DNS server. Errors The number of times this DNS server sent error codes in response to a query. - Requests and Timeouts
- This chart shows you when request timeouts occurred. The chart also shows you how many
DNS requests the server sent so that you can see how active the server was at the time
the timeouts occurred.
Requests The number of requests received by this DNS server. Request Timeouts The number of timeouts associated with this DNS server, which occurred after a repeated unanswered DNS query request was sent from clients. DNS request timeouts can cause slowdowns and disruptions. - Total Requests and Timeouts
- This chart shows you the total number of requests and request timeouts.
Requests The number of requests received by this DNS server. Request Timeouts The number of timeouts associated with this DNS server, which occurred after a repeated unanswered DNS query request was sent from clients. DNS request timeouts can cause slowdowns and disruptions. - Server Processing Times
- This chart shows DNS server processing times broken out by percentile. Server
processing time shows how long the server took to process requests from clients,
measured in milliseconds. Server processing time is calculated by measuring the time
between when the last packet of a request and the first packet of a response is seen by
the ExtraHop system. This chart does not appear if the device is in Flow Analysis.
Metric Description Server Processing Time The time it took for this DNS server to send the first response packet after receiving a query request. A lengthy processing time can indicate latency. - Server Processing Time Summary
- Shows the 95th percentile for server processing time, measured in milliseconds. This
chart does not appear if the device is in Flow Analysis.
Metric Description Server Processing Time The time it took for this DNS server to send the first response packet after receiving a query request. A lengthy processing time can indicate latency.
DNS Details
The following charts are available in this region:
- Top Record Types
- This chart shows which record types were requested on the server the most by breaking out the total number of requests the server received by record type.
- Top Host Queries
- This chart shows which host queries were made on the server the most by breaking out the total number of requests the server received by host query.
- Top Response Codes
- This chart shows which response codes the server sent the most by breaking out the number of responses the server sent by response code.
DNS Performance
The following charts are available in this region unless the device is in Flow Analysis:
- Server Processing Time Distribution
-
This chart breaks out server processing times in a histogram to
show the most common processing times, measured in milliseconds.
Metric Description Server Processing Time The time it took for this DNS server to send the first response packet after receiving a query request. A lengthy processing time can indicate latency. - Server Processing Time
- This chart shows the median server processing time, measured in milliseconds.
Metric Description Server Processing Time The time it took for this DNS server to send the first response packet after receiving a query request. A lengthy processing time can indicate latency.
Metric Totals
The following charts are available in this region:
- Total Requests and Responses
- Requests and responses represent the conversation taking place between clients and
servers. If there are more requests than responses, the server might be receiving more
requests than the server can handle or the network might be too slow.
Note: It is unlikely that the total number of DNS requests and responses will be exactly equal, even in a healthy environment. For example, you might be viewing a time period that captures a response to a request that was sent before the start of the time period. In general, the greater the difference between responses and errors, the greater the chance that there is an issue with those transactions. Metric Description Requests The number of requests received by this DNS server. Responses The number of responses sent by this DNS server. Errors The number of times this DNS server sent error codes in response to a query. Request Timeouts The number of timeouts associated with this DNS server, which occurred after a repeated unanswered DNS query request was sent from clients. DNS request timeouts can cause slowdowns and disruptions. Truncated Requests The number of requests that were received, but were truncated in transit, when the device is acting as a DNS server. A truncated request is indicated by the truncated bit in the message and occurs when the message is larger than the underlying transmission channel allows. Truncated Responses The number of responses sent, but later truncated, when the device is acting as a DNS server. A truncated response is indicated by the truncated bit in the message and occurs when the message is larger than the underlying transmission channel allows.
DNS client group page
This page displays metric charts of DNS client traffic associated with a device group on your network.
- Learn about charts on this page:
- Learn about DNS security considerations
- Learn about working with metrics.
DNS Summary for Group
The following charts are available in this region:
- Transactions
- This chart shows you when DNS errors occurred and how many responses the DNS clients
received. This information can help you see how active the clients were at the time they
received the errors.
In a healthy environment, the number of requests and responses should be roughly equal. For more information, see the Metrics for Group section below.
Metric Description Responses The number of responses received by this DNS client. Errors The number of times this DNS client received error codes in response to a query. - Total Transactions
- This chart shows you how many DNS responses the clients received and how many of those
responses contained errors.
Metric Description Responses The number of responses received by this DNS client. Errors The number of times this DNS client received error codes in response to a query.
DNS Details for Group
The following charts are available in this region:
- Top Group Members (DNS Clients)
- This chart shows which DNS clients in the group were most active by breaking out the total number of DNS requests the group sent by client.
- Top Record Types
- This chart shows which record types the group requested the most by breaking out the total number of requests the group sent by record type.
- Top Response Codes
- This chart shows which response codes the group received the most by breaking out the number of responses returned to the group by response code.
DNS Metrics for Group
The following charts are available in this region unless all the devices in the group are in Flow Analysis:
- Total Requests and Responses
-
Requests
and responses represent the conversation taking place between clients and servers. If there
are more requests than responses, the clients might be sending more requests than servers
can handle or the network might be too slow.
Note: It is unlikely that the total number of requests and responses will be exactly equal, even in a healthy environment. For example, you might be viewing a time period that captures a response to a request that was sent before the start of the time period. In general, the greater the difference between responses and errors, the greater the chance that there is an issue with those transactions. Metric Description Requests The number of requests sent by this DNS client. Responses The number of responses received by this DNS client. Errors The number of times this DNS client received error codes in response to a query. - Server Processing Time
-
If a client group is acting slow, the server processing time
can help you figure out whether the issue is with the servers. The Server Processing Time
chart shows the median amount of time servers took to process requests from the clients,
measured in milliseconds. High server processing times indicate that the clients are
contacting slow servers.
Metric Description Server Processing Time The time it took for this DNS client to receive the first response packet after sending a query request. A lengthy processing time can indicate latency.
DNS server group page
This page displays metric charts of DNS server traffic associated with a device group on your network.
- Learn about charts on this page:
- Learn about DNS security considerations
- Learn about working with metrics.
DNS Summary for Group
The following charts are available in this region:
- Total Transactions
- This chart shows you when DNS errors occurred and how many DNS responses the servers
sent. This information can help you see how active the servers were at the time they
returned the errors.
In a healthy environment, the number of requests and responses should be roughly equal. For more information, see the Metrics for Group section below.
Metric Description Responses The number of responses sent by this DNS server. Errors The number of times this DNS server sent error codes in response to a query. - Total Transactions
- This chart shows you how many DNS responses servers in the group sent and how many of those
responses contained errors.
Metric Description Responses The number of responses sent by this DNS server. Errors The number of times this DNS server sent error codes in response to a query.
DNS Details for Group
The following charts are available in this region:
- Top Group Members (DNS Servers)
- This chart shows which DNS servers in the group were most active by breaking out the total number of DNS responses the group sent by server.
- Top Record Types
- This chart shows which record types were requested on servers in the group the most by breaking out the total number of requests the group received by record type.
- Top Response Codes
- This chart shows which response codes the group sent the most by breaking out the number of responses the group sent by response code.
DNS Metrics for Group
The following charts are available in this region unless all devices in the group are in Flow Analysis:
- Total Requests and Responses
-
Requests
and responses represent the conversation taking place between clients and servers. If there
are more requests than responses, clients might be sending more requests than the servers
can handle or the network might be too slow.
Note: It is unlikely that the total number of requests and responses will be exactly equal, even in a healthy environment. For example, you might be viewing a time period that captures a response to a request that was sent before the start of the time period. In general, the greater the difference between responses and errors, the greater the chance that there is an issue with those transactions. Metric Description Requests The number of requests received by this DNS server. Responses The number of responses sent by this DNS server. Errors The number of times this DNS server sent error codes in response to a query. Request Timeouts The number of timeouts associated with this DNS server, which occurred after a repeated unanswered DNS query request was sent from clients. DNS request timeouts can cause slowdowns and disruptions. Truncated Requests The number of requests that were received, but were truncated in transit, when the device is acting as a DNS server. A truncated request is indicated by the truncated bit in the message and occurs when the message is larger than the underlying transmission channel allows. Truncated Responses The number of responses sent, but later truncated, when the device is acting as a DNS server. A truncated response is indicated by the truncated bit in the message and occurs when the message is larger than the underlying transmission channel allows. - Server Processing Time
-
The Server Processing Time chart shows the median amount of
time the servers took to process requests from clients, measured in milliseconds. High
server processing times indicate that the servers in a group are slow.
Metric Description Server Processing Time The time it took for this DNS server to send the first response packet after receiving a query request. A lengthy processing time can indicate latency.
DTLS
The ExtraHop system collects metrics about Datagram Transport Layer Security (DTLS) protocol activity. DTLS is a communication protocol that secures datagram-based applications and services.
| Note: | The ExtraHop system does not include any built-in metric pages for DTLS. However, you can view DTLS metrics by adding them to a custom page or dashboard. |
FIX
The ExtraHop system collects metrics about Financial Information Exchange (FIX) protocol activity. FIX provides information about the real-time exchange of financial transactions.
FIX application page
This page displays metric charts of FIX traffic associated with application containers on your network.
- Learn about charts on this page:
- Learn about working with metrics.
FIX Summary
The following charts are available in this region:
- Transactions
- This chart shows you when FIX errors and responses were associated with the
application. This information can help you see how active the application was at the
time the errors occurred.
In a healthy environment, the number of requests and responses should be roughly equal. For more information, see Requests and Responses.
Metric Description Responses The number of FIX responses. Errors The number of FIX response errors. - Total Transactions
- This chart displays the total number of FIX responses that were associated with the
application and how many of those responses contained errors.
Metric Description Responses The number of FIX responses. Errors The number of FIX response errors. - Performance (95th Percentile)
-
This chart shows the 95th percentile of timing metrics,
measured in milliseconds. The transfer and processing time metrics show parts of a
complete transaction. The request transfer time shows how long clients took to transmit
requests onto the network; the server processing time shows how long the servers took to
process requests; and the response transfer time shows how long the servers took to
transmit responses onto the network.
Transfer and processing times are calculated by measuring the time between when the first and last packets of requests and responses are seen by the ExtraHop system, as shown in the following figure:
It can be difficult to tell whether an issue is caused by a network or a device from looking only at transfer and processing times, because these metrics alone provide an incomplete picture. Therefore the round trip time (RTT) metric is also included in this chart. RTT metrics are a good indicator of how your network is performing. If you see high transfer or processing times, but the RTT is low, the issue is probably at the device-level. However, if the RTT, processing, and transfer times are all high, network latency might be affecting the transfer and processing times, and the issue might be with the network.
The RTT metric can help identify the source of the problem because it only measures how long an immediate acknowledgment takes to be sent from the client or server; it does not wait until all packets are delivered.
The ExtraHop system calculates the RTT value by measuring the time between the first packet of a request and the acknowledgment from the server, as shown in the following figure:
The request transfer time might be high because the client took a long time to transmit the request (possibly because the request was very large); however, the transfer time could also be high because the request took a long time to travel on the network (possibly because of network congestion).
Learn more about how the ExtraHop system calculates round trip time on the ExtraHop blog.
Metric Description Request Transfer Time The time between the ExtraHop system detecting the first packet and last packet of FIX requests. A high number might indicate a large request or network delay. Server Processing Time The time between the ExtraHop system detecting the last packet of FIX requests and the first packet of their corresponding responses. Response Transfer Time The time between the ExtraHop system detecting the first packet and last packet of FIX responses. A high number might indicate a large response or network delay. Round Trip Time The time between when a FIX client or server sent a packet requiring immediate acknowledgment and when the acknowledgment was received. The Performance (95th percentile) chart shows the highest value for a time period while filtering outliers; the 95th percentile is the highest value that falls below 95% of the values for a sample period. By displaying the 95th value, rather than the true maximum, the chart gives you a more accurate view of the data:
- Performance (95th)
-
This chart shows the 95th percentile of timing
metrics, measured in milliseconds. If an application is acting slow, performance
summary metrics can help you figure out whether the network or servers are causing the
issue. These metrics show the 95th percentile of time that servers took to process
requests from clients versus the 95th percentile time that packets from those requests
(and their respective responses) took to be transmitted across the network. High
server processing times indicate that clients are contacting slow servers. High TCP
round trip times indicate that clients are communicating over slow networks.
Metric Description Server Processing Time The time between the ExtraHop system detecting the last packet of FIX requests and the first packet of their corresponding responses. Round Trip Time The time between when a FIX client or server sent a packet requiring immediate acknowledgment and when the acknowledgment was received.
FIX Details
The following charts are available in this region:
- Top Methods
- This chart shows which FIX methods were associated with the application by breaking out the total number of FIX requests by method.
- Top Senders
- This chart shows the top FIX senders for the application by breaking out the total number of FIX requests by sender.
- Top Targets
- This chart shows the top FIX targets for the application by breaking out the total number of FIX requests by target.
FIX Performance
The following charts are available in this region:
- Server Processing Time Distribution
-
This chart breaks out server processing times in a histogram to
show the most common processing times, measured in milliseconds.
Metric Description Server Processing Time The time between the ExtraHop system detecting the last packet of FIX requests and the first packet of their corresponding responses. - Server Processing Time
-
This chart shows the median processing time for the
application, measured in milliseconds.
Metric Description Server Processing Time The time between the ExtraHop system detecting the last packet of FIX requests and the first packet of their corresponding responses. - Round Trip Time Distribution
-
This chart breaks out round trip times in a histogram to show the
most common round trip times, measured in milliseconds.
Metric Description Round Trip Time The time between when a FIX client or server sent a packet requiring immediate acknowledgment and when the acknowledgment was received. - Round Trip Time
-
This chart shows the median round trip time for the application,
measured in milliseconds.
Metric Description Round Trip Time The time between when a FIX client or server sent a packet requiring immediate acknowledgment and when the acknowledgment was received.
Network Data
This region shows you TCP information that is related to the current protocol. In general, host stalls indicate that there is an issue with either a server or a client, and network stalls indicate that there is an issue with the network.
- Host Stalls
-
This chart shows the number of zero windows that were
associated with an application. Devices control the amount of data they receive by
specifying the number of packets that can be sent to them over a given time period.
When a device is sent more data than it can process, the device advertises a zero
window to ask its peer device to stop sending packets completely until the device
catches up. If you see a large number of zero windows, a server or client might not be
not fast enough to support the amount of data being received.
Metric Definition Request Zero Windows The number of zero window advertisements sent by FIX clients. A device advertises a Zero Window when incoming data is arriving too quickly to be processed. A large number of incoming Zero Windows indicates that a peer device was too slow to process the amount of data received.
Response Zero Windows The number of zero window advertisements sent by servers while receiving FIX requests. A device advertises a Zero Window when incoming data is arriving too quickly to be processed. A large number of outgoing Zero Windows indicates that a client was too slow to process the amount of data received.
- Total Host Stalls
- This chart shows the median number of zero window advertisements sent by devices.
- Network Stalls
-
This chart shows the number of retransmission
timeouts that occurred. Retransmission timeouts (RTOs) occur when a network drops too
many packets, usually due to packet collisions or buffer exhaustion. If a device sends
a request or response and does not receive confirmation within a specified amount of
time, the device retransmits the request. If too many retransmissions are
unacknowledged, an RTO occurs. If you see a large number of RTOs, the network might be
too slow to support the current level of activity.
Metric Definition RTOs In The number of retransmission timeouts caused by congestion when clients were sending FIX requests. An RTO is a 1-5 second stall in the TCP connection flow due to excessive retransmissions. If you see a large number of incoming RTOs, a device did not send an acknowledgment to the server quickly enough, or the network might be too slow to support the current level of activity. Depending on the timeout value configured in the operating system, this delay can be anywhere from 1 to 8 seconds.
RTOs Out The number of retransmission timeouts caused by congestion when servers were sending FIX responses. An RTO is a 1-5 second stall in the TCP connection flow due to excessive retransmissions. If you see a large number of outgoing RTOs, a device did not receive an acknowledgment from the server quickly enough, or the network might be too slow to support the current level of activity. Depending on the timeout value configured in the operating system, this delay can be anywhere from 1 to 8 seconds.
- Total Network Stalls
-
This chart shows the median number of
retransmission timeouts caused by congestion when clients and servers were sending
requests.
Metric Definition RTOs In The number of retransmission timeouts caused by congestion when clients were sending FIX requests. An RTO is a 1-5 second stall in the TCP connection flow due to excessive retransmissions. If you see a large number of incoming RTOs, a device did not send an acknowledgment to the server quickly enough, or the network might be too slow to support the current level of activity. Depending on the timeout value configured in the operating system, this delay can be anywhere from 1 to 8 seconds.
RTOs Out The number of retransmission timeouts caused by congestion when servers were sending FIX responses. An RTO is a 1-5 second stall in the TCP connection flow due to excessive retransmissions. If you see a large number of outgoing RTOs, a device did not receive an acknowledgment from the server quickly enough, or the network might be too slow to support the current level of activity. Depending on the timeout value configured in the operating system, this delay can be anywhere from 1 to 8 seconds.
FIX Metric Totals
The following charts are available in this region:
- Total Requests and Responses
-
Requests and responses represent the conversation taking place between clients and servers. If there are more requests than responses, clients might be sending more requests than servers can handle or the network might be too slow. To identify whether the issue is with the network or a server, check RTOs and zero windows in the Network Data section.
Note: It is unlikely that the total number of FIX requests and responses will be exactly equal, even in a healthy environment. For example, you might be viewing a time period that captures a response to a request that was sent before the start of the time period. In general, the greater the difference between responses and errors, the greater the chance that there is an issue with those transactions. Metric Description Requests The number of FIX requests. Responses The number of FIX responses. Errors The number of FIX response errors. - FIX Network Metrics
-
Metric Description Request Zero Windows The number of zero window advertisements sent by FIX clients. A device advertises a Zero Window when incoming data is arriving too quickly to be processed. Response Zero Windows The number of zero window advertisements sent by servers while receiving FIX requests. A device advertises a Zero Window when incoming data is arriving too quickly to be processed. RTOs In The number of retransmission timeouts caused by congestion when clients were sending FIX requests. An RTO is a 1-5 second stall in the TCP connection flow due to excessive retransmissions. RTOs Out The number of retransmission timeouts caused by congestion when servers were sending FIX responses. An RTO is a 1-5 second stall in the TCP connection flow due to excessive retransmissions. Request L2 Bytes The number of L2 bytes associated with FIX requests. Response L2 Bytes The number of L2 bytes associated with FIX responses. Request Goodput Bytes The number of goodput bytes associated with FIX requests. Goodput refers to the throughput of the original data transferred and excludes other throughput such as protocol headers or retransmitted packets. Response Goodput Bytes The number of goodput bytes associated with FIX responses. Goodput refers to the throughput of the original data transferred and excludes other throughput such as protocol headers or retransmitted packets. Request Packets The number of packets associated with FIX requests. Response Packets The number of packets associated with FIX responses.
FIX client page
This page displays metric charts of FIX server traffic associated with a device on your network.
- Learn about charts on this page:
- Learn about working with metrics.
FIX Summary
The following charts are available in this region:
- Transactions
- This chart shows you when FIX errors occurred. The chart also shows you how many FIX
responses the client received so that you can see how active the client was at the time
it received the errors.
In a healthy environment, the number of requests and responses should be roughly equal. For more information, see Requests and Responses.
Metric Description Responses The number of responses that the device received when acting as a FIX client. Errors When the device is acting as a FIX client, the number of error responses received. These metrics do not include the processing of order and trade errors. - Total Transactions
-
This chart displays the total number of FIX responses the client received and how many of those responses contained errors.
Metric Description Responses The number of responses that the device received when acting as a FIX client. Errors When the device is acting as a FIX client, the number of error responses received. These metrics do not include the processing of order and trade errors. - Performance (95th Percentile)
-
This chart shows the 95th percentile of timing metrics, measured in
milliseconds. The transfer and processing time metrics show parts of a complete
transaction. The request transfer time shows how long the client took to transmit requests
onto the network; the server processing time shows how long servers took to process the
requests; and the response transfer time shows how long servers took to transmit responses
onto the network.
Transfer and processing times are calculated by measuring the time between when the first and last packets of requests and responses are seen by the ExtraHop system, as shown in the following figure:
It can be difficult to tell whether an issue is caused by a network or a device from looking only at transfer and processing times, because these metrics alone provide an incomplete picture. Therefore the round trip time (RTT) metric is also included in this chart. RTT metrics are a good indicator of how your network is performing. If you see high transfer or processing times, but the RTT is low, the issue is probably at the device-level. However, if the RTT, processing, and transfer times are all high, network latency might be affecting the transfer and processing times, and the issue might be with the network.
The RTT metric can help identify the source of the problem because it only measures how long an immediate acknowledgment takes to be sent from the client or server; it does not wait until all packets are delivered.
The ExtraHop system calculates the RTT value by measuring the time between the first packet of a request and the acknowledgment from the server, as shown in the following figure:
The request transfer time might be high because the client took a long time to transmit the request (possibly because the request was very large); however, the transfer time could also be high because the request took a long time to travel on the network (possibly because of network congestion).
Learn more about how the ExtraHop system calculates round trip time on the ExtraHop blog.
Metric Description Request Transfer Time When the device is acting as a FIX client, the time between the ExtraHop system detecting the first packet and last packet of sent requests. A high number might indicate a large request or network delay. Server Processing Time When the device is acting as a FIX client, the time between the ExtraHop system detecting the last packet of the sent request and the first packet of the received response. Response Transfer Time When the device is acting as a FIX client, the time between the ExtraHop system detecting the first packet and last packet of received responses. A high number might indicate a large response or network delay. Round Trip Time The time between when a FIX client sent a packet that required an immediate acknowledgment and when the client received the acknowledgment. Round trip time (RTT) is a measurement of network latency. The Performance (95th percentile) chart shows the highest value for a time period while filtering outliers; the 95th percentile is the highest value that falls below 95% of the values for a sample period. By displaying the 95th value, rather than the true maximum, the chart gives you a more accurate view of the data:
- Performance (95th)
-
This chart shows the 95th percentile of timing
metrics, measured in milliseconds. If a client is acting slow, performance summary
metrics can help you figure out whether the network or servers are causing the issue.
These metrics show the 95th percentile amount of time that servers took to process
requests from the client versus the 95th percentile time that packets from those
requests (and their respective responses) took to be transmitted across the network.
High server processing times indicate that the client is contacting slow servers. High
TCP round trip times indicate that the client is communicating over slow
networks.
Metric Description Server Processing Time When the device is acting as a FIX client, the time between the ExtraHop system detecting the last packet of the sent request and the first packet of the received response. Round Trip Time The time between when a FIX client sent a packet that required an immediate acknowledgment and when the client received the acknowledgment. Round trip time (RTT) is a measurement of network latency.
FIX Details
The following charts are available in this region:
- Top Methods
- This chart shows which FIX methods the client called the most by breaking out the total number of requests the client sent by method.
- Top Versions
- This chart shows which versions of the FIX protocol the client communicated over the most by breaking out the total number of requests the client sent by FIX version.
- Top Targets
- This chart shows the top FIX targets for the client by breaking out the total number of requests the client sent by target.
FIX Performance
The following charts are available in this region:
- Server Processing Time Distribution
-
This chart breaks out server processing times in a histogram to
show the most common processing times, measured in milliseconds.
Metric Description Server Processing Time When the device is acting as a FIX client, the time between the ExtraHop system detecting the last packet of the sent request and the first packet of the received response. - Server Processing Time
-
This chart shows the median processing time for the client,
measured in milliseconds.
Metric Description Server Processing Time When the device is acting as a FIX client, the time between the ExtraHop system detecting the last packet of the sent request and the first packet of the received response. - Round Trip Time Distribution
-
This chart breaks out round trip times in a histogram to show the
most common round trip times, measured in milliseconds.
Metric Description Round Trip Time The time between when a FIX client sent a packet that required an immediate acknowledgment and when the client received the acknowledgment. Round trip time (RTT) is a measurement of network latency. - Round Trip Time
-
This chart shows the median round trip time for the client, measured in
milliseconds.
Metric Description Round Trip Time The time between when a FIX client sent a packet that required an immediate acknowledgment and when the client received the acknowledgment. Round trip time (RTT) is a measurement of network latency.
Network Data
This region shows you TCP information that is related to the current protocol. In general, host stalls indicate that there is an issue with either the server or the client, and network stalls indicate that there is an issue with the network.
- Host Stalls
- This chart shows the number of zero windows that were advertised or received by the
device. Devices control the amount of data they receive by specifying the number of
packets that can be sent to them over a given time period. When a device is sent more
data than it can process, the device advertises a zero window to ask its peer device to
stop sending packets completely until the device catches up. If you see a large number
of zero windows, a server or client might not be not fast enough to support the amount
of data being received.
Metric Definition Zero Windows In The number of zero windows that were sent to the device to stop the flow of data over the connection. A device advertises a Zero Window when incoming data is arriving too quickly to be processed. A large number of zero windows in indicates that a peer device was too slow to process the amount of data received.
Zero Windows Out The number of zero windows that were sent from the device to stop the flow of data. A device advertises a Zero Window when incoming data is arriving too quickly to be processed. A large number of zero windows out indicates that the client was too slow to process the amount of data received.
- Network Stalls
-
This chart shows the number of retransmission timeouts that occurred. Retransmission timeouts (RTOs) occur when a network drops too many packets, usually due to packet collisions or buffer exhaustion. If a device sends a request or response and does not receive confirmation within a specified amount of time, the device retransmits the request. If too many retransmissions are unacknowledged, an RTO occurs. If you see a large number of RTOs, the network might be too slow to support the current level of activity.
Metric Definition RTOs In The number of retransmission timeouts (RTOs) caused by network congestion as peers were sending data to the current device. An RTO is a 1-5 second stall in the TCP connection flow due to excessive retransmissions. If you see a large number of RTOs in, the device did not send an acknowledgment to the server quickly enough, or the network might be too slow to support the current level of activity. Depending on the timeout value configured in the operating system, this delay can be anywhere from 1 to 8 seconds.
RTOs Out The number of retransmission timeouts (RTOs) caused by network congestion as the device was sending data to its peers. An RTO is a 1-5 second stall in the TCP connection flow due to excessive retransmissions. If you see a large number of RTOs out, the device did not receive an acknowledgment from the server quickly enough, or the network might be too slow to support the current level of activity. Depending on the timeout value configured in the operating system, this delay can be anywhere from 1 to 8 seconds.
FIX Metric Totals
The following charts are available in this region:
- Total Requests and Responses
- Requests and responses represent the conversation taking place between clients and
servers. If there are more requests than responses, the client might be sending more
requests than the servers can handle or the network might be too slow. To identify
whether the issue is with the network or the server, check RTOs and zero windows in the
Network Data
section.
Note: It is unlikely that the total number of FIX requests and responses will be exactly equal, even in a healthy environment. For example, you might be viewing a time period that captures a response to a request that was sent before the start of the time period. In general, the greater the difference between responses and errors, the greater the chance that there is an issue with those transactions. Metric Description Requests The number of requests that the device sent when acting as a FIX client. Responses The number of responses that the device received when acting as a FIX client. Errors When the device is acting as a FIX client, the number of error responses received. These metrics do not include the processing of order and trade errors. Aborted Requests The number of requests that this FIX client began to send but did not send completely. Aborted Responses The number of responses that this FIX client device began to receive but did not receive completely. POS Duplicate The number of possible duplicate messages that the device sent when acting as a FIX client. When a FIX engine is unsure if a message was successfully received at its intended destination or when responding to a resend request, a possible duplicate (PossDup) message is generated. POS Resend The number of possible resend messages that the device sent when acting as a FIX client. Ambiguous application-level messages might be resent when an order remains unacknowledged for an inordinate length of time. - Request and Response Size
- This chart shows the average size of requests and responses.
Metric Description Request Size The distribution of sizes (in bytes) of requests that the device sent when acting as a FIX client. Response Size The distribution of sizes (in bytes) of responses received when the device is acting as a FIX client.
FIX server page
This page displays metric charts of FIX server traffic associated with a device on your network.
- Learn about charts on this page:
- Learn about working with metrics.
FIX Summary
The following charts are available in this region:
- Transactions
- This chart shows you when FIX errors occurred. The chart also shows you how many FIX
responses the server sent so that you can see how active the server was at the time it
returned the errors.
However, if the number of errors is low, the issue might be more complex, and you should examine the ratio of requests to responses. In a healthy environment, the number of requests and responses should be roughly equal. For more information, see Requests and Responses.
Metric Description Responses The number of responses that the device sent when acting as a FIX server. Errors When the device is acting as a FIX server, the number of error responses sent. These metrics do not include the processing of order and trade errors. - Total Transactions
-
This chart displays the total number of FIX responses the server sent and how many of those responses contained errors.
Metric Description Responses The number of responses that the device sent when acting as a FIX server. Errors When the device is acting as a FIX server, the number of error responses sent. These metrics do not include the processing of order and trade errors. - Performance (95th Percentile)
-
This chart shows the 95th percentile of timing metrics, measured in
milliseconds. The transfer and processing time metrics show parts of a complete
transaction. The request transfer time shows how long clients took to transmit requests
onto the network; the server processing time shows how long the server took to process
requests; and the response transfer time shows how long the server took to transmit
responses onto the network.
Transfer and processing times are calculated by measuring the time between when the first and last packets of requests and responses are seen by the ExtraHop system, as shown in the following figure:
It can be difficult to tell whether an issue is caused by a network or a device from looking only at transfer and processing times, because these metrics alone provide an incomplete picture. Therefore the round trip time (RTT) metric is also included in this chart. RTT metrics are a good indicator of how your network is performing. If you see high transfer or processing times, but the RTT is low, the issue is probably at the device-level. However, if the RTT, processing, and transfer times are all high, network latency might be affecting the transfer and processing times, and the issue might be with the network.
The RTT metric can help identify the source of the problem because it only measures how long an immediate acknowledgment takes to be sent from the client or server; it does not wait until all packets are delivered.
The ExtraHop system calculates the RTT value by measuring the time between the first packet of a request and the acknowledgment from the server, as shown in the following figure:
The request transfer time might be high because the client took a long time to transmit the request (possibly because the request was very large); however, the transfer time could also be high because the request took a long time to travel on the network (possibly because of network congestion).
Learn more about how the ExtraHop system calculates round trip time on the ExtraHop blog.
Metric Description Request Transfer Time When the device is acting as a FIX server, the time between the ExtraHop system detecting the first packet and last packet of received requests. A high number might indicate a large request or network delay. Server Processing Time When the device is acting as a FIX server, the time between the ExtraHop system detecting the last packet of the received request and first packet of the sent response. Response Transfer Time When the device is acting as a FIX server, the time between the ExtraHop system detecting the first packet and last packet of sent responses. A high number might indicate a large response or network delay. Round Trip Time The time between when a FIX server sent a packet that required an immediate acknowledgment and when the server received the acknowledgment. Round trip time (RTT) is a measurement of network latency. The Performance (95th percentile) chart shows the highest value for a time period while filtering outliers; the 95th percentile is the highest value that falls below 95% of the values for a sample period. By displaying the 95th value, rather than the true maximum, the chart gives you a more accurate view of the data:
- Performance (95th)
-
This chart shows the 95th percentile of timing
metrics, measured in milliseconds. If a server is acting slow, performance summary
metrics can help you figure out whether the network or the server is causing the
issue. The performance summary metrics show the 95th percentile amount of time the
server took to process requests from clients versus the 95th percentile time that
packets from those requests (and their respective responses) took to be transmitted
across the network. High server processing times indicate that the server is slow.
High RTTs indicate that the server is communicating over slow networks.
Metric Description Server Processing Time When the device is acting as a FIX server, the time between the ExtraHop system detecting the last packet of the received request and first packet of the sent response. Round Trip Time The time between when a FIX server sent a packet that required an immediate acknowledgment and when the server received the acknowledgment. Round trip time (RTT) is a measurement of network latency.
FIX Details
The following charts are available in this region:
- Top Methods
- This chart shows which FIX methods were called on the server the most by breaking out the total number of requests the server received by method.
- Top Versions
- This chart shows which versions of the FIX protocol the server communicated over the most by breaking out the total number of requests the server received by FIX version.
- Top Targets
- This chart shows the top FIX targets for the server by breaking out the total number of requests the server received by target.
FIX Performance
The following charts are available in this region:
- Server Processing Time Distribution
-
This chart breaks out server processing times in a histogram to
show the most common processing times, measured in milliseconds.
Metric Description Server Processing Time When the device is acting as a FIX server, the time between the ExtraHop system detecting the last packet of the received request and first packet of the sent response. - Server Processing Time
-
This chart shows the median processing time for the server,
measured in milliseconds.
Metric Description Server Processing Time When the device is acting as a FIX server, the time between the ExtraHop system detecting the last packet of the received request and first packet of the sent response. - Round Trip Distribution
-
This chart breaks out round trip times in a histogram to show the
most common round trip times, measured in milliseconds.
Metric Description Round Trip Time The time between when a FIX server sent a packet that required an immediate acknowledgment and when the server received the acknowledgment. Round trip time (RTT) is a measurement of network latency. - Round Trip Time
-
This chart shows the median round trip time for the server, measured in
milliseconds.
Metric Description Round Trip Time The time between when a FIX server sent a packet that required an immediate acknowledgment and when the server received the acknowledgment. Round trip time (RTT) is a measurement of network latency.
Network Data
This region shows you TCP information that is related to the current protocol. In general, host stalls indicate that there is an issue with either the server or the client, and network stalls indicate that there is an issue with the network.
- Host Stalls
- This chart shows the number of zero windows that were advertised or received by the
device. Devices control the amount of data they receive by specifying the number of
packets that can be sent to them over a given time period. When a device is sent more
data than it can process, the device advertises a zero window to ask its peer device to
stop sending packets completely until the device catches up. If you see a large number
of zero windows, a server or client might not be not fast enough to support the amount
of data being received.
Metric Definition Zero Windows In The number of zero windows that were sent to the device to stop the flow of data over the connection. A device advertises a Zero Window when incoming data is arriving too quickly to be processed. A large number of zero windows in indicates that a peer device was too slow to process the amount of data received.
Zero Windows Out The number of zero windows that were sent from the device to stop the flow of data. A device advertises a Zero Window when incoming data is arriving too quickly to be processed. A large number of zero windows out indicates that the client was too slow to process the amount of data received.
- Network Stalls
-
This chart shows the number of retransmission timeouts that occurred. Retransmission timeouts (RTOs) occur when a network drops too many packets, usually due to packet collisions or buffer exhaustion. If a device sends a request or response and does not receive confirmation within a specified amount of time, the device retransmits the request. If too many retransmissions are unacknowledged, an RTO occurs. If you see a large number of RTOs, the network might be too slow to support the current level of activity.
Metric Definition RTOs In The number of retransmission timeouts (RTOs) caused by network congestion as peers were sending data to the current device. An RTO is a 1-5 second stall in the TCP connection flow due to excessive retransmissions. If you see a large number of RTOs in, the device did not send an acknowledgment to the server quickly enough, or the network might be too slow to support the current level of activity. Depending on the timeout value configured in the operating system, this delay can be anywhere from 1 to 8 seconds.
RTOs Out The number of retransmission timeouts (RTOs) caused by network congestion as the device was sending data to its peers. An RTO is a 1-5 second stall in the TCP connection flow due to excessive retransmissions. If you see a large number of RTOs out, the device did not receive an acknowledgment from the server quickly enough, or the network might be too slow to support the current level of activity. Depending on the timeout value configured in the operating system, this delay can be anywhere from 1 to 8 seconds.
FIX Metric Totals
The following charts are available in this region:
- Requests and Responses
- Requests and responses represent the conversation taking place between clients and
servers. If there are more requests than responses, clients might be sending more
requests than the server can handle or the network might be too slow. To identify
whether the issue is with the network or the server, check RTOs and zero windows in the
Network Data
section.
Note: It is unlikely that the total number of FIX requests and responses will be exactly equal, even in a healthy environment. For example, you might be viewing a time period that captures a response to a request that was sent before the start of the time period. In general, the greater the difference between responses and errors, the greater the chance that there is an issue with those transactions. Metric Description Requests The number of requests that the device received when acting as a FIX server. Responses The number of responses that the device sent when acting as a FIX server. Errors When the device is acting as a FIX server, the number of error responses sent. These metrics do not include the processing of order and trade errors. Aborted Requests The number of requests that this FIX server began to receive but did not receive completely. Aborted Responses The number of responses that this FIX server began to send but did not send completely. POS Duplicate The number of possible duplicate messages sent when the device is acting as a FIX server. When a FIX engine is unsure if a message was successfully received at its intended destination or when responding to a resend request, a possible duplicate (PossDup) message is generated. POS Resend The number of possible resend messages sent when the device is acting as a FIX server. Ambiguous application-level messages might be resent when an order remains unacknowledged for an inordinate length of time. - Average Request and Response Size
- This chart shows the average size of requests and responses.
Metric Description Request Size The distribution of sizes (in bytes) of requests that the device received when acting as a FIX server. Response Size The distribution of sizes (in bytes) of responses received when the device is acting as a FIX server.
FIX client group page
This page displays metric charts of FIX server traffic associated with a device group on your network.
- Learn about charts on this page:
- Learn about working with metrics.
FIX Summary for Group
The following charts are available in this region:
- Transactions
- This chart shows you when FIX errors occurred and how many responses the FIX clients
received. This information can help you see how active the clients were at the time they
received the errors.
In a healthy environment, the number of requests and responses should be roughly equal. For more information, see the Metrics for Group section below.
Metric Description Responses The number of responses that the device received when acting as a FIX client. Errors When the device is acting as a FIX client, the number of error responses received. These metrics do not include the processing of order and trade errors. - Total Transactions
- This chart shows you how many FIX responses the clients received and how many of those
responses contained errors.
Metric Description Responses The number of responses that the device received when acting as a FIX client. Errors When the device is acting as a FIX client, the number of error responses received. These metrics do not include the processing of order and trade errors.
FIX Details for Group
The following charts are available in this region:
- Top Group Members (FIX Clients)
- This chart shows which FIX clients in the group were most active by breaking out the total number of FIX requests the group sent by client.
- Top Methods
- This chart shows which FIX methods the group called the most by breaking out the total number of requests the group sent by method.
- Top Versions
- This chart shows the top FIX targets for the group by breaking out the total number of requests the group sent by target.
FIX Metrics for Group
The following charts are available in this region:
- Total Requests and Responses
-
Requests
and responses represent the conversation taking place between clients and servers. If there
are more requests than responses, the clients might be sending more requests than servers
can handle or the network might be too slow.
Note: It is unlikely that the total number of requests and responses will be exactly equal, even in a healthy environment. For example, you might be viewing a time period that captures a response to a request that was sent before the start of the time period. In general, the greater the difference between responses and errors, the greater the chance that there is an issue with those transactions. Metric Description Requests The number of requests that the device sent when acting as a FIX client. Responses The number of responses that the device received when acting as a FIX client. Errors When the device is acting as a FIX client, the number of error responses received. These metrics do not include the processing of order and trade errors. Aborted Requests The number of requests that this FIX client began to send but did not send completely. Aborted Responses The number of responses that this FIX client device began to receive but did not receive completely. POS Duplicate The number of possible duplicate messages that the device sent when acting as a FIX client. When a FIX engine is unsure if a message was successfully received at its intended destination or when responding to a resend request, a possible duplicate (PossDup) message is generated. POS Resend The number of possible resend messages that the device sent when acting as a FIX client. Ambiguous application-level messages might be resent when an order remains unacknowledged for an inordinate length of time. - Server Processing Time
-
If a client group is acting slow, the server processing time
can help you figure out whether the issue is with the servers. The Server Processing Time
chart shows the median amount of time servers took to process requests from the clients,
measured in milliseconds. High server processing times indicate that the clients are
contacting slow servers.
Metric Description Server Processing Time When the device is acting as a FIX client, the time between the ExtraHop system detecting the last packet of the sent request and the first packet of the received response.
FIX server group page
This page displays metric charts of FIX server traffic associated with a device group on your network.
- Learn about charts on this page:
- Learn about working with metrics.
FIX Summary for Group
The following charts are available in this region:
- Transactions
- This chart shows you when FIX errors occurred and how many FIX responses the servers
sent. This information can help you see how active the servers were at the time they
returned the errors.
In a healthy environment, the number of requests and responses should be roughly equal. For more information, see the Metrics for Group section below.
Metric Description Responses The number of responses that the device sent when acting as a FIX server. Errors When the device is acting as a FIX server, the number of error responses sent. These metrics do not include the processing of order and trade errors. - Total Transactions
- This chart shows you how many FIX responses servers in the group sent and how many of those
responses contained errors.
Metric Description Responses The number of responses that the device sent when acting as a FIX server. Errors When the device is acting as a FIX server, the number of error responses sent. These metrics do not include the processing of order and trade errors.
FIX Details for Group
The following charts are available in this region:
- Top Group Members (FIX Servers)
- This chart shows which FIX servers in the group were most active by breaking out the total number of FIX responses the group sent by server.
- Top Methods
- This chart shows which FIX methods were called on servers in the group the most by breaking out the total number of requests the group received by method.
- Top Versions
- This chart shows the top FIX targets for the group by breaking out the total number of requests the group received by target.
Fix Metrics for Group
The following charts are available in this region:
- Total Requests and Responses
-
Requests
and responses represent the conversation taking place between clients and servers. If there
are more requests than responses, clients might be sending more requests than the servers
can handle or the network might be too slow.
Note: It is unlikely that the total number of requests and responses will be exactly equal, even in a healthy environment. For example, you might be viewing a time period that captures a response to a request that was sent before the start of the time period. In general, the greater the difference between responses and errors, the greater the chance that there is an issue with those transactions. Metric Description Requests The number of requests that the device received when acting as a FIX server. Responses The number of responses that the device sent when acting as a FIX server. Errors When the device is acting as a FIX server, the number of error responses sent. These metrics do not include the processing of order and trade errors. Aborted Requests The number of requests that this FIX server began to receive but did not receive completely. Aborted Responses The number of responses that this FIX server began to send but did not send completely. POS Duplicate The number of possible duplicate messages sent when the device is acting as a FIX server. When a FIX engine is unsure if a message was successfully received at its intended destination or when responding to a resend request, a possible duplicate (PossDup) message is generated. POS Resend The number of possible resend messages sent when the device is acting as a FIX server. Ambiguous application-level messages might be resent when an order remains unacknowledged for an inordinate length of time. - Server Processing Time
-
The Server Processing Time chart shows the median amount of
time the servers took to process requests from clients, measured in milliseconds. High
server processing times indicate that the servers in a group are slow.
Metric Description Server Processing Time When the device is acting as a FIX server, the time between the ExtraHop system detecting the last packet of the received request and first packet of the sent response.
FTP
The ExtraHop system collects metrics about File Transfer Protocol (FTP) activity. FTP ) is a standard network protocol for transferring files between a client and a server.
Learn more by taking the FTP Quick Peek training.
Security considerations
- FTP authentication can be vulnerable to brute force, which is a method for guessing credentials by submitting numerous authentication requests with different username and password combinations.
- Anonymous FTP authentication might expose sensitive data to unauthorized users.
FTP application page
This page displays metric charts of FTP traffic associated with an application container on your network.
- Learn about charts on this page:
- Learn about FTP security considerations
- Learn about working with metrics.
FTP Summary
The following charts are available in this region:
- Transactions
- This chart shows you when FTP errors, warnings, and responses were associated with the
application. This information can help you see how active the application was at the
time the errors and warnings occurred.
In a healthy environment, the number of requests and responses should be roughly equal. For more information, see Requests and Responses.
Metric Description Warnings The number of responses with an FTP status code of 4xx. Responses The number of FTP responses. Errors The number of FTP response errors. - Total Transactions
- This chart displays the total number of FTP responses that were associated with the
application and how many of those responses contained warnings and errors.
Metric Description Responses The number of FTP responses. Errors The number of FTP response errors. - Performance (95th Percentile)
-
This chart shows the 95th percentile of timing metrics,
measured in milliseconds. The transfer and processing time metrics show parts of a
complete transaction. The request transfer time shows how long clients took to transmit
requests onto the network; the server processing time shows how long the servers took to
process requests; and the response transfer time shows how long the servers took to
transmit responses onto the network.
Transfer and processing times are calculated by measuring the time between when the first and last packets of requests and responses are seen by the ExtraHop system, as shown in the following figure:
It can be difficult to tell whether an issue is caused by a network or a device from looking only at transfer and processing times, because these metrics alone provide an incomplete picture. Therefore the round trip time (RTT) metric is also included in this chart. RTT metrics are a good indicator of how your network is performing. If you see high transfer or processing times, but the RTT is low, the issue is probably at the device-level. However, if the RTT, processing, and transfer times are all high, network latency might be affecting the transfer and processing times, and the issue might be with the network.
The RTT metric can help identify the source of the problem because it only measures how long an immediate acknowledgment takes to be sent from the client or server; it does not wait until all packets are delivered.
The ExtraHop system calculates the RTT value by measuring the time between the first packet of a request and the acknowledgment from the server, as shown in the following figure:
The request transfer time might be high because the client took a long time to transmit the request (possibly because the request was very large); however, the transfer time could also be high because the request took a long time to travel on the network (possibly because of network congestion).
Learn more about how the ExtraHop system calculates round trip time on the ExtraHop blog.
Metric Description Request Transfer Time The time between the ExtraHop system detecting the first packet and last packet of FTP requests. A high number might indicate a large request or network delay. Server Processing Time The time between the ExtraHop system detecting the last packet of FTP requests and the first packet of their corresponding responses. Response Transfer Time The time between the ExtraHop system detecting the first packet and last packet of FTP responses. A high number might indicate a large response or network delay. Round Trip Time The time between when an FTP client or server sent a packet requiring immediate acknowledgment and when the acknowledgment was received. The Performance (95th percentile) chart shows the highest value for a time period while filtering outliers; the 95th percentile is the highest value that falls below 95% of the values for a sample period. By displaying the 95th value, rather than the true maximum, the chart gives you a more accurate view of the data:
- Performance (95th)
-
This chart shows the 95th percentile of timing
metrics, measured in milliseconds. If an application is acting slow, performance
summary metrics can help you figure out whether the network or servers are causing the
issue. These metrics show the 95th percentile of time that servers took to process
requests from clients versus the 95th percentile time that packets from those requests
(and their respective responses) took to be transmitted across the network. High
server processing times indicate that clients are contacting slow servers. High TCP
round trip times indicate that clients are communicating over slow networks.
Metric Description Server Processing Time The time between the ExtraHop system detecting the last packet of FTP requests and the first packet of their corresponding responses. Round Trip Time The time between when an FTP client or server sent a packet requiring immediate acknowledgment and when the acknowledgment was received.
FTP Details
The following charts are available in this region:
- Top Methods
- This chart shows which FTP methods were associated with the application by breaking out the total number of FTP requests by method.
- Top Status Codes
- This chart shows which FTP status codes the server returned the most by breaking out the total number of responses the application sent by status code.
- Top Users
- This chart shows which users were most active in the application by breaking out the total number of FTP requests sent by the application.
FTP Performance
The following charts are available in this region:
- Server Processing Time Distribution
-
This chart breaks out server processing times in a histogram to
show the most common processing times, measured in milliseconds.
Metric Description Server Processing Time The time between the ExtraHop system detecting the last packet of FTP requests and the first packet of their corresponding responses. - Server Processing Time
-
This chart shows the median processing time for the
application, measured in milliseconds.
Metric Description Server Processing Time The time between the ExtraHop system detecting the last packet of FTP requests and the first packet of their corresponding responses. - Round Trip Time Distribution
-
This chart breaks out round trip times in a histogram to show the
most common round trip times, measured in milliseconds.
Metric Description Round Trip Time The time between when an FTP client or server sent a packet requiring immediate acknowledgment and when the acknowledgment was received. - Round Trip Time
-
This chart shows the median round trip time for the application,
measured in milliseconds.
Metric Description Round Trip Time The time between when an FTP client or server sent a packet requiring immediate acknowledgment and when the acknowledgment was received.
Network Data
This region shows you TCP information that is related to the current protocol. In general, host stalls indicate that there is an issue with either a server or a client, and network stalls indicate that there is an issue with the network.
- Host Stalls
-
This chart shows the number of zero windows that were
associated with an application. Devices control the amount of data they receive by
specifying the number of packets that can be sent to them over a given time period.
When a device is sent more data than it can process, the device advertises a zero
window to ask its peer device to stop sending packets completely until the device
catches up. If you see a large number of zero windows, a server or client might not be
not fast enough to support the amount of data being received.
Metric Definition Request Zero Windows The number of zero window advertisements sent by FTP clients. A device advertises a Zero Window when incoming data is arriving too quickly to be processed. A large number of incoming Zero Windows indicates that a peer device was too slow to process the amount of data received.
Response Zero Windows The number of zero window advertisements sent by servers while receiving FTP requests. A device advertises a Zero Window when incoming data is arriving too quickly to be processed. A large number of outgoing Zero Windows indicates that a client was too slow to process the amount of data received.
- Total Host Stalls
- This chart shows the median number of zero window advertisements sent by devices.
- Network Stalls
-
This chart shows the number of retransmission
timeouts that occurred. Retransmission timeouts (RTOs) occur when a network drops too
many packets, usually due to packet collisions or buffer exhaustion. If a device sends
a request or response and does not receive confirmation within a specified amount of
time, the device retransmits the request. If too many retransmissions are
unacknowledged, an RTO occurs. If you see a large number of RTOs, the network might be
too slow to support the current level of activity.
Metric Definition RTOs In The number of retransmission timeouts (RTOs) caused by congestion when clients were sending FTP requests. An RTO is a 1-5 second stall in the TCP connection flow due to excessive retransmissions. If you see a large number of incoming RTOs, a device did not send an acknowledgment to the server quickly enough, or the network might be too slow to support the current level of activity. Depending on the timeout value configured in the operating system, this delay can be anywhere from 1 to 8 seconds.
RTOs Out The number of retransmission timeouts caused by congestion when servers were sending FTP responses. An RTO is a 1-5 second stall in the TCP connection flow due to excessive retransmissions. If you see a large number of outgoing RTOs, a device did not receive an acknowledgment from the server quickly enough, or the network might be too slow to support the current level of activity. Depending on the timeout value configured in the operating system, this delay can be anywhere from 1 to 8 seconds.
- Total Network Stalls
-
This chart shows the median number of
retransmission timeouts caused by congestion when clients and servers were sending
requests.
Metric Definition RTOs In The number of retransmission timeouts (RTOs) caused by congestion when clients were sending FTP requests. An RTO is a 1-5 second stall in the TCP connection flow due to excessive retransmissions. If you see a large number of incoming RTOs, a device did not send an acknowledgment to the server quickly enough, or the network might be too slow to support the current level of activity. Depending on the timeout value configured in the operating system, this delay can be anywhere from 1 to 8 seconds.
RTOs Out The number of retransmission timeouts caused by congestion when servers were sending FTP responses. An RTO is a 1-5 second stall in the TCP connection flow due to excessive retransmissions. If you see a large number of outgoing RTOs, a device did not receive an acknowledgment from the server quickly enough, or the network might be too slow to support the current level of activity. Depending on the timeout value configured in the operating system, this delay can be anywhere from 1 to 8 seconds.
FTP Metric Totals
The following charts are available in this region:
- Total Requests and Responses
-
Requests and responses represent the conversation taking place between clients and servers. If there are more requests than responses, clients might be sending more requests than servers can handle or the network might be too slow. To identify whether the issue is with the network or a server, check RTOs and zero windows in the Network Data section.
Note: It is unlikely that the total number of FTP requests and responses will be exactly equal, even in a healthy environment. For example, you might be viewing a time period that captures a response to a request that was sent before the start of the time period. In general, the greater the difference between responses and errors, the greater the chance that there is an issue with those transactions. Metric Description Requests The number of FTP requests. Responses The number of FTP responses. Errors The number of FTP response errors. Warnings The number of responses with an FTP status code of 4xx. - FTP Network Metrics
-
Metric Description Request Zero Windows The number of zero window advertisements sent by FTP clients. A device advertises a Zero Window when incoming data is arriving too quickly to be processed. Response Zero Windows The number of zero window advertisements sent by servers while receiving FTP requests. A device advertises a Zero Window when incoming data is arriving too quickly to be processed. Request RTOs The number of retransmission timeouts (RTOs) caused by congestion when clients were sending FTP requests. An RTO is a 1-5 second stall in the TCP connection flow due to excessive retransmissions. Response RTOs The number of retransmission timeouts caused by congestion when servers were sending FTP responses. An RTO is a 1-5 second stall in the TCP connection flow due to excessive retransmissions. Request L2 Bytes The number of L2 bytes associated with FTP requests. Response L2 Bytes The number of L2 bytes associated with FTP responses. Request Goodput Bytes The number of goodput bytes associated with FTP requests. Goodput refers to the throughput of the original data transferred and excludes other throughput such as protocol headers or retransmitted packets. Response Goodput Bytes The number of goodput bytes associated with FTP responses. Goodput refers to the throughput of the original data transferred and excludes other throughput such as protocol headers or retransmitted packets. Request Packets The number of packets associated with FTP requests. Response Packets The number of packets associated with FTP responses.
FTP client page
This page displays metric charts of FTP traffic associated with a device on your network.
- Learn about charts on this page:
- Learn about FTP security considerations
- Learn about working with metrics.
FTP Summary
The following charts are available in this region:
- Transactions
- This chart shows you when FTP errors occurred and how many responses the FTP client
received. This information can help you see how active the client was at the time it
received the errors.
In a healthy environment, the number of requests and responses should be roughly equal. For more information, see Requests and Responses.
Metric Description Warnings The number of responses with a status code of 4xx, that the device received when acting as an FTP client. Responses The number of responses that the device received when acting as an FTP client. Errors The number of errors that the device received when acting as an FTP client. - Total Transactions
- This chart displays the total number of FTP responses the client received and how many
of those responses contained errors and warnings.
Metric Description Responses The number of responses that the device received when acting as an FTP client. Errors The number of errors that the device received when acting as an FTP client. Warnings The number of responses with a status code of 4xx, that the device received when acting as an FTP client. - Performance (95th Percentile)
- This chart shows the 95th percentile of timing metrics. The server processing time
shows how long servers took to process requests from the client, measured in
milliseconds. The round trip time (RTT) metric measures how long it took for packets to
get an immediate acknowledgment from the client or server. The ExtraHop system
calculates RTT by measuring the time between the first packet of a request and the
acknowledgment from the server, as shown in the following figure:
RTT only measures how long an immediate acknowledgment takes to be sent; it does not wait until all packets are delivered. Therefore, RTT is a good indicator of how your network is performing. If you see high processing times, but the TCP RTT is low, the issue is probably at the device-level. However, if the TCP RTT, processing, and transfer times are all high, network latency might be affecting the transfer and processing times, and the issue might be with the network.
Learn more about how the ExtraHop system calculates round trip time on the ExtraHop blog.
Metric Description Request Transfer Time When the device is acting as an FTP client, the time between the ExtraHop system detecting the first packet and last packet of sent requests. A high number might indicate a large request or network delay. Server Processing Time When the device is acting as an FTP client, the time between the ExtraHop system detecting the last packet of the sent request and the first packet of the received response. Response Transfer Time When the device is acting as an FTP client, the time between the ExtraHop system detecting the first packet and last packet of received responses. A high number might indicate a large response or network delay. Round Trip Time The time between when a FTP client sent a packet that required an immediate acknowledgment and when the client received the acknowledgment. Round trip time (RTT) is a measurement of network latency. The Performance (95th percentile) chart shows the highest value for a time period while filtering outliers; the 95th percentile is the highest value that falls below 95% of the values for a sample period. By displaying the 95th value, rather than the true maximum, the chart gives you a more accurate view of the data:
- Performance (95th)
-
This chart shows the 95th percentile of timing
metrics, measured in milliseconds. If a client is acting slow, performance summary
metrics can help you figure out whether the network or servers are causing the issue.
These metrics show the 95th percentile amount of time that servers took to process
requests from the client versus the 95th percentile time that packets from those
requests (and their respective responses) took to be transmitted across the network.
High server processing times indicate that the client is contacting slow servers. High
TCP round trip times indicate that the client is communicating over slow
networks.
Metric Description Server Processing Time When the device is acting as an FTP client, the time between the ExtraHop system detecting the last packet of the sent request and the first packet of the received response. Round Trip Time The time between when a FTP client sent a packet that required an immediate acknowledgment and when the client received the acknowledgment. Round trip time (RTT) is a measurement of network latency.
FTP Details
The following charts are available in this region:
- Top Methods
- This chart shows which FTP methods the client called the most by breaking out the total number of requests the client sent by method.
- Top Status Codes
- This chart shows which FTP status codes the client received the most by breaking out the number of responses returned to the client by status code.
- Top Users
- This chart shows which users were most active on the client by breaking out the total number of FTP requests sent by the client by user.
FTP Performance
The following charts are available in this region:
- Server Processing Time Breakdown
-
This chart breaks out server processing times in a histogram to
show the most common processing times, measured in milliseconds.
Metric Description Server Processing Time When the device is acting as an FTP client, the time between the ExtraHop system detecting the last packet of the sent request and the first packet of the received response. - Server Processing Time
-
This chart shows the median processing time for the client,
measured in milliseconds.
Metric Description Server Processing Time When the device is acting as an FTP client, the time between the ExtraHop system detecting the last packet of the sent request and the first packet of the received response. - Round Trip Time Distribution
-
This chart breaks out round trip times in a histogram to show the
most common round trip times, measured in milliseconds.
Metric Description Round Trip Time The time between when a FTP client sent a packet that required an immediate acknowledgment and when the client received the acknowledgment. Round trip time (RTT) is a measurement of network latency. - Round Trip Time
-
This chart shows the median round trip time for the client, measured in
milliseconds.
Metric Description Round Trip Time The time between when a FTP client sent a packet that required an immediate acknowledgment and when the client received the acknowledgment. Round trip time (RTT) is a measurement of network latency.
Network Data
This region shows you TCP information that is related to the current protocol. In general, host stalls indicate that there is an issue with either the server or the client, and network stalls indicate that there is an issue with the network.
- Host Stalls
- This chart shows the number of zero windows that were advertised or received by the
device. Devices control the amount of data they receive by specifying the number of
packets that can be sent to them over a given time period. When a device is sent more
data than it can process, the device advertises a zero window to ask its peer device to
stop sending packets completely until the device catches up. If you see a large number
of zero windows, a server or client might not be not fast enough to support the amount
of data being received.
Metric Definition Zero Windows In The number of zero windows that were sent to the device to stop the flow of data over the connection. A device advertises a Zero Window when incoming data is arriving too quickly to be processed. A large number of zero windows in indicates that a peer device was too slow to process the amount of data received.
Zero Windows Out The number of zero windows that were sent from the device to stop the flow of data. A device advertises a Zero Window when incoming data is arriving too quickly to be processed. A large number of zero windows out indicates that the client was too slow to process the amount of data received.
- Network Stalls
-
This chart shows the number of retransmission timeouts that occurred. Retransmission timeouts (RTOs) occur when a network drops too many packets, usually due to packet collisions or buffer exhaustion. If a device sends a request or response and does not receive confirmation within a specified amount of time, the device retransmits the request. If too many retransmissions are unacknowledged, an RTO occurs. If you see a large number of RTOs, the network might be too slow to support the current level of activity.
Metric Definition RTOs In The number of retransmission timeouts (RTOs) caused by network congestion as peers were sending data to the current device. An RTO is a 1-5 second stall in the TCP connection flow due to excessive retransmissions. If you see a large number of RTOs in, the device did not send an acknowledgment to the server quickly enough, or the network might be too slow to support the current level of activity. Depending on the timeout value configured in the operating system, this delay can be anywhere from 1 to 8 seconds.
RTOs Out The number of retransmission timeouts (RTOs) caused by network congestion as the device was sending data to its peers. An RTO is a 1-5 second stall in the TCP connection flow due to excessive retransmissions. If you see a large number of RTOs out, the device did not receive an acknowledgment from the server quickly enough, or the network might be too slow to support the current level of activity. Depending on the timeout value configured in the operating system, this delay can be anywhere from 1 to 8 seconds.
FTP Metric Totals
The following charts are available in this region:
- Total Requests and Responses
- Requests and responses represent the conversation taking place between clients and
servers. If there are more requests than responses, the client might be sending more
requests than the servers can handle or the network might be too slow. To identify
whether the issue is with the network or the server, check RTOs and zero windows in the
Network Data
section.
Note: It is unlikely that the total number of FTP requests and responses will be exactly equal, even in a healthy environment. For example, you might be viewing a time period that captures a response to a request that was sent before the start of the time period. In general, the greater the difference between responses and errors, the greater the chance that there is an issue with those transactions. Metric Description Requests The number of FTP requests sent on the command connection when the device is acting as an FTP client. Responses The number of responses that the device received when acting as an FTP client. Warnings The number of responses with a status code of 4xx, that the device received when acting as an FTP client. Errors The number of errors that the device received when acting as an FTP client. Data Requests The number of data requests that the device sent when acting as an FTP client. Data Connects The number of data connections established when the device is acting as an FTP client. - Request and Response Size
- This chart shows the average size of requests and responses.
Metric Description Request Size The distribution of sizes (in bytes) of requests that the device sent when acting as a database client. Response Size The distribution of sizes (in bytes) of responses that the device received when acting as a database client.
FTP server page
This page displays metric charts of FTP traffic associated with a device on your network.
- Learn about charts on this page:
- Learn about FTP security considerations
- Learn about working with metrics.
FTP Summary
The following charts are available in this region:
- Transactions
- This chart displays the total number of FTP responses the server sent and how many of
those responses contained errors and warnings.
Metric Description Responses The number of responses that the device sent when acting as a FTP server. Errors The number of errors that the device sent when acting as an FTP server. Warnings The number of responses with a status code of 4xx, that the device sent when acting as an FTP server. - Transaction Summary
- This chart shows you when FTP errors occurred and how many FTP responses the server
sent. This information can help you see how active the server was at the time it
returned the errors.
In a healthy environment, the number of requests and responses should be roughly equal. For more information, see Requests and Responses.
Metric Description Responses The number of responses that the device sent when acting as a FTP server. Errors The number of errors that the device sent when acting as an FTP server. Warnings The number of responses with a status code of 4xx, that the device sent when acting as an FTP server. - Performance (95th Percentile)
- This chart shows the 95th percentile of timing metrics. The server processing time
shows how long the server took to process requests from clients, measured in
milliseconds. The round trip time (RTT) metric measures how long it took for packets to
get an immediate acknowledgment from the client or server. The ExtraHop system
calculates RTT by measuring the time between the first packet of a request and the
acknowledgment from the server, as shown in the following figure:
RTT only measures how long an immediate acknowledgment takes to be sent; it does not wait until all packets are delivered. Therefore, RTT is a good indicator of how your network is performing. If you see high processing times, but the TCP RTT is low, the issue is probably at the device-level. However, if the TCP RTT, processing, and transfer times are all high, network latency might be affecting the transfer and processing times, and the issue might be with the network.
Learn more about how the ExtraHop system calculates round trip time on the ExtraHop blog.
Metric Description Request Transfer Time When the device is acting as an FTP server, the time between the ExtraHop system detecting the first packet and last packet of received requests. A high number might indicate a large request or network delay. Server Processing Time When the device is acting as an FTP server, the time between the ExtraHop system detecting the last packet of the received request and first packet of the sent response. Response Transfer Time When the device is acting as an FTP server, the time between the ExtraHop system detecting the first packet and last packet of sent responses. A high number might indicate a large response or network delay. Round Trip Time The time between when a FTP server sent a packet that required an immediate acknowledgment and when the server received the acknowledgment. Round trip time (RTT) is a measurement of network latency. The Performance (95th percentile) chart shows the highest value for a time period while filtering outliers; the 95th percentile is the highest value that falls below 95% of the values for a sample period. By displaying the 95th value, rather than the true maximum, the chart gives you a more accurate view of the data:
- Performance (95th)
-
This chart shows the 95th percentile of timing
metrics, measured in milliseconds. If a server is acting slow, performance summary
metrics can help you figure out whether the network or the server is causing the
issue. The performance summary metrics show the 95th percentile amount of time the
server took to process requests from clients versus the 95th percentile time that
packets from those requests (and their respective responses) took to be transmitted
across the network. High server processing times indicate that the server is slow.
High RTTs indicate that the server is communicating over slow networks.
Metric Description Server Processing Time When the device is acting as an FTP server, the time between the ExtraHop system detecting the last packet of the received request and first packet of the sent response. Round Trip Time The time between when a FTP server sent a packet that required an immediate acknowledgment and when the server received the acknowledgment. Round trip time (RTT) is a measurement of network latency.
FTP Details
The following charts are available in this region:
- Top Methods
- This chart shows which FTP methods were called on the server the most by breaking out the total number of requests the server received by method.
- Top Status Codes
- This chart shows which FTP status codes the server returned the most by breaking out the total number of responses the server sent by status code.
- Top Users
- This chart shows which users were most active on the server by breaking out the total number of FTP requests sent to the server by user.
FTP Performance
The following charts are available in this region:
- Server Processing Time Distribution
-
This chart breaks out server processing times in a histogram to
show the most common processing times, measured in milliseconds.
Metric Description Server Processing Time When the device is acting as an FTP server, the time between the ExtraHop system detecting the last packet of the received request and first packet of the sent response. - Server Processing Time
-
This chart shows the median processing time for the server,
measured in milliseconds.
Metric Description Server Processing Time When the device is acting as an FTP server, the time between the ExtraHop system detecting the last packet of the received request and first packet of the sent response. - Round Trip Distribution
-
This chart breaks out round trip times in a histogram to show the
most common round trip times, measured in milliseconds.
Metric Description Round Trip Time The time between when a FTP server sent a packet that required an immediate acknowledgment and when the server received the acknowledgment. Round trip time (RTT) is a measurement of network latency. - Round Trip Time
-
This chart shows the median round trip time for the server, measured in
milliseconds.
Metric Description Round Trip Time The time between when a FTP server sent a packet that required an immediate acknowledgment and when the server received the acknowledgment. Round trip time (RTT) is a measurement of network latency.
Network Data
This region shows you TCP information that is related to the current protocol. In general, host stalls indicate that there is an issue with either the server or the client, and network stalls indicate that there is an issue with the network.
- Host Stalls
- This chart shows the number of zero windows that were advertised or received by the
device. Devices control the amount of data they receive by specifying the number of
packets that can be sent to them over a given time period. When a device is sent more
data than it can process, the device advertises a zero window to ask its peer device to
stop sending packets completely until the device catches up. If you see a large number
of zero windows, a server or client might not be not fast enough to support the amount
of data being received.
Metric Definition Zero Windows In The number of zero windows that were sent to the device to stop the flow of data over the connection. A device advertises a Zero Window when incoming data is arriving too quickly to be processed. A large number of zero windows in indicates that a peer device was too slow to process the amount of data received.
Zero Windows Out The number of zero windows that were sent from the device to stop the flow of data. A device advertises a Zero Window when incoming data is arriving too quickly to be processed. A large number of zero windows out indicates that the client was too slow to process the amount of data received.
- Network Stalls
-
This chart shows the number of retransmission timeouts that occurred. Retransmission timeouts (RTOs) occur when a network drops too many packets, usually due to packet collisions or buffer exhaustion. If a device sends a request or response and does not receive confirmation within a specified amount of time, the device retransmits the request. If too many retransmissions are unacknowledged, an RTO occurs. If you see a large number of RTOs, the network might be too slow to support the current level of activity.
Metric Definition RTOs In The number of retransmission timeouts (RTOs) caused by network congestion as peers were sending data to the current device. An RTO is a 1-5 second stall in the TCP connection flow due to excessive retransmissions. If you see a large number of RTOs in, the device did not send an acknowledgment to the server quickly enough, or the network might be too slow to support the current level of activity. Depending on the timeout value configured in the operating system, this delay can be anywhere from 1 to 8 seconds.
RTOs Out The number of retransmission timeouts (RTOs) caused by network congestion as the device was sending data to its peers. An RTO is a 1-5 second stall in the TCP connection flow due to excessive retransmissions. If you see a large number of RTOs out, the device did not receive an acknowledgment from the server quickly enough, or the network might be too slow to support the current level of activity. Depending on the timeout value configured in the operating system, this delay can be anywhere from 1 to 8 seconds.
FTP Metric Totals
The following charts are available in this region:
- Total Requests and Responses
- Requests and responses represent the conversation taking place between clients and
servers. If there are more requests than responses, clients might be sending more
requests than the server can handle or the network might be too slow. To identify
whether the issue is with the network or the server, check RTOs and zero windows in the
Network Data
section.
Note: It is unlikely that the total number of FTP requests and responses will be exactly equal, even in a healthy environment. For example, you might be viewing a time period that captures a response to a request that was sent before the start of the time period. In general, the greater the difference between responses and errors, the greater the chance that there is an issue with those transactions. Metric Description Requests The number of FTP requests received on the command connection when the device is acting as an FTP server. Responses The number of responses that the device sent when acting as a FTP server. Errors The number of errors that the device sent when acting as an FTP server. Warnings The number of responses with a status code of 4xx, that the device sent when acting as an FTP server. Data Requests The distribution of sizes (in bytes) of requests that the device received when acting as an FTP server. Data Connects The distribution of sizes (in bytes) of responses that the device sent when acting as an FTP server. - Request and Response Size
- This chart shows the average size of requests and responses.
Metric Description Request Size The distribution of sizes (in bytes) of requests that the device received when acting as a database server. Response Size The distribution of sizes (in bytes) of responses that the device sent when acting as a database server.
FTP client group page
This page displays metric charts of FTP traffic associated with a device group on your network.
- Learn about charts on this page:
- Learn about FTP security considerations
- Learn about working with metrics.
FTP Summary for Group
The following charts are available in this region:
- Transactions
- This chart shows you when FTP errors occurred and how many responses the FTP clients
received. This information can help you see how active the clients were at the time they
received the errors.
In a healthy environment, the number of requests and responses should be roughly equal. For more information, see the Metrics for Group section below.
Metric Description Responses The number of responses that the device received when acting as an FTP client. Errors The number of errors that the device received when acting as an FTP client. - Total Transactions
- This chart shows you how many FTP responses the clients received and how many of those
responses contained errors.
Metric Description Responses The number of responses that the device received when acting as an FTP client. Errors The number of errors that the device received when acting as an FTP client.
FTP Details for Group
The following charts are available in this region:
- Top Group Members (FTP Clients)
- This chart shows which FTP clients in the group were most active by breaking out the total number of FTP requests the group sent by client.
- Top Methods
- This chart shows which FTP methods the group called the most by breaking out the total number of requests the group sent by method.
- Top Status Codes
- This chart shows which FTP status codes the group received the most by breaking out the number of responses returned to the group by status code.
FTP Metrics for Groups
The following charts are available in this region:
- Total Requests and Responses
-
Requests
and responses represent the conversation taking place between clients and servers. If there
are more requests than responses, the clients might be sending more requests than servers
can handle or the network might be too slow.
Note: It is unlikely that the total number of requests and responses will be exactly equal, even in a healthy environment. For example, you might be viewing a time period that captures a response to a request that was sent before the start of the time period. In general, the greater the difference between responses and errors, the greater the chance that there is an issue with those transactions. Metric Description Requests The number of FTP requests sent on the command connection when the device is acting as an FTP client. Responses The number of responses that the device received when acting as an FTP client. Warnings The number of responses with a status code of 4xx, that the device received when acting as an FTP client. Errors The number of errors that the device received when acting as an FTP client. Data Requests The distribution of sizes (in bytes) of requests that the device sent when acting as an FTP client. Data Connects The distribution of sizes (in bytes) of responses that the device received when acting as an FTP client. - Server Processing Time
-
If a client group is acting slow, the server processing time
can help you figure out whether the issue is with the servers. The Server Processing Time
chart shows the median amount of time servers took to process requests from the clients,
measured in milliseconds. High server processing times indicate that the clients are
contacting slow servers.
Metric Description Server Processing Time When the device is acting as an FTP client, the time between the ExtraHop system detecting the last packet of the sent request and the first packet of the received response.
FTP server group page
This page displays metric charts of FTP traffic associated with a device group on your network.
- Learn about charts on this page:
- Learn about FTP security considerations
- Learn about working with metrics.
FTP Summary for Group
The following charts are available in this region:
- Transactions
- This chart shows you when FTP errors occurred and how many FTP responses the servers
sent. This information can help you see how active the servers were at the time they
returned the errors.
In a healthy environment, the number of requests and responses should be roughly equal. For more information, see the Metrics for Group section below.
Metric Description Responses The number of responses that the device sent when acting as a FTP server. Errors The number of errors that the device sent when acting as an FTP server. - Total Transactions
- This chart shows you how many FTP responses servers in the group sent and how many of those
responses contained errors.
Metric Description Responses The number of responses that the device sent when acting as a FTP server. Errors The number of errors that the device sent when acting as an FTP server.
FTP Details for Group
The following charts are available in this region:
- Top Group Members (FTP Servers)
- This chart shows which FTP servers in the group were most active by breaking out the total number of FTP responses the group sent by server.
- Top Methods
- This chart shows which FTP methods were called on servers in the group the most by breaking out the total number of requests the group received by method.
- Top Status Code
- This chart shows which FTP status codes the groups returned the most by breaking out the total number of responses the group sent by status code.
FTP Metrics for Groups
The following charts are available in this region:
- Total Requests and Responses
-
Requests
and responses represent the conversation taking place between clients and servers. If there
are more requests than responses, clients might be sending more requests than the servers
can handle or the network might be too slow.
Note: It is unlikely that the total number of requests and responses will be exactly equal, even in a healthy environment. For example, you might be viewing a time period that captures a response to a request that was sent before the start of the time period. In general, the greater the difference between responses and errors, the greater the chance that there is an issue with those transactions. Metric Description Requests The number of FTP requests received on the command connection when the device is acting as an FTP server. Responses The number of responses that the device sent when acting as a FTP server. Errors The number of errors that the device sent when acting as an FTP server. Warnings The number of responses with a status code of 4xx, that the device sent when acting as an FTP server. Data Requests The distribution of sizes (in bytes) of requests that the device received when acting as an FTP server. Data Connects The distribution of sizes (in bytes) of responses that the device sent when acting as an FTP server. - Server Processing Time
-
The Server Processing Time chart shows the median amount of
time the servers took to process requests from clients, measured in milliseconds. High
server processing times indicate that the servers in a group are slow.
Metric Description Server Processing Time When the device is acting as an FTP server, the time between the ExtraHop system detecting the last packet of the received request and first packet of the sent response.
HL7
The ExtraHop system collects metrics about Health Level-7 (HL7) activity. HL7 is a standard protocol for exchanging electronic health information between software applications.
| Note: | The ExtraHop system does not include any built-in metric pages for HL7. However, you can view HL7 metrics by adding them to a custom page or dashboard. |
HTTP
The ExtraHop system collects metrics about Hypertext Transfer Protocol (HTTP) activity. HTTP is communication protocol for information systems that enables users to deliver data on the World Wide Web. HTTPS activity is decrypted and then displayed as HTTP activity.
Security considerations
- HTTP requests and responses can be injected with malicious scripts in a cross-site scripting (XSS) attack.
- HTTP request smuggling is a web application attack that takes advantage of inconsistencies in how front-end servers (proxies) and back-end servers process requests from more than one sender.
- Malware can disguise command-and-control (C&C) beaconing between a compromised device and an attacker-controlled server as legitimate HTTP traffic.
- Unencrypted HTTP traffic might expose sensitive data to attackers that intercept HTTP traffic.
- Encrypted HTTPS traffic is an increasingly common vector for malicious activity. You can configure the ExtraHop system to decrypt TLS traffic to enable detections that can identify suspicious behaviors and potential attacks.
HTTP application page
This page displays metric charts of HTTP traffic associated with an application container on your network.
- Learn about charts on this page:
- Learn about HTTP security considerations
- Learn about working with metrics.
HTTP Summary
The following charts are available in this region:
- Transactions
- This chart shows you when HTTP errors and responses were associated with the
application. This information can help you see how active the application was at the
time the errors occurred.
In a healthy environment, the number of requests and responses should be roughly equal. For more information, see Requests and Responses.
Metric Description Responses The number of HTTP responses sent by HTTP servers that are associated with the application. An HTTP response can include a status code and the content type. An HTTP/2 server push counts as one response. Errors The number of HTTP response messages with a 500-599 status code, indicating that the server failed to fulfill an apparently valid request. - Total Transactions
- This chart displays the total number of HTTP responses that were associated with the
application and how many of those responses contained errors.
Metric Description Responses The number of HTTP responses sent by HTTP servers that are associated with the application. An HTTP response can include a status code and the content type. An HTTP/2 server push counts as one response. Errors The number of HTTP response messages with a 500-599 status code, indicating that the server failed to fulfill an apparently valid request. - Performance (95th Percentile)
-
This chart shows the 95th percentile of timing metrics,
measured in milliseconds. The transfer and processing time metrics show parts of a
complete transaction. The request transfer time shows how long clients took to transmit
requests onto the network; the server processing time shows how long the servers took to
process requests; and the response transfer time shows how long the servers took to
transmit responses onto the network.
Transfer and processing times are calculated by measuring the time between when the first and last packets of requests and responses are seen by the ExtraHop system, as shown in the following figure:
It can be difficult to tell whether an issue is caused by a network or a device from looking only at transfer and processing times, because these metrics alone provide an incomplete picture. Therefore the round trip time (RTT) metric is also included in this chart. RTT metrics are a good indicator of how your network is performing. If you see high transfer or processing times, but the RTT is low, the issue is probably at the device-level. However, if the RTT, processing, and transfer times are all high, network latency might be affecting the transfer and processing times, and the issue might be with the network.
The RTT metric can help identify the source of the problem because it only measures how long an immediate acknowledgment takes to be sent from the client or server; it does not wait until all packets are delivered.
The ExtraHop system calculates the RTT value by measuring the time between the first packet of a request and the acknowledgment from the server, as shown in the following figure:
The request transfer time might be high because the client took a long time to transmit the request (possibly because the request was very large); however, the transfer time could also be high because the request took a long time to travel on the network (possibly because of network congestion).
Learn more about how the ExtraHop system calculates round trip time on the ExtraHop blog.
Metric Description Request Transfer Time The time between the ExtraHop system detecting the first packet and last packet of HTTP requests. A high number might indicate a large request or network delay. Server Processing Time The time it took for HTTP servers to send the first packet of a response after receiving the last packet of a request. Response Transfer Time The time between the ExtraHop system detecting the first packet and last packet of HTTP responses. A high number might indicate a large response or network delay. Round Trip Time Round trip time (RTT) is a measurement of total network latency. The ExtraHop system calculates RTT by measuring the time it took for HTTP devices to send packets and receive immediate acknowledgments (ACK) over a TCP connection. The Performance (95th percentile) chart shows the highest value for a time period while filtering outliers; the 95th percentile is the highest value that falls below 95% of the values for a sample period. By displaying the 95th value, rather than the true maximum, the chart gives you a more accurate view of the data:
- Performance (95th)
-
This chart shows the 95th percentile of timing
metrics, measured in milliseconds. If an application is acting slow, performance
summary metrics can help you figure out whether the network or servers are causing the
issue. These metrics show the 95th percentile of time that servers took to process
requests from clients versus the 95th percentile time that packets from those requests
(and their respective responses) took to be transmitted across the network. High
server processing times indicate that clients are contacting slow servers. High TCP
round trip times indicate that clients are communicating over slow networks.
Metric Description Server Processing Time The time it took for HTTP servers to send the first packet of a response after receiving the last packet of a request. Round Trip Time Round trip time (RTT) is a measurement of total network latency. The ExtraHop system calculates RTT by measuring the time it took for HTTP devices to send packets and receive immediate acknowledgments (ACK) over a TCP connection.
HTTP Details
The following charts are available in this region:
- Top Methods
- This chart shows which HTTP methods were associated with the application by breaking out the total number of HTTP requests by method.
- Top Error Types
- This chart shows which HTTP status codes the server returned the most by breaking out the total number of responses the application sent by status code.
- Top URIs
- This chart shows which URIs the application accessed the most by breaking out the total number of responses the application received by URI.
HTTP Performance
The following charts are available in this region:
- Server Processing Time Distribution
-
This chart breaks out server processing times in a histogram to
show the most common processing times, measured in milliseconds.
Metric Description Server Processing Time The time it took for HTTP servers to send the first packet of a response after receiving the last packet of a request. - Server Processing Time
-
This chart shows the median processing time for the
application, measured in milliseconds.
Metric Description Server Processing Time The time it took for HTTP servers to send the first packet of a response after receiving the last packet of a request. - Round Trip Time Distribution
-
This chart breaks out round trip times in a histogram to show the
most common round trip times, measured in milliseconds.
Metric Description Round Trip Time Round trip time (RTT) is a measurement of total network latency. The ExtraHop system calculates RTT by measuring the time it took for HTTP devices to send packets and receive immediate acknowledgments (ACK) over a TCP connection. - Round Trip Time
-
This chart shows the median round trip time for the application,
measured in milliseconds.
Metric Description Round Trip Time Round trip time (RTT) is a measurement of total network latency. The ExtraHop system calculates RTT by measuring the time it took for HTTP devices to send packets and receive immediate acknowledgments (ACK) over a TCP connection.
Network Data
This region shows you TCP information that is related to the current protocol. In general, host stalls indicate that there is an issue with either a server or a client, and network stalls indicate that there is an issue with the network.
- Host Stalls
-
This chart shows the number of zero windows that were
associated with an application. Devices control the amount of data they receive by
specifying the number of packets that can be sent to them over a given time period.
When a device is sent more data than it can process, the device advertises a zero
window to ask its peer device to stop sending packets completely until the device
catches up. If you see a large number of zero windows, a server or client might not be
not fast enough to support the amount of data being received.
Metric Definition Request Zero Windows The total number of zero window advertisements sent by HTTP clients while receiving HTTP responses. A device advertises a Zero Window when incoming data is arriving too quickly to be processed. A large number of incoming Zero Windows indicates that a peer device was too slow to process the amount of data received.
Response Zero Windows The total number of zero window advertisements sent by servers while receiving HTTP requests. A device advertises a Zero Window when incoming data is arriving too quickly to be processed. A large number of outgoing Zero Windows indicates that a client was too slow to process the amount of data received.
- Total Host Stalls
- This chart shows the median number of zero window advertisements sent by devices.
- Network Stalls
-
This chart shows the number of retransmission
timeouts that occurred. Retransmission timeouts (RTOs) occur when a network drops too
many packets, usually due to packet collisions or buffer exhaustion. If a device sends
a request or response and does not receive confirmation within a specified amount of
time, the device retransmits the request. If too many retransmissions are
unacknowledged, an RTO occurs. If you see a large number of RTOs, the network might be
too slow to support the current level of activity.
Metric Definition RTOs In The number of retransmission timeouts (RTOs) detected, which are 1-5 second stalls that occur when retransmitted HTTP request packets are not immediately acknowledged (ACK). A high number of RTOs can tell you that network congestion is likely slowing down request transactions. If you see a large number of incoming RTOs, a device did not send an acknowledgment to the server quickly enough, or the network might be too slow to support the current level of activity. Depending on the timeout value configured in the operating system, this delay can be anywhere from 1 to 8 seconds.
RTOs Out The number of retransmission timeouts (RTOs) detected, which are 1-5 second stalls that occur when retransmitted HTTP response packets are not immediately acknowledged (ACK). A high number of RTOs can tell you that network congestion is likely slowing down request transactions. If you see a large number of outgoing RTOs, a device did not receive an acknowledgment from the server quickly enough, or the network might be too slow to support the current level of activity. Depending on the timeout value configured in the operating system, this delay can be anywhere from 1 to 8 seconds.
- Total Network Stalls
-
This chart shows the median number of
retransmission timeouts caused by congestion when clients and servers were sending
requests.
Metric Definition RTOs In The number of retransmission timeouts (RTOs) detected, which are 1-5 second stalls that occur when retransmitted HTTP request packets are not immediately acknowledged (ACK). A high number of RTOs can tell you that network congestion is likely slowing down request transactions. If you see a large number of incoming RTOs, a device did not send an acknowledgment to the server quickly enough, or the network might be too slow to support the current level of activity. Depending on the timeout value configured in the operating system, this delay can be anywhere from 1 to 8 seconds.
RTOs Out The number of retransmission timeouts (RTOs) detected, which are 1-5 second stalls that occur when retransmitted HTTP response packets are not immediately acknowledged (ACK). A high number of RTOs can tell you that network congestion is likely slowing down request transactions. If you see a large number of outgoing RTOs, a device did not receive an acknowledgment from the server quickly enough, or the network might be too slow to support the current level of activity. Depending on the timeout value configured in the operating system, this delay can be anywhere from 1 to 8 seconds.
HTTP Metric Totals
The following charts are available in this region:
- Total Requests and Responses
-
Requests and responses represent the conversation taking place between clients and servers. If there are more requests than responses, clients might be sending more requests than servers can handle or the network might be too slow. To identify whether the issue is with the network or a server, check RTOs and zero windows in the Network Data section.
Note: It is unlikely that the total number of HTTP requests and responses will be exactly equal, even in a healthy environment. For example, you might be viewing a time period that captures a response to a request that was sent before the start of the time period. In general, the greater the difference between responses and errors, the greater the chance that there is an issue with those transactions. Metric Description Requests The number of HTTP requests sent by HTTP clients that are associated with the application. An HTTP request can include a method, a unique resource identifier (URI), and headers containing user information. An HTTP/2 PUSH_PROMISE frame sent by servers counts as one request. Responses The number of HTTP responses sent by HTTP servers that are associated with the application. An HTTP response can include a status code and the content type. An HTTP/2 server push counts as one response. Errors The number of HTTP response messages with a 500-599 status code, indicating that the server failed to fulfill an apparently valid request. Aborted Requests The number of HTTP requests that were not completely transmitted between devices because the connection timed out or the connection was closed with a TCP reset (RST) or FIN. Aborted Responses The number of HTTP responses that were not completely transmitted between devices because the connection timed out or the connection was closed with a TCP reset (RST) or FIN. - HTTP Network Metrics
-
Metric Description Request Zero Windows The total number of zero window advertisements sent by HTTP clients while receiving HTTP responses. A device advertises a Zero Window when incoming data is arriving too quickly to be processed. Response Zero Windows The total number of zero window advertisements sent by servers while receiving HTTP requests. A device advertises a Zero Window when incoming data is arriving too quickly to be processed. Request RTOs The number of retransmission timeouts (RTOs) detected, which are 1-5 second stalls that occur when retransmitted HTTP request packets are not immediately acknowledged (ACK). A high number of RTOs can tell you that network congestion is likely slowing down request transactions. Response RTOs The number of retransmission timeouts (RTOs) detected, which are 1-5 second stalls that occur when retransmitted HTTP response packets are not immediately acknowledged (ACK). A high number of RTOs can tell you that network congestion is likely slowing down request transactions. Request L2 Bytes The number of L2 bytes associated with HTTP requests. Response L2 Bytes The number of L2 bytes associated with HTTP responses. Request Goodput Bytes The number of goodput bytes associated with HTTP requests. Goodput refers to the throughput of the original data transferred and excludes other throughput such as protocol headers or retransmitted packets. Response Goodput Bytes The number of goodput bytes associated with HTTP responses. Goodput refers to the throughput of the original data transferred and excludes other throughput such as protocol headers or retransmitted packets. Request Packets The number of packets associated with HTTP requests. Response Packets The number of packets associated with HTTP responses.
HTTP client page
This page displays metric charts of HTTP traffic associated with a device on your network.
- Learn about charts on this page:
- Learn about HTTP security considerations
- Learn about working with metrics.
HTTP Summary
The following charts are available in this region:
- Transactions
- This chart shows you when HTTP errors occurred and how many responses the HTTP client
received. This information can help you see how active the client was at the time it
received the errors.
If you see a large number of errors, you can drill down to find the specific status code returned in the request and learn why the server was unable to fulfill the request. However, if the number of errors is low, the issue might be more complex, and you should examine the ratio of HTTP requests to HTTP responses. In a healthy environment, the number of requests and responses should be roughly equal. For more information, see Requests and Responses.
Tip: To drill down by status code, click the total number of responses and select Status Code from the menu. All of the status codes associated with that HTTP client appear. 500-level errors indicate server errors. Metric Description Responses The number of responses received by this HTTP client. Errors The number of times this HTTP client received a 500-level response status code, indicating that the responding server might have experienced an internal server error. If the client receives a 400-level status code (indicating that the client request was in someway invalid), the ExtraHop system does not classify the response as an HTTP error. However, if you want to see how many times the client received 400-level status codes, you can drill down on the Top Status Codes chart.
- Total Transactions
- This chart displays the total number of HTTP responses the client received and how
many of those responses contained errors.
Metric Description Responses The number of responses received by this HTTP client. Errors The number of times this HTTP client received a 500-level response status code, indicating that the responding server might have experienced an internal server error. - Performance (95th Percentile)
-
This chart shows the 95th percentile of timing metrics, measured in
milliseconds. The transfer and processing time metrics show parts of a complete
transaction. The request transfer time shows how long the client took to transmit requests
onto the network; the server processing time shows how long servers took to process the
requests; and the response transfer time shows how long servers took to transmit responses
onto the network.
Transfer and processing times are calculated by measuring the time between when the first and last packets of requests and responses are seen by the ExtraHop system, as shown in the following figure:
It can be difficult to tell whether an issue is caused by a network or a device from looking only at transfer and processing times, because these metrics alone provide an incomplete picture. Therefore the round trip time (RTT) metric is also included in this chart. RTT metrics are a good indicator of how your network is performing. If you see high transfer or processing times, but the RTT is low, the issue is probably at the device-level. However, if the RTT, processing, and transfer times are all high, network latency might be affecting the transfer and processing times, and the issue might be with the network.
The RTT metric can help identify the source of the problem because it only measures how long an immediate acknowledgment takes to be sent from the client or server; it does not wait until all packets are delivered.
The ExtraHop system calculates the RTT value by measuring the time between the first packet of a request and the acknowledgment from the server, as shown in the following figure:
The request transfer time might be high because the client took a long time to transmit the request (possibly because the request was very large); however, the transfer time could also be high because the request took a long time to travel on the network (possibly because of network congestion).
Learn more about how the ExtraHop system calculates round trip time on the ExtraHop blog.
Metric Description Request Transfer Time When the device is acting as an HTTP client, the time between the ExtraHop system detecting the first packet and last packet of sent requests. A high number might indicate a large request or network delay. Server Processing Time The time it took for this HTTP client to receive the first packet of a response after it sent the last packet of a request. Response Transfer Time When the device is acting as an HTTP client, the time between the ExtraHop system detecting the first packet and last packet of received responses. A high number might indicate a large response or network delay. Round Trip Time The time between when an HTTP client sent a packet that required an immediate acknowledgment and when the client received the acknowledgment. Round trip time (RTT) is a measurement of network latency. The Performance (95th percentile) chart shows the highest value for a time period while filtering outliers; the 95th percentile is the highest value that falls below 95% of the values for a sample period. By displaying the 95th value, rather than the true maximum, the chart gives you a more accurate view of the data:
- Performance (95th)
-
This chart shows the 95th percentile of timing
metrics, measured in milliseconds. If a client is acting slow, performance summary
metrics can help you figure out whether the network or servers are causing the issue.
These metrics show the 95th percentile amount of time that servers took to process
requests from the client versus the 95th percentile time that packets from those
requests (and their respective responses) took to be transmitted across the network.
High server processing times indicate that the client is contacting slow servers. High
TCP round trip times indicate that the client is communicating over slow
networks.
Metric Description Server Processing Time The time it took for this HTTP client to receive the first packet of a response after it sent the last packet of a request. Round Trip Time The time between when an HTTP client sent a packet that required an immediate acknowledgment and when the client received the acknowledgment. Round trip time (RTT) is a measurement of network latency.
HTTP Details
The following charts are available in this region:
The HTTP details section breaks out transaction information by some of the most popular criteria. For example, you can see which HTTP methods the client called the most.
- Top Methods
- This chart shows which HTTP methods the client called the most by breaking out the total number of requests the client sent by method.
- Top Status Codes
- This chart shows which HTTP status codes the client received the most by breaking out
the number of responses returned to the client by status code.
Tip: You can drill down on this chart by status code. For example, to see only 400-level status codes, click Top Status Codes, select Create chart from, and in the Drill down by Status Code field, enter the following regular expression: (4[0-8][0-9]|49[0-9]) - Top Content Types
- This chart shows which content types the client accessed the most by breaking out the total number of responses returned to the client by content type.
HTTP Performance
The following charts are available in this region:
- Server Processing Time Distribution
-
This chart breaks out server processing times in a histogram to
show the most common processing times, measured in milliseconds.
Metric Description Server processing time The time it took for this HTTP client to receive the first packet of a response after it sent the last packet of a request. - Server Processing Time
- This chart shows the median server processing time for the client, measured in
milliseconds.
Metric Description Server processing time The time it took for this HTTP client to receive the first packet of a response after it sent the last packet of a request. - Round Trip Time Distribution
-
This chart breaks out round trip times in a histogram to show the
most common round trip times, measured in milliseconds.
Metric Description Round Trip Time The time between when an HTTP client sent a packet that required an immediate acknowledgment and when the client received the acknowledgment. Round trip time (RTT) is a measurement of network latency. - Round Trip Time
-
This chart shows the median round trip time for the client, measured in
milliseconds.
Metric Description Round Trip Time The time between when an HTTP client sent a packet that required an immediate acknowledgment and when the client received the acknowledgment. Round trip time (RTT) is a measurement of network latency.
Network Data
This region shows you TCP information that is related to the current protocol. In general, host stalls indicate that there is an issue with either the server or the client, and network stalls indicate that there is an issue with the network.
- Host Stalls
- This chart shows the number of zero windows that were advertised or received by the
device. Devices control the amount of data they receive by specifying the number of
packets that can be sent to them over a given time period. When a device is sent more
data than it can process, the device advertises a zero window to ask its peer device to
stop sending packets completely until the device catches up. If you see a large number
of zero windows, a server or client might not be not fast enough to support the amount
of data being received.
Metric Definition Zero Windows In The number of zero windows that were sent to the device to stop the flow of data over the connection. A device advertises a Zero Window when incoming data is arriving too quickly to be processed. A large number of zero windows in indicates that a peer device was too slow to process the amount of data received.
Zero Windows Out The number of zero windows that were sent from the device to stop the flow of data. A device advertises a Zero Window when incoming data is arriving too quickly to be processed. A large number of zero windows out indicates that the client was too slow to process the amount of data received.
- Network Stalls
-
This chart shows the number of retransmission timeouts that occurred. Retransmission timeouts (RTOs) occur when a network drops too many packets, usually due to packet collisions or buffer exhaustion. If a device sends a request or response and does not receive confirmation within a specified amount of time, the device retransmits the request. If too many retransmissions are unacknowledged, an RTO occurs. If you see a large number of RTOs, the network might be too slow to support the current level of activity.
Metric Definition RTOs In The number of retransmission timeouts (RTOs) caused by network congestion as peers were sending data to the current device. An RTO is a 1-5 second stall in the TCP connection flow due to excessive retransmissions. If you see a large number of RTOs in, the device did not send an acknowledgment to the server quickly enough, or the network might be too slow to support the current level of activity. Depending on the timeout value configured in the operating system, this delay can be anywhere from 1 to 8 seconds.
RTOs Out The number of retransmission timeouts (RTOs) caused by network congestion as the device was sending data to its peers. An RTO is a 1-5 second stall in the TCP connection flow due to excessive retransmissions. If you see a large number of RTOs out, the device did not receive an acknowledgment from the server quickly enough, or the network might be too slow to support the current level of activity. Depending on the timeout value configured in the operating system, this delay can be anywhere from 1 to 8 seconds.
HTTP Metric Totals
The following charts are available in this region:
- Total Requests and Responses
-
Requests and responses represent the conversation taking place between clients and servers. If there are more requests than responses, the client might be sending more requests than servers can handle or the network might be too slow. To identify whether the issue is with the network or the server, check RTOs and zero windows in the Network Data section.
Note: It is unlikely that the total number of HTTP requests and responses will be exactly equal, even in a healthy environment. For example, you might be viewing a time period that captures a response to a request that was sent before the start of the time period. In general, the greater the difference between responses and errors, the greater the chance that there is an issue with those transactions. Metric Definition Requests The number of requests sent by this HTTP client. An HTTP request can include a method, a unique resource identifier (URI), and headers containing user information. An HTTP/2 PUSH_PROMISE frame received by clients counts as one request. Responses The number of responses received by this HTTP client. Errors The number of times this HTTP client received a 500-level response status code, indicating that the responding server might have experienced an internal server error. Aborted Requests The number of requests this HTTP client began to send before the connection abruptly closed. This client was unable to send the complete request because the connection timed out or the connection was closed with a TCP reset (RST) or FIN. Aborted Responses The number of responses this HTTP client began to receive before the connection abruptly closed. This client was unable to receive the complete response because the connection timed out or the connection was closed with a TCP reset (RST) or FIN. Authenticated Responses The number of authenticated responses received when the device is acting as an HTTP client. Pipelined Requests The number of pipelined requests that the device sent when acting as an HTTP client. Pipelined requests consist of multiple requests written to the same connection without waiting for the corresponding responses. Chunked Transfer The number of responses received that used chunked transfer coding when the device is acting as an HTTP client. Compressed Responses The number of responses received that used 'gzip' or 'deflate' content coding when the device is acting as an HTTP client. Request Size Median The distribution of sizes (in bytes) of requests that the device sent when acting as an HTTP client. Size measurements include HTTP payload, but not headers. Response Size Median The distribution of sizes (in bytes) of responses received when the device is acting as an HTTP client. Size measurements include HTTP payload, but not headers. - Average Request and Response Sizes
- Shows the average size of requests and responses.
Metric Description Request Size The distribution of sizes (in bytes) of requests that the device sent when acting as an HTTP client. Size measurements include HTTP payload, but not headers. Response Size The distribution of sizes (in bytes) of responses received when the device is acting as an HTTP client. Size measurements include HTTP payload, but not headers.
HTTP server page
This page displays metric charts of HTTP traffic associated with a device on your network.
- Learn about charts on this page:
- Learn about HTTP security considerations
- Learn about working with metrics.
HTTP Summary
The following charts are available in this region:
- Transactions
- This chart shows you when HTTP errors occurred and how many HTTP responses the server
sent. This information can help you see how active the server was at the time it
returned the errors.
If you see a large number of errors, you can drill down to find the specific status code returned in the request and learn why the server was unable to fulfill the request. However, if the number of errors is low, the issue might be more complex, and you should examine the ratio of HTTP requests to HTTP responses. In a healthy environment, the number of requests and responses should be roughly equal. For more information, see Requests and Responses.
Tip: To drill down by status code, click the total number of responses and select Status Code from the menu. All of the status codes associated with that HTTP server appear. 500-level errors indicate server errors. Metric Description Responses The number of responses sent by this HTTP server. An HTTP response can include a status code and the content type. An HTTP/2 server push counts as one response. Errors The number of times this HTTP server returned a 500-level response status code, indicating a potential internal server error. If the client receives a 400-level status code (indicating that the client's request was in someway invalid), the ExtraHop system does not classify the response as an HTTP error. However, if you want to see how many times the client received 400-level status codes, you can drill down on the Top Status Codes chart.
- Total Transactions
- This chart displays the total number of HTTP responses the server sent and how many of
those responses contained errors.
Metric Description Responses The number of responses sent by this HTTP server. An HTTP response can include a status code and the content type. An HTTP/2 server push counts as one response. Errors The number of times this HTTP server returned a 500-level response status code, indicating a potential internal server error. - Performance (95th Percentile)
-
This chart shows the 95th percentile of timing metrics, measured in
milliseconds. The transfer and processing time metrics show parts of a complete
transaction. The request transfer time shows how long clients took to transmit requests
onto the network; the server processing time shows how long the server took to process
requests; and the response transfer time shows how long the server took to transmit
responses onto the network.
Transfer and processing times are calculated by measuring the time between when the first and last packets of requests and responses are seen by the ExtraHop system, as shown in the following figure:
It can be difficult to tell whether an issue is caused by a network or a device from looking only at transfer and processing times, because these metrics alone provide an incomplete picture. Therefore the round trip time (RTT) metric is also included in this chart. RTT metrics are a good indicator of how your network is performing. If you see high transfer or processing times, but the RTT is low, the issue is probably at the device-level. However, if the RTT, processing, and transfer times are all high, network latency might be affecting the transfer and processing times, and the issue might be with the network.
The RTT metric can help identify the source of the problem because it only measures how long an immediate acknowledgment takes to be sent from the client or server; it does not wait until all packets are delivered.
The ExtraHop system calculates the RTT value by measuring the time between the first packet of a request and the acknowledgment from the server, as shown in the following figure:
The request transfer time might be high because the client took a long time to transmit the request (possibly because the request was very large); however, the transfer time could also be high because the request took a long time to travel on the network (possibly because of network congestion).
Learn more about how the ExtraHop system calculates round trip time on the ExtraHop blog.
Metric Description Request Transfer Time When the device is acting as an HTTP server, the time between the ExtraHop system detecting the first packet and last packet of received requests. A high number might indicate a large request or network delay. Server Processing Time The time it took for this HTTP server to send the first packet of the response after receiving the last packet of the request. Response Transfer Time When the device is acting as an HTTP server, the time between the ExtraHop system detecting the first packet and last packet of sent responses. A high number might indicate a large response or network delay. Round Trip Time The time between when an HTTP server sent a packet that required an immediate acknowledgment and when the server received the acknowledgment. Round trip time (RTT) is a measurement of network latency. The Performance (95th percentile) chart shows the highest value for a time period while filtering outliers; the 95th percentile is the highest value that falls below 95% of the values for a sample period. By displaying the 95th value, rather than the true maximum, the chart gives you a more accurate view of the data:
- Performance (95th)
-
This chart shows the 95th percentile of timing
metrics, measured in milliseconds. If a server is acting slow, performance summary
metrics can help you figure out whether the network or the server is causing the
issue. The performance summary metrics show the 95th percentile amount of time the
server took to process requests from clients versus the 95th percentile time that
packets from those requests (and their respective responses) took to be transmitted
across the network. High server processing times indicate that the server is slow.
High RTTs indicate that the server is communicating over slow networks.
Metric Description Server Processing Time The time it took for this HTTP server to send the first packet of the response after receiving the last packet of the request. Round Trip Time The time between when an HTTP server sent a packet that required an immediate acknowledgment and when the server received the acknowledgment. Round trip time (RTT) is a measurement of network latency.
HTTP Details
The following charts are available in this region:
The HTTP Details section breaks out transaction information by some of the most popular criteria. For example, you can see which HTTP methods have been called the most.
- Top Methods
- This chart shows which HTTP methods were called on the server the most by breaking out the total number of requests the server received by method.
- Top Status Codes
- This chart shows which HTTP status codes the server returned the most by breaking out
the total number of responses the server sent by status code.
Tip: You can drill down on this chart by status code. For example, to see only 400-level status codes, click Top Status Codes, select Create chart from, and in the Drill down by Status Code field, enter the following regular expression: (4[0-8][0-9]|49[0-9]) - Top Content Types
- This chart shows which content types clients accessed on the server the most by breaking out the total number of responses the server sent by content type.
HTTP Performance
The following charts are available in this region:
- Server Processing Time Distribution
-
This chart breaks out server processing times in a histogram to
show the most common processing times, measured in milliseconds.
Metric Description Server processing time The time it took for this HTTP server to send the first packet of the response after receiving the last packet of the request. - Server Processing Time
-
This chart shows the median processing time for the server,
measured in milliseconds.
Metric Description Server processing time The time it took for this HTTP server to send the first packet of the response after receiving the last packet of the request. - Round Trip Time Distribution
-
This chart breaks out round trip times in a histogram to show the
most common round trip times, measured in milliseconds.
Metric Description Round Trip Time The time between when an HTTP server sent a packet that required an immediate acknowledgment and when the server received the acknowledgment. Round trip time (RTT) is a measurement of network latency. - Round Trip Time
-
This chart shows the median round trip time for the client, measured in
milliseconds.
Metric Description Round Trip Time The time between when an HTTP server sent a packet that required an immediate acknowledgment and when the server received the acknowledgment. Round trip time (RTT) is a measurement of network latency.
Network Data
This region shows you TCP information that is related to the current protocol. In general, host stalls indicate that there is an issue with either the server or the client, and network stalls indicate that there is an issue with the network.
- Host Stalls
- This chart shows the number of zero windows that were advertised or received by the
device. Devices control the amount of data they receive by specifying the number of
packets that can be sent to them over a given time period. When a device is sent more
data than it can process, the device advertises a zero window to ask its peer device to
stop sending packets completely until the device catches up. If you see a large number
of zero windows, a server or client might not be not fast enough to support the amount
of data being received.
Metric Definition Zero Windows In The number of zero windows that were sent to the device to stop the flow of data over the connection. A device advertises a Zero Window when incoming data is arriving too quickly to be processed. A large number of zero windows in indicates that a peer device was too slow to process the amount of data received.
Zero Windows Out The number of zero windows that were sent from the device to stop the flow of data. A device advertises a Zero Window when incoming data is arriving too quickly to be processed. A large number of zero windows out indicates that the client was too slow to process the amount of data received.
- Network Stalls
-
This chart shows the number of retransmission timeouts that occurred. Retransmission timeouts (RTOs) occur when a network drops too many packets, usually due to packet collisions or buffer exhaustion. If a device sends a request or response and does not receive confirmation within a specified amount of time, the device retransmits the request. If too many retransmissions are unacknowledged, an RTO occurs. If you see a large number of RTOs, the network might be too slow to support the current level of activity.
Metric Definition RTOs In The number of retransmission timeouts (RTOs) caused by network congestion as peers were sending data to the current device. An RTO is a 1-5 second stall in the TCP connection flow due to excessive retransmissions. If you see a large number of RTOs in, the device did not send an acknowledgment to the server quickly enough, or the network might be too slow to support the current level of activity. Depending on the timeout value configured in the operating system, this delay can be anywhere from 1 to 8 seconds.
RTOs Out The number of retransmission timeouts (RTOs) caused by network congestion as the device was sending data to its peers. An RTO is a 1-5 second stall in the TCP connection flow due to excessive retransmissions. If you see a large number of RTOs out, the device did not receive an acknowledgment from the server quickly enough, or the network might be too slow to support the current level of activity. Depending on the timeout value configured in the operating system, this delay can be anywhere from 1 to 8 seconds.
HTTP Metric Totals
The following charts are available in this region:
- Total Requests and Responses
- Requests and responses represent the conversation taking place between clients and
servers. If there are more requests than responses, clients might be sending more
requests than the server can handle or the network might be too slow. To identify
whether the issue is with the network or the server, check RTOs and zero windows in the
Network Data
section.
Note: It is unlikely that the total number of HTTP requests and responses will be exactly equal, even in a healthy environment. For example, you might be viewing a time period that captures a response to a request that was sent before the start of the time period. In general, the greater the difference between responses and errors, the greater the chance that there is an issue with those transactions. Metric Definition Requests The number of requests received by this HTTP server. An HTTP request can include a method, a unique resource identifier (URI), and headers containing user information. An HTTP/2 PUSH_PROMISE frame sent by servers counts as one request. Responses The number of responses sent by this HTTP server. An HTTP response can include a status code and the content type. An HTTP/2 server push counts as one response. Errors The number of times this HTTP server returned a 500-level response status code, indicating a potential internal server error. Aborted Requests The number of requests this HTTP server began to receive before the connection abruptly closed. This server was unable to receive the complete request because the connection timed out or the connection was closed with a TCP reset (RST) or FIN. Aborted Responses The number of responses this HTTP server began to send before the connection abruptly closed. This server was unable to send the complete response because the connection timed out or the connection was closed with a TCP reset (RST) or FIN. Authenticated Responses The number of authentication responses sent when the device is acting as an HTTP server. Pipelined Requests The number of pipelined requests that the device received when acting as an HTTP server. Pipelined requests consist of multiple requests written to the same connection without waiting for the corresponding responses. Chunked Transfer The number of responses sent that used chunked transfer coding when the device is acting as an HTTP server. Compressed Responses The number of responses sent that used 'gzip' or 'deflate' content coding when the device is acting as an HTTP server. Request Size Median The distribution of sizes (in bytes) of requests that the device received when acting as an HTTP server. Size measurements include HTTP payload, but not headers. Response Size Median The distribution of sizes (in bytes) of responses that the device sent when acting as an HTTP server. Size measurements include HTTP payload, but not headers. - Average Request and Response Sizes
- Shows the average size of requests and responses.
Metric Description Request Size The distribution of sizes (in bytes) of requests that the device received when acting as an HTTP server. Size measurements include HTTP payload, but not headers. Response Size The distribution of sizes (in bytes) of responses that the device sent when acting as an HTTP server. Size measurements include HTTP payload, but not headers.
HTTP client group page
This page displays metric charts of HTTP traffic associated with a device group on your network.
- Learn about charts on this page:
- Learn about HTTP security considerations
- Learn about working with metrics.
HTTP Summary for Group
The following charts are available in this region:
- Transactions
- This chart shows you when HTTP errors occurred and how many responses the HTTP clients
received. This information can help you see how active the clients were at the time they
received the errors.
If you see a large number of errors, you can drill down to find the specific status codes returned in the requests and learn why servers were unable to fulfill the requests. However, if the number of errors is low, the issue might be more complex, and you should examine the ratio of HTTP requests to HTTP responses. In a healthy environment, the number of requests and responses should be roughly equal. For more information, see the Metrics for Group section below.
Tip: To drill down by status code, click the total number of responses and select Status Code from the menu. All of the status codes associated with these HTTP clients appear. 500-level errors indicate server errors. Metric Description Responses The number of responses received by this HTTP client. Errors The number of times this HTTP client received a 500-level response status code, indicating that the responding server might have experienced an internal server error. If the client receives a 400-level status code (indicating that the client's request was in someway invalid), the ExtraHop system does not classify the response as an HTTP error. However, if you want to see how many times the client received 400-level status codes, you can drill down on the Top Status Codes chart.
- Total Transactions
- This chart shows you how many HTTP responses the clients received and how many of
those responses contained errors.
Metric Description Responses The number of responses received by this HTTP client. Errors The number of times this HTTP client received a 500-level response status code, indicating that the responding server might have experienced an internal server error. If the client receives a 400-level status code (indicating that the client's request was in someway invalid), the ExtraHop system does not classify the response as an HTTP error. However, if you want to see how many times the client received 400-level status codes, you can drill down on the Top Status Codes chart.
HTTP Transaction Details for Group
The following charts are available in this region:
- Top Group Members (HTTP Clients)
- This chart shows which HTTP clients in the group were most active by breaking out the total number of HTTP requests the group sent by client.
- Top Methods
- This chart shows which HTTP methods the group called the most by breaking out the total number of requests the group sent by method.
- Top Status Code
- This chart shows which HTTP status codes the group received the most by breaking out the number of responses returned to the group by status code.
HTTP Metrics for Group
The following charts are available in this region:
- Total Requests and Responses
-
Requests
and responses represent the conversation taking place between clients and servers. If there
are more requests than responses, the clients might be sending more requests than servers
can handle or the network might be too slow.
Note: It is unlikely that the total number of requests and responses will be exactly equal, even in a healthy environment. For example, you might be viewing a time period that captures a response to a request that was sent before the start of the time period. In general, the greater the difference between responses and errors, the greater the chance that there is an issue with those transactions. Metric Definition Requests The number of requests sent by this HTTP client. An HTTP request can include a method, a unique resource identifier (URI), and headers containing user information. An HTTP/2 PUSH_PROMISE frame received by clients counts as one request. Responses The number of responses received by this HTTP client. Errors The number of times this HTTP client received a 500-level response status code, indicating that the responding server might have experienced an internal server error. Aborted Requests The number of requests this HTTP client began to send before the connection abruptly closed. This client was unable to send the complete request because the connection timed out or the connection was closed with a TCP reset (RST) or FIN. Aborted Responses The number of responses this HTTP client began to receive before the connection abruptly closed. This client was unable to receive the complete response because the connection timed out or the connection was closed with a TCP reset (RST) or FIN. Authenticated Responses The number of authenticated responses received when the device is acting as an HTTP client. Pipelined Requests The number of pipelined requests that the device sent when acting as an HTTP client. Pipelined requests consist of multiple requests written to the same connection without waiting for the corresponding responses. Chunked Transfer The number of responses received that used chunked transfer coding when the device is acting as an HTTP client. Compressed Responses The number of responses received that used 'gzip' or 'deflate' content coding when the device is acting as an HTTP client. - Server Processing Time
-
If a client group is acting slow, the server processing time
can help you figure out whether the issue is with the servers. The Server Processing Time
chart shows the median amount of time servers took to process requests from the clients,
measured in milliseconds. High server processing times indicate that the clients are
contacting slow servers.
Metric Description Server Processing Time The time it took for this HTTP client to receive the first packet of a response after it sent the last packet of a request.
HTTP server group page
This page displays metric charts of HTTP traffic associated with a device group on your network.
- Learn about charts on this page:
- Learn about HTTP security considerations
- Learn about working with metrics.
HTTP Summary for Group
The following charts are available in this region:
- Total Transactions
- This chart shows you when HTTP errors occurred and how many HTTP responses the servers
sent. This information can help you see how active the servers were at the time they
returned the errors.
If you see a large number of errors, you can drill down to find the specific status code returned in the request and learn why the servers were unable to fulfill the requests. However, if the number of errors is low, the issue might be more complex, and you should examine the ratio of HTTP requests to HTTP responses. In a healthy environment, the number of requests and responses should be roughly equal. For more information, see the Metrics for Group section below.
Tip: To drill down by status code, click the total number of responses and select Status Code from the menu. All of the status codes associated with that HTTP server appear. 500-level errors indicate server errors. Metric Description Responses The number of responses sent by this HTTP server. An HTTP response can include a status code and the content type. An HTTP/2 server push counts as one response. Errors The number of times this HTTP server returned a 500-level response status code, indicating a potential internal server error. If the client receives a 400-level status code (indicating that the client's request was in someway invalid), the ExtraHop system does not classify the response as an HTTP error. However, if you want to see how many times the client received 400-level status codes, you can drill down on the Top Status Codes chart.
- Total Transactions
- This chart shows you how many HTTP responses servers in the group sent and how many of those
responses contained errors.
Metric Description Responses The number of responses sent by this HTTP server. An HTTP response can include a status code and the content type. An HTTP/2 server push counts as one response. Errors The number of times this HTTP server returned a 500-level response status code, indicating a potential internal server error. If the client receives a 400-level status code (indicating that the client's request was in someway invalid), the ExtraHop system does not classify the response as an HTTP error. However, if you want to see how many times the client received 400-level status codes, you can drill down on the Top Status Codes chart.
HTTP Transaction Details for Group
The following charts are available in this region:
- Top Group Members (HTTP Servers)
- This chart shows which HTTP servers in the group were most active by breaking out the total number of HTTP responses the group sent by server.
- Top Methods
- This chart shows which HTTP methods were called on servers in the group the most by breaking out the total number of requests the group received by method.
- Top Status Code
- This chart shows which HTTP status codes the groups returned the most by breaking out the total number of responses the group sent by status code.
HTTP Metrics for Group
The following charts are available in this region:
- Total Requests and Responses
-
Requests
and responses represent the conversation taking place between clients and servers. If there
are more requests than responses, clients might be sending more requests than the servers
can handle or the network might be too slow.
Note: It is unlikely that the total number of requests and responses will be exactly equal, even in a healthy environment. For example, you might be viewing a time period that captures a response to a request that was sent before the start of the time period. In general, the greater the difference between responses and errors, the greater the chance that there is an issue with those transactions. Metric Definition Requests The number of requests received by this HTTP server. An HTTP request can include a method, a unique resource identifier (URI), and headers containing user information. An HTTP/2 PUSH_PROMISE frame sent by servers counts as one request. Responses The number of responses sent by this HTTP server. An HTTP response can include a status code and the content type. An HTTP/2 server push counts as one response. Errors The number of times this HTTP server returned a 500-level response status code, indicating a potential internal server error. Aborted Requests The number of requests this HTTP server began to receive before the connection abruptly closed. This server was unable to receive the complete request because the connection timed out or the connection was closed with a TCP reset (RST) or FIN. Aborted Responses The number of responses this HTTP server began to send before the connection abruptly closed. This server was unable to send the complete response because the connection timed out or the connection was closed with a TCP reset (RST) or FIN. Authenticated Responses The number of authentication responses sent when the device is acting as an HTTP server. Pipelined Requests The number of pipelined requests that the device received when acting as an HTTP server. Pipelined requests consist of multiple requests written to the same connection without waiting for the corresponding responses. Chunked Transfer The number of responses sent that used chunked transfer coding when the device is acting as an HTTP server. Compressed Responses The number of responses sent that used 'gzip' or 'deflate' content coding when the device is acting as an HTTP server. - Server Processing Time
-
The Server Processing Time chart shows the median amount of
time the servers took to process requests from clients, measured in milliseconds. High
server processing times indicate that the servers in a group are slow.
Metric Description Server Processing Time The time it took for this HTTP server to send the first packet of the response after receiving the last packet of the request.
IBMMQ
The ExtraHop system collects metrics about IBM message queue (IBMMQ) activity. IBMMQ is a message-queuing protocol for IBM enterprise and message middleware products.
IBMMQ application page
This page displays metric charts of IBMMQ traffic associated with an application container on your network.
- Learn about charts on this page:
- Learn about working with metrics.
IBMMQ Summary
The following charts are available in this region:
- Transactions
- This chart shows you when IBMMQ errors and responses were associated with the
application. This information can help you see how active the application was at the
time the errors occurred.
In a healthy environment, the number of requests and responses should be roughly equal. For more information, see Requests and Responses.
Metric Description Responses The number of IBMMQ responses. Errors The number of IBMMQ response errors. - Total Transactions
- This chart displays the total number of IBMMQ responses that were associated with the
application and how many of those responses contained errors.
Metric Description Responses The number of IBMMQ responses. Errors The number of IBMMQ response errors. - Request Types
- This chart displays when the application sent IBMMQ GET and PUT requests.
Metric Description GET The number of IBMMQ GET requests sent. GET is used to remove an item from the queue. PUT The number of IBMMQ PUT requests that the device sent. PUT is used to remove an item from the queue. - Request Type Summary
- This chart displays which types of IBMMQ requests the application sent.
Metric Description GET The number of IBMMQ GET requests sent. GET is used to remove an item from the queue. PUT The number of IBMMQ PUT requests that the device sent. PUT is used to remove an item from the queue.
IBMMQ Details
The following charts are available in this region:
- Top Methods
- This chart shows which IBMMQ methods were associated with the application by breaking out the total number of IBMMQ requests by method.
- Top Channels
- This chart shows the top IBMMQ channels by breaking out the total number of IBMMQ responses by channel.
- Top Queues
- This chart shows the top IBMMQ queues by breaking out the total number of IBMMQ requests by queue.
IBMMQ Performance
The following charts are available in this region:
- Round Trip Time Distribution
-
This chart breaks out round trip times in a histogram to show the
most common round trip times, measured in milliseconds.
Metric Description Round Trip Time The time between when an IBMMQ client or server sent a packet requiring immediate acknowledgment and when the acknowledgment was received. - Round Trip Time
-
This chart shows the median round trip time for the application,
measured in milliseconds.
Metric Description Round Trip Time The time between when an IBMMQ client or server sent a packet requiring immediate acknowledgment and when the acknowledgment was received.
IBMMQ Network Data
This region shows you TCP information that is related to the current protocol. In general, host stalls indicate that there is an issue with either a server or a client, and network stalls indicate that there is an issue with the network.
- Host Stalls
-
This chart shows the number of zero windows that were
associated with an application. Devices control the amount of data they receive by
specifying the number of packets that can be sent to them over a given time period.
When a device is sent more data than it can process, the device advertises a zero
window to ask its peer device to stop sending packets completely until the device
catches up. If you see a large number of zero windows, a server or client might not be
not fast enough to support the amount of data being received.
Metric Definition Request Zero Windows The number of zero window advertisements sent by IBMMQ clients. A device advertises a Zero Window when incoming data is arriving too quickly to be processed. A large number of incoming Zero Windows indicates that a peer device was too slow to process the amount of data received.
Response Zero Windows The number of zero window advertisements sent by servers while receiving IBMMQ requests. A device advertises a Zero Window when incoming data is arriving too quickly to be processed. A large number of outgoing Zero Windows indicates that a client was too slow to process the amount of data received.
- Total Host Stalls
- This chart shows the median number of zero window advertisements sent by devices.
- Network Stalls
-
This chart shows the number of retransmission
timeouts that occurred. Retransmission timeouts (RTOs) occur when a network drops too
many packets, usually due to packet collisions or buffer exhaustion. If a device sends
a request or response and does not receive confirmation within a specified amount of
time, the device retransmits the request. If too many retransmissions are
unacknowledged, an RTO occurs. If you see a large number of RTOs, the network might be
too slow to support the current level of activity.
Metric Definition RTOs In The number of retransmission timeouts caused by congestion when clients were sending IBMMQ requests. An RTO is a 1-5 second stall in the TCP connection flow due to excessive retransmissions. If you see a large number of incoming RTOs, a device did not send an acknowledgment to the server quickly enough, or the network might be too slow to support the current level of activity. Depending on the timeout value configured in the operating system, this delay can be anywhere from 1 to 8 seconds.
RTOs Out The number of retransmission timeouts caused by congestion when servers were sending IBMMQ responses. An RTO is a 1-5 second stall in the TCP connection flow due to excessive retransmissions. If you see a large number of outgoing RTOs, a device did not receive an acknowledgment from the server quickly enough, or the network might be too slow to support the current level of activity. Depending on the timeout value configured in the operating system, this delay can be anywhere from 1 to 8 seconds.
- Total Network Stalls
-
This chart shows the median number of
retransmission timeouts caused by congestion when clients and servers were sending
requests.
Metric Definition RTOs In The number of retransmission timeouts caused by congestion when clients were sending IBMMQ requests. An RTO is a 1-5 second stall in the TCP connection flow due to excessive retransmissions. If you see a large number of incoming RTOs, a device did not send an acknowledgment to the server quickly enough, or the network might be too slow to support the current level of activity. Depending on the timeout value configured in the operating system, this delay can be anywhere from 1 to 8 seconds.
RTOs Out The number of retransmission timeouts caused by congestion when servers were sending IBMMQ responses. An RTO is a 1-5 second stall in the TCP connection flow due to excessive retransmissions. If you see a large number of outgoing RTOs, a device did not receive an acknowledgment from the server quickly enough, or the network might be too slow to support the current level of activity. Depending on the timeout value configured in the operating system, this delay can be anywhere from 1 to 8 seconds.
IBMMQ Metric Totals
The following charts are available in this region:
- Total Requests and Responses
-
Requests and responses represent the conversation taking place between clients and servers. If there are more requests than responses, clients might be sending more requests than servers can handle or the network might be too slow. To identify whether the issue is with the network or a server, check RTOs and zero windows in the Network Data section.
Note: It is unlikely that the total number of IBMMQ requests and responses will be exactly equal, even in a healthy environment. For example, you might be viewing a time period that captures a response to a request that was sent before the start of the time period. In general, the greater the difference between responses and errors, the greater the chance that there is an issue with those transactions. Metric Description Requests The number of IBMMQ requests. Responses The number of IBMMQ responses. Errors The number of IBMMQ response errors. Warnings The number of IBMMQ warning responses received. GETs The number of IBMMQ GET requests sent. GET is used to remove an item from the queue. PUTs The number of IBMMQ PUT requests that the device sent. PUT is used to remove an item from the queue. Server Messages The number of IBMMQ server messages transferred. Client Messages The number of IBMMQ client messages sent or received. Server-to-Server-Messages The number of IBMMQ server-to-server message types transferred. Client-to-Server-Messages The number of IBMMQ client-to-server message types transmitted. - IBMMQ Network Metrics
-
Metric Description Request Zero Windows The number of zero window advertisements sent by IBMMQ clients. A device advertises a Zero Window when incoming data is arriving too quickly to be processed. Response Zero Windows The number of zero window advertisements sent by servers while receiving IBMMQ requests. A device advertises a Zero Window when incoming data is arriving too quickly to be processed. RTOs In The number of retransmission timeouts caused by congestion when clients were sending IBMMQ requests. An RTO is a 1-5 second stall in the TCP connection flow due to excessive retransmissions. RTOs Out The number of retransmission timeouts caused by congestion when servers were sending IBMMQ responses. An RTO is a 1-5 second stall in the TCP connection flow due to excessive retransmissions. Request L2 Bytes The number of L2 bytes associated with IBMMQ requests. Response L2 Bytes The number of L2 bytes associated with IBMMQ responses. Request Goodput Bytes The number of goodput bytes associated with IBMMQ requests. Goodput refers to the throughput of the original data transferred and excludes other throughput such as protocol headers or retransmitted packets. Response Goodput Bytes The number of goodput bytes associated with IBMMQ responses. Goodput refers to the throughput of the original data transferred and excludes other throughput such as protocol headers or retransmitted packets. Request Packets The number of packets associated with IBMMQ requests. Response Packets The number of packets associated with IBMMQ responses.
IBMMQ client page
This page displays metric charts of IBMMQ traffic associated with a device on your network.
- Learn about charts on this page:
- Learn about working with metrics.
IBMMQ Summary
The following charts are available in this region:
- Transactions
- This chart shows you when IBMMQ errors occurred and how many responses the IBMMQ
client received. This information can help you see how active the client was at the time
it received the errors.
In a healthy environment, the number of requests and responses should be roughly equal. For more information, see Requests and Responses.
Metric Description Responses The number of responses that the device received when acting as an IBM MQ client. Errors When the device is acting as an IBM MQ client, the count of messages sent or received having a completion code of Error, broken down by specific reason code. - Total Transactions
- This chart displays the total number of IBMMQ responses the client received and how
many of those responses contained warnings and errors.
Metric Description Responses The number of responses that the device received when acting as an IBM MQ client. Errors When the device is acting as an IBM MQ client, the count of messages sent or received having a completion code of Error, broken down by specific reason code. Warnings The list of messages sent or received having a completion code of Warning when the device is acting as an IBM MQ client. - Request Types
- This chart displays when the client sent IBMMQ GET and PUT requests.
Metric Description GET The number of GET requests that the device sent when acting as an IBM MQ client. GET is used to remove an item from the queue. PUT The number of PUT requests that the device sent when acting as an IBM MQ client. PUT is used to remove an item from the queue. - Total Request Types
- This chart displays which types of IBMMQ requests the client sent.
Metric Description GET The number of GET requests that the device sent when acting as an IBM MQ client. GET is used to remove an item from the queue. PUT The number of PUT requests that the device sent when acting as an IBM MQ client. PUT is used to remove an item from the queue.
IBMMQ Details
The following charts are available in this region:
- Top Methods
- This chart shows which IBMMQ methods the client called the most by breaking out the total number of requests the client sent by method.
- Top Message Formats
- This chart shows which IBMMQ message formats the client received the most by breaking out the number of responses returned to the client by message format.
- Top Queues
- This chart shows where most of the client messages are stored by breaking out the number of responses the client returned by queue.
IBMMQ Performance
The following charts are available in this region:
- Round Trip Time
-
This chart shows the median round trip time for the client, measured in
milliseconds.
Metric Description Round Trip Time The time between when an IBMMQ client sent a packet that required an immediate acknowledgment and when the client received the acknowledgment. Round trip time (RTT) is a measurement of network latency. - Round Trip Time Distribution
-
This chart breaks out round trip times in a histogram to show the
most common round trip times, measured in milliseconds.
Metric Description Round Trip Time The time between when an IBMMQ client sent a packet that required an immediate acknowledgment and when the client received the acknowledgment. Round trip time (RTT) is a measurement of network latency.
Network Data
This region shows you TCP information that is related to the current protocol. In general, host stalls indicate that there is an issue with either the server or the client, and network stalls indicate that there is an issue with the network.
- Host Stalls
- This chart shows the number of zero windows that were advertised or received by the
device. Devices control the amount of data they receive by specifying the number of
packets that can be sent to them over a given time period. When a device is sent more
data than it can process, the device advertises a zero window to ask its peer device to
stop sending packets completely until the device catches up. If you see a large number
of zero windows, a server or client might not be not fast enough to support the amount
of data being received.
Metric Definition Zero Windows In The number of zero windows that were sent to the device to stop the flow of data over the connection. A device advertises a Zero Window when incoming data is arriving too quickly to be processed. A large number of zero windows in indicates that a peer device was too slow to process the amount of data received.
Zero Windows Out The number of zero windows that were sent from the device to stop the flow of data. A device advertises a Zero Window when incoming data is arriving too quickly to be processed. A large number of zero windows out indicates that the client was too slow to process the amount of data received.
- Network Stalls
-
This chart shows the number of retransmission timeouts that occurred. Retransmission timeouts (RTOs) occur when a network drops too many packets, usually due to packet collisions or buffer exhaustion. If a device sends a request or response and does not receive confirmation within a specified amount of time, the device retransmits the request. If too many retransmissions are unacknowledged, an RTO occurs. If you see a large number of RTOs, the network might be too slow to support the current level of activity.
Metric Definition RTOs In The number of retransmission timeouts (RTOs) caused by network congestion as peers were sending data to the current device. An RTO is a 1-5 second stall in the TCP connection flow due to excessive retransmissions. If you see a large number of RTOs in, the device did not send an acknowledgment to the server quickly enough, or the network might be too slow to support the current level of activity. Depending on the timeout value configured in the operating system, this delay can be anywhere from 1 to 8 seconds.
RTOs Out The number of retransmission timeouts (RTOs) caused by network congestion as the device was sending data to its peers. An RTO is a 1-5 second stall in the TCP connection flow due to excessive retransmissions. If you see a large number of RTOs out, the device did not receive an acknowledgment from the server quickly enough, or the network might be too slow to support the current level of activity. Depending on the timeout value configured in the operating system, this delay can be anywhere from 1 to 8 seconds.
IBMMQ Metric Totals
The following charts are available in this region:
- Total Requests and Responses
- Requests and responses represent the conversation taking place between clients and
servers. If there are more requests than responses, the client might be sending more
requests than the servers can handle or the network might be too slow. To identify
whether the issue is with the network or the server, check RTOs and zero windows in the
Network Data
section.
Note: It is unlikely that the total number of IBMMQ requests and responses will be exactly equal, even in a healthy environment. For example, you might be viewing a time period that captures a response to a request that was sent before the start of the time period. In general, the greater the difference between responses and errors, the greater the chance that there is an issue with those transactions. Metric Description Requests The number of requests that the device sent when acting as an IBM MQ client. Responses The number of responses that the device received when acting as an IBM MQ client. Errors When the device is acting as an IBM MQ client, the count of messages sent or received having a completion code of Error, broken down by specific reason code. Warnings The list of messages sent or received having a completion code of Warning when the device is acting as an IBM MQ client. PCF Requests When the device is acting as an IBM MQ client, the number of PCF requests sent. Programmable command formats (PCFs) provide a way to manipulate queue manager objects, such as queues, namelists, and channels. PCF Responses When the device is acting as an IBM MQ client, the number of PCF responses. Programmable command formats (PCFs) provide a way to manipulate queue manager objects, such as queues, namelists, and channels. PCF Warnings When the device is acting as an IBM MQ client, the number of responses received indicating a PCF warning, broken down by specific warning message. Programmable command formats (PCFs) provide a way to manipulate queue manager objects, such as queues, namelists, and channels. PCF Errors The number of responses indicating a PCF error, that the device received when acting as an IBM MQ client. GETs The number of GET requests that the device sent when acting as an IBM MQ client. GET is used to remove an item from the queue. PUTs The number of PUT requests that the device sent when acting as an IBM MQ client. PUT is used to remove an item from the queue. Server-to-Server Messages The number of server-to-server message types transmitted when the device is acting as an IBM MQ client. Client-to-Server Messages The number of client-to-server message types transmitted when the device is acting as an IBM MQ client. - Request and Response Size
- This chart displays which types of IBMMQ requests the client sent.
Metric Description Request Size The distribution of sizes (in bytes) of requests that the device sent when acting as an IBM MQ client. Response Size The distribution of sizes (in bytes) of responses that the device received when acting as an IBM MQ client.
IBMMQ server page
This page displays metric charts of IBMMQ traffic associated with a device on your network.
- Learn about charts on this page:
- Learn about working with metrics.
IBMMQ Summary
The following charts are available in this region:
- Transactions
- This chart shows you when IBMMQ errors occurred and how many IBMMQ responses the
server sent. This information can help you see how active the server was at the time it
returned the errors.
In a healthy environment, the number of requests and responses should be roughly equal. For more information, see Requests and Responses.
Metric Description Responses The number of responses that the device sent when acting as an IBM MQ server. Errors When the device is acting as an IBM MQ server, the count of messages sent or received having a completion code of Error, broken down by specific reason code. - Total Transactions
-
This chart displays the total number of IBMMQ responses the server sent and how many of those responses contained warnings and errors.
Metric Description Responses The number of responses that the device sent when acting as an IBM MQ server. Errors When the device is acting as an IBM MQ server, the count of messages sent or received having a completion code of Error, broken down by specific reason code. Warnings The list of messages with a completion code of Warning, that the device sent or received when acting as an IBM MQ server. - Request Types
- This chart displays when the server received IBMMQ GET and PUT requests.
Metric Description GET The number of GET requests that the device received when acting as an IBM MQ server. GET is used to remove an item from the queue. PUT The number of PUT requests that the device received when acting as an IBM MQ server. PUT is used to remove an item from the queue. - Total Request Types
- This chart displays which types of IBMMQ requests the server received.
Metric Description GET The number of GET requests that the device received when acting as an IBM MQ server. GET is used to remove an item from the queue. PUT The number of PUT requests that the device received when acting as an IBM MQ server. PUT is used to remove an item from the queue.
IBMMQ Details
The following charts are available in this region:
- Top Methods
- This chart shows which IBMMQ methods were called on the server the most by breaking out the total number of requests the server received by method.
- Top Message Formats
- This chart shows which IBMMQ message formats the server sent the most by breaking out the number of responses returned by the server by message format.
- Top Queues
- This chart shows which queues are most active on the server by breaking out the number of responses the server returned by queue.
IBMMQ Performance
The following charts are available in this region:
- Round Trip Time
-
This chart shows the median round trip time for the server, measured in
milliseconds.
Metric Description Round Trip Time The time between when an IBMMQ server sent a packet that required an immediate acknowledgment and when the server received the acknowledgment. Round trip time (RTT) is a measurement of network latency. - Round Trip Time Distribution
-
This chart breaks out round trip times in a histogram to show the
most common round trip times, measured in milliseconds.
Metric Description Round Trip Time The time between when an IBMMQ server sent a packet that required an immediate acknowledgment and when the server received the acknowledgment. Round trip time (RTT) is a measurement of network latency.
Network Data
This region shows you TCP information that is related to the current protocol. In general, host stalls indicate that there is an issue with either the server or the client, and network stalls indicate that there is an issue with the network.
- Host Stalls
- This chart shows the number of zero windows that were advertised or received by the
device. Devices control the amount of data they receive by specifying the number of
packets that can be sent to them over a given time period. When a device is sent more
data than it can process, the device advertises a zero window to ask its peer device to
stop sending packets completely until the device catches up. If you see a large number
of zero windows, a server or client might not be not fast enough to support the amount
of data being received.
Metric Definition Zero Windows In The number of zero windows that were sent to the device to stop the flow of data over the connection. A device advertises a Zero Window when incoming data is arriving too quickly to be processed. A large number of zero windows in indicates that a peer device was too slow to process the amount of data received.
Zero Windows Out The number of zero windows that were sent from the device to stop the flow of data. A device advertises a Zero Window when incoming data is arriving too quickly to be processed. A large number of zero windows out indicates that the client was too slow to process the amount of data received.
- Network Stalls
-
This chart shows the number of retransmission timeouts that occurred. Retransmission timeouts (RTOs) occur when a network drops too many packets, usually due to packet collisions or buffer exhaustion. If a device sends a request or response and does not receive confirmation within a specified amount of time, the device retransmits the request. If too many retransmissions are unacknowledged, an RTO occurs. If you see a large number of RTOs, the network might be too slow to support the current level of activity.
Metric Definition RTOs In The number of retransmission timeouts (RTOs) caused by network congestion as peers were sending data to the current device. An RTO is a 1-5 second stall in the TCP connection flow due to excessive retransmissions. If you see a large number of RTOs in, the device did not send an acknowledgment to the server quickly enough, or the network might be too slow to support the current level of activity. Depending on the timeout value configured in the operating system, this delay can be anywhere from 1 to 8 seconds.
RTOs Out The number of retransmission timeouts (RTOs) caused by network congestion as the device was sending data to its peers. An RTO is a 1-5 second stall in the TCP connection flow due to excessive retransmissions. If you see a large number of RTOs out, the device did not receive an acknowledgment from the server quickly enough, or the network might be too slow to support the current level of activity. Depending on the timeout value configured in the operating system, this delay can be anywhere from 1 to 8 seconds.
IBMMQ Metric Totals
The following charts are available in this region:
- Total Requests and Responses
- Requests and responses represent the conversation taking place between clients and
servers. If there are more requests than responses, the client might be sending more
requests than the servers can handle or the network might be too slow. To identify
whether the issue is with the network or the server, check RTOs and zero windows in the
Network Data
section.
Note: It is unlikely that the total number of IBMMQ requests and responses will be exactly equal, even in a healthy environment. For example, you might be viewing a time period that captures a response to a request that was sent before the start of the time period. In general, the greater the difference between responses and errors, the greater the chance that there is an issue with those transactions. Metric Description Requests The number of requests that the device received when acting as an IBM MQ server. Responses The number of responses that the device sent when acting as an IBM MQ server. Errors When the device is acting as an IBM MQ server, the count of messages sent or received having a completion code of Error, broken down by specific reason code. Warnings The list of messages with a completion code of Warning, that the device sent or received when acting as an IBM MQ server. PCF Requests When the device is acting as an IBM MQ server, the number of PCF requests received. Programmable command formats (PCFs) provide a way to manipulate queue manager objects, such as queues, namelists, and channels. PCF Responses When the device is acting as an IBM MQ server, the number of PCF responses. Programmable command formats (PCFs) provide a way to manipulate queue manager objects, such as queues, namelists, and channels. PCF Warnings When the device is acting as an IBM MQ server, the number of responses sent indicating a PCF warning, broken down by specific warning message. Programmable command formats (PCFs) provide a way to manipulate queue manager objects, such as queues, namelists, and channels. PCF Errors The number of responses that the device sent indicating a PCF error when acting as an IBM MQ server. GETs The number of GET requests that the device received when acting as an IBM MQ server. GET is used to remove an item from the queue. PUTs The number of PUT requests that the device received when acting as an IBM MQ server. PUT is used to remove an item from the queue. Client Messages The number of server-to-server message types transmitted when the device is acting as an IBM MQ server. Client-to-Server Messages The number of client-to-server message types transmitted when the device is acting as an IBM MQ server. - Request and Response Size
- This chart displays which types of IBMMQ requests the client sent.
Metric Description Request Size The distribution of sizes (in bytes) of requests that the device received when acting as an IBM MQ server. Response Size The distribution of sizes (in bytes) of responses that the device sent when acting as an IBM MQ server.
IBMMQ client group page
This page displays metric charts of IBMMQ traffic associated with a device group on your network.
- Learn about charts on this page:
- Learn about working with metrics.
IBMMQ Summary for Group
The following charts are available in this region:
- Transactions
- This chart shows you when IBMMQ errors occurred and how many responses the IBMMQ
clients received. This information can help you see how active the clients were at the
time they received the errors.
In a healthy environment, the number of requests and responses should be roughly equal.
Metric Description Responses The number of responses that the device received when acting as an IBM MQ client. Errors When the device is acting as an IBM MQ client, the count of messages sent or received having a completion code of Error, broken down by specific reason code. - Total Transactions
- This chart shows you how many IBMMQ responses the clients received and how many of
those responses contained errors.
Metric Description Responses The number of responses that the device received when acting as an IBM MQ client. Errors When the device is acting as an IBM MQ client, the count of messages sent or received having a completion code of Error, broken down by specific reason code.
IBMMQ Details for Group
The following charts are available in this region:
- Top IBMMQ Members (IBMMQ Clients)
- This chart shows which IBMMQ clients in the group were most active by breaking out the total number of IBMMQ requests the group sent by client.
- Top Methods
- This chart shows which IBMMQ methods the group called the most by breaking out the total number of requests the group sent by method.
- Top Message Formats
- This chart shows which IBMMQ message formats the group received the most by breaking out the number of responses returned to the group by message format.
IBMMQ Metrics for Group
The following charts are available in this region:
- Total Requests and Responses
-
Requests
and responses represent the conversation taking place between clients and servers. If there
are more requests than responses, the clients might be sending more requests than servers
can handle or the network might be too slow.
Note: It is unlikely that the total number of requests and responses will be exactly equal, even in a healthy environment. For example, you might be viewing a time period that captures a response to a request that was sent before the start of the time period. In general, the greater the difference between responses and errors, the greater the chance that there is an issue with those transactions. Metric Description Requests The number of requests that the device sent when acting as an IBM MQ client. Responses The number of responses that the device received when acting as an IBM MQ client. Errors When the device is acting as an IBM MQ client, the count of messages sent or received having a completion code of Error, broken down by specific reason code. Warnings The list of messages sent or received having a completion code of Warning when the device is acting as an IBM MQ client. PCF Requests When the device is acting as an IBM MQ client, the number of PCF requests sent. Programmable command formats (PCFs) provide a way to manipulate queue manager objects, such as queues, namelists, and channels. PCF Responses When the device is acting as an IBM MQ client, the number of PCF responses. Programmable command formats (PCFs) provide a way to manipulate queue manager objects, such as queues, namelists, and channels. PCF Warnings When the device is acting as an IBM MQ client, the number of responses received indicating a PCF warning, broken down by specific warning message. Programmable command formats (PCFs) provide a way to manipulate queue manager objects, such as queues, namelists, and channels. PCF Errors The number of responses indicating a PCF error, that the device received when acting as an IBM MQ client. Client Messages The number of client messages that the device sent or received while acting as an IBM MQ server. Client-to-Server Messages The number of client-to-server message types transmitted when the device is acting as an IBM MQ client.
IBMMQ server group page
This page displays metric charts of IBMMQ traffic associated with a device group on your network.
- Learn about charts on this page:
- Learn about working with metrics.
IBMMQ Summary for Group
The following charts are available in this region:
- Transactions
- This chart shows you when IBMMQ errors occurred and how many IBMMQ responses the
servers sent. This information can help you see how active the servers were at the time
they returned the errors.
In a healthy environment, the number of requests and responses should be roughly equal.
Metric Description Responses The number of responses that the device sent when acting as an IBM MQ server. Errors When the device is acting as an IBM MQ server, the count of messages sent or received having a completion code of Error, broken down by specific reason code. - Total Transactions
- This chart shows you how many IBMMQ responses servers in the group sent and how many of those
responses contained errors.
Metric Description Responses The number of responses that the device sent when acting as an IBM MQ server. Errors When the device is acting as an IBM MQ server, the count of messages sent or received having a completion code of Error, broken down by specific reason code.
IBMMQ Details for Group
The following charts are available in this region:
- Top Group Members (IBMMQ Servers)
- This chart shows which IBMMQ servers in the group were most active by breaking out the total number of IBMMQ responses the group sent by server.
- Top Methods
- This chart shows which IBMMQ methods were called on servers in the group the most by breaking out the total number of requests the group received by method.
- Top Message Formats
- This chart shows which IBMMQ message formats the group sent the most by breaking out the number of responses returned by the group by message format.
IBMMQ Metrics for Group
The following charts are available in this region:
- Total Requests and Responses
-
Requests
and responses represent the conversation taking place between clients and servers. If there
are more requests than responses, clients might be sending more requests than the servers
can handle or the network might be too slow.
Note: It is unlikely that the total number of requests and responses will be exactly equal, even in a healthy environment. For example, you might be viewing a time period that captures a response to a request that was sent before the start of the time period. In general, the greater the difference between responses and errors, the greater the chance that there is an issue with those transactions. Metric Description Requests The number of requests that the device received when acting as an IBM MQ server. Responses The number of responses that the device sent when acting as an IBM MQ server. Errors When the device is acting as an IBM MQ server, the count of messages sent or received having a completion code of Error, broken down by specific reason code. Warnings The list of messages with a completion code of Warning, that the device sent or received when acting as an IBM MQ server. PCF Requests When the device is acting as an IBM MQ server, the number of PCF requests received. Programmable command formats (PCFs) provide a way to manipulate queue manager objects, such as queues, namelists, and channels. PCF Responses When the device is acting as an IBM MQ server, the number of PCF responses. Programmable command formats (PCFs) provide a way to manipulate queue manager objects, such as queues, namelists, and channels. PCF Warnings When the device is acting as an IBM MQ server, the number of responses sent indicating a PCF warning, broken down by specific warning message. Programmable command formats (PCFs) provide a way to manipulate queue manager objects, such as queues, namelists, and channels. PCF Errors The number of responses that the device sent indicating a PCF error when acting as an IBM MQ server. Client Messages The number of server-to-server message types transmitted when the device is acting as an IBM MQ server. Client-to-Server Messages The number of client-to-server message types transmitted when the device is acting as an IBM MQ server.
ICA
The ExtraHop system collects metrics about Independent Computing Architecture (ICA) activity. ICA is a Citrix system protocol that transmits data between clients and servers.
ICA application page
This page displays metric charts of ICA traffic associated with an application container on your network.
- Learn about charts on this page:
- Learn about working with metrics.
ICA Summary
The following charts are available in this region:
- Sessions
- This chart displays when the application launched and aborted Citrix ICA
sessions.
Metric Description Launches The number of Citrix ICA sessions that were launched. This count includes encrypted sessions. Aborts The number of Citrix ICA sessions that were initiated but closed before a Citrix application was fully loaded. - Session Summary
- This chart displays how many Citrix ICA sessions the application launched and
aborted.
Metric Description Launches The number of Citrix ICA sessions that were launched. This count includes encrypted sessions. Aborts The number of Citrix ICA sessions that were initiated but closed before a Citrix application was fully loaded. - Performance (95th Percentile)
- This chart shows the 95th percentile of timing metrics, measured in milliseconds.
Metric Description Login Time The time between a Citrix ICA client sending credentials to the Citrix ICA server and receiving the authentication response. Load Time The amount of time from the beginning of the flow until the ExtraHop system detects traffic on one of the following virtual channels: Clipboard, Citrix Windows Multimedia Redirection, Citrix Control Virtual Channel, or Zero Latency Font and Keyboard. Client Latency The time, measured and reported by the Citrix ICA client, between when a user initiates an action in a Citrix application and when the result appears on the screen. Network Latency The network latency, measured and reported by both Citrix ICA clients and Citrix ICA servers.Network latency is a Citrix measurement. A large value should be investigated. - Performance Summary (95th Percentile)
- This chart shows the 95th percentile of timing metrics, measured in milliseconds.
Metric Description Login Time The time between a Citrix ICA client sending credentials to the Citrix ICA server and receiving the authentication response. Load Time The amount of time from the beginning of the flow until the ExtraHop system detects traffic on one of the following virtual channels: Clipboard, Citrix Windows Multimedia Redirection, Citrix Control Virtual Channel, or Zero Latency Font and Keyboard. Client Latency The time, measured and reported by the Citrix ICA client, between when a user initiates an action in a Citrix application and when the result appears on the screen. Network Latency The network latency, measured and reported by both Citrix ICA clients and Citrix ICA servers.Network latency is a Citrix measurement. A large value should be investigated. The Performance (95th percentile) chart shows the highest value for a time period while filtering outliers; the 95th percentile is the highest value that falls below 95% of the values for a sample period. By displaying the 95th value, rather than the true maximum, the chart gives you a more accurate view of the data:
ICA Performance
The following charts are available in this region:
- Login Time Distribution
- This chart breaks out login times in a histogram, measured in milliseconds.
Metric Description Login Time The time between a Citrix ICA client sending credentials to the Citrix ICA server and receiving the authentication response. - Login Time
- This chart shows the median login time for the application, measured in
milliseconds.
Metric Description Login Time The time between a Citrix ICA client sending credentials to the Citrix ICA server and receiving the authentication response. - Load Time Distribution
- This chart breaks out load times in a histogram, measured in milliseconds.
Metric Description Load Time The amount of time from the beginning of the flow until the ExtraHop system detects traffic on one of the following virtual channels: Clipboard, Citrix Windows Multimedia Redirection, Citrix Control Virtual Channel, or Zero Latency Font and Keyboard. - Load Time
- This chart shows the median load time for the application, measured in
milliseconds.
Metric Description Load Time The amount of time from the beginning of the flow until the ExtraHop system detects traffic on one of the following virtual channels: Clipboard, Citrix Windows Multimedia Redirection, Citrix Control Virtual Channel, or Zero Latency Font and Keyboard. - Client Latency Distribution
- This chart breaks out client latency in a histogram, measured in milliseconds.
Metric Description Client Latency The time, measured and reported by the Citrix ICA client, between when a user initiates an action in a Citrix application and when the result appears on the screen. - Client Latency
- This chart shows the median load client latency, measured in milliseconds.
Metric Description Client Latency The time, measured and reported by the Citrix ICA client, between when a user initiates an action in a Citrix application and when the result appears on the screen. - Network Latency Distribution
- This chart breaks out network latency in a histogram, measured in milliseconds.
Metric Description Network Latency The network latency, measured and reported by both Citrix ICA clients and Citrix ICA servers.Network latency is a Citrix measurement. A large value should be investigated. - Network Latency
- This chart shows the median network latency for the application, measured in
milliseconds.
Metric Description Network Latency The network latency, measured and reported by both Citrix ICA clients and Citrix ICA servers.Network latency is a Citrix measurement. A large value should be investigated.
Launch Details
The following charts are available in this region:
- Top Users
- This chart shows which users launched the most sessions by breaking out the total number of sessions the application launched by user.
- Top Servers
- This chart shows which servers the application launched the most sessions on by breaking out the total number of sessions the application launched by server.
- Top Programs
- This chart shows which programs the application launched the most by breaking out the total number of sessions the application launched by program.
Abort Details
The following charts are available in this region:
- Top Users
- This chart shows which users aborted the most sessions by breaking out the total number of sessions aborted by user.
- Top Servers
- This chart shows which server sessions were aborted on the most by breaking out the total number of aborted sessions by server.
- Top Programs
- This chart shows which programs the application aborted the most by breaking out the total number of aborted sessions by server.
ICA Load Time Details
The following charts are available in this region:
- Top Users
- This chart shows which users had the highest load times by breaking out mean load times by user.
- Top Servers
- This chart shows which servers had the highest load times by breaking out mean load times by server.
- Top Programs
- This chart shows which programs had the highest load times by breaking out mean load times by program.
ICA Virtual Channels
The following charts are available in this region:
- Client Goodput Bytes By Virtual Channel
- This chart shows you goodput bytes transmitted by Citrix ICA clients broken out by
virtual channel.
Metric Description Client Goodput Bytes By Virtual Channel The number of bytes transferred by the Citrix ICA client. Goodput refers to the throughput of the original data transferred and excludes other throughput such as protocol headers or retransmitted packets. - Server Goodput Bytes By Virtual Channel
- This chart shows you goodput bytes transmitted by Citrix ICA servers broken out by
virtual channel.
Metric Description Server Goodput Bytes By Virtual Channel The number of goodput bytes transmitted by the Citrix ICA server. Goodput refers to the throughput of the original data transferred and excludes other throughput such as protocol headers or retransmitted packets.
Network Data
This region shows you TCP information that is related to the current protocol. In general, host stalls indicate that there is an issue with either a server or a client, and network stalls indicate that there is an issue with the network.
- Host Stalls
-
This chart shows the number of zero windows that were
associated with an application. Devices control the amount of data they receive by
specifying the number of packets that can be sent to them over a given time period.
When a device is sent more data than it can process, the device advertises a zero
window to ask its peer device to stop sending packets completely until the device
catches up. If you see a large number of zero windows, a server or client might not be
not fast enough to support the amount of data being received.
Metric Definition Client Zero Windows The number of zero window advertisements sent by Citrix ICA clients. A device advertises a Zero Window when incoming data is arriving too quickly to be processed. A large number of incoming Zero Windows indicates that a peer device was too slow to process the amount of data received.
Server Zero Windows The number of zero window advertisements sent by Citrix ICA servers. A device advertises a Zero Window when incoming data is arriving too quickly to be processed. A large number of outgoing Zero Windows indicates that a client was too slow to process the amount of data received.
- Total Host Stalls
- This chart shows the median number of zero window advertisements sent by devices.
- Network Stalls
-
This chart shows the number of retransmission
timeouts that occurred. Retransmission timeouts (RTOs) occur when a network drops too
many packets, usually due to packet collisions or buffer exhaustion. If a device sends
a request or response and does not receive confirmation within a specified amount of
time, the device retransmits the request. If too many retransmissions are
unacknowledged, an RTO occurs. If you see a large number of RTOs, the network might be
too slow to support the current level of activity.
Metric Definition RTOs In The number of retransmission timeouts caused by congestion when clients were sending Citrix ICA messages. An RTO is a 1-5 second stall in the TCP connection flow due to excessive retransmissions. If you see a large number of incoming RTOs, a device did not send an acknowledgment to the server quickly enough, or the network might be too slow to support the current level of activity. Depending on the timeout value configured in the operating system, this delay can be anywhere from 1 to 8 seconds.
RTOs Out The number of retransmission timeouts caused by congestion when servers were sending Citrix ICA messages. An RTO is a 1-5 second stall in the TCP connection flow due to excessive retransmissions. If you see a large number of outgoing RTOs, a device did not receive an acknowledgment from the server quickly enough, or the network might be too slow to support the current level of activity. Depending on the timeout value configured in the operating system, this delay can be anywhere from 1 to 8 seconds.
- Total Network Stalls
-
This chart shows the median number of
retransmission timeouts caused by congestion when clients and servers were sending
requests.
Metric Definition RTOs In The number of retransmission timeouts caused by congestion when clients were sending Citrix ICA messages. An RTO is a 1-5 second stall in the TCP connection flow due to excessive retransmissions. If you see a large number of incoming RTOs, a device did not send an acknowledgment to the server quickly enough, or the network might be too slow to support the current level of activity. Depending on the timeout value configured in the operating system, this delay can be anywhere from 1 to 8 seconds.
RTOs Out The number of retransmission timeouts caused by congestion when servers were sending Citrix ICA messages. An RTO is a 1-5 second stall in the TCP connection flow due to excessive retransmissions. If you see a large number of outgoing RTOs, a device did not receive an acknowledgment from the server quickly enough, or the network might be too slow to support the current level of activity. Depending on the timeout value configured in the operating system, this delay can be anywhere from 1 to 8 seconds.
ICA Metric Totals
The following charts are available in this region:
- Total Requests and Responses
-
Requests and responses represent the conversation taking place between clients and servers. If there are more requests than responses, clients might be sending more requests than servers can handle or the network might be too slow. To identify whether the issue is with the network or a server, check RTOs and zero windows in the Network Data section.
Note: It is unlikely that the total number of ICA requests and responses will be exactly equal, even in a healthy environment. For example, you might be viewing a time period that captures a response to a request that was sent before the start of the time period. In general, the greater the difference between responses and errors, the greater the chance that there is an issue with those transactions. Metric Description Launches The number of Citrix ICA sessions that were launched. This count includes encrypted sessions. Aborts The number of Citrix ICA sessions that were initiated but closed before a Citrix application was fully loaded. Screen Updates The number of times the Citrix ICA server refreshes the client screen. Encrypted Sessions The number of Citrix ICA sessions that used an encryption method other than Basic. Certain metrics are not available for these sessions. Client Messages The number of Citrix ICA client messages transmitted. Server Messages The number of Citrix ICA server messages transferred. Client CGP Messages The number of CGP messages sent by the Citrix ICA client. The Client Gateway Protocol (CGP) encapsulates Citrix ICA traffic in support of Session Reliability. Server CGP Messages The number of CGP messages sent by the Citrix ICA server. The Client Gateway Protocol (CGP) encapsulates Citrix ICA traffic in support of Session Reliability. - ICA Network Metrics
-
Metric Description Client Zero Windows The number of zero window advertisements sent by Citrix ICA clients. A device advertises a Zero Window when incoming data is arriving too quickly to be processed. Server Zero Windows The number of zero window advertisements sent by Citrix ICA servers. A device advertises a Zero Window when incoming data is arriving too quickly to be processed. Client RTOs The number of retransmission timeouts caused by congestion when clients were sending Citrix ICA messages. An RTO is a 1-5 second stall in the TCP connection flow due to excessive retransmissions. Server RTOs The number of retransmission timeouts caused by congestion when servers were sending Citrix ICA messages. An RTO is a 1-5 second stall in the TCP connection flow due to excessive retransmissions. Client L2 Bytes The number of L2 bytes transmitted by the Citrix ICA client. Server L2 Bytes The number of L2 bytes transmitted by the Citrix ICA server. Client Goodput Bytes The number of bytes transferred by the Citrix ICA client. Goodput refers to the throughput of the original data transferred and excludes other throughput such as protocol headers or retransmitted packets. Server Goodput Bytes The number of goodput bytes transmitted by the Citrix ICA server. Goodput refers to the throughput of the original data transferred and excludes other throughput such as protocol headers or retransmitted packets. Client Packets The number of packets transmitted by Citrix ICA clients. Server Packets The number of packets transmitted by the Citrix ICA server. Client Nagle Delays The number of Citrix ICA connection delays for the client due to a bad interaction between Nagle's algorithm and delayed ACKs. Server Nagle Delays The number of Citrix ICA connection delays for the server due to a bad interaction between Nagle's algorithm and delayed ACKs.
ICA client page
This page displays metric charts of ICA traffic associated with a device on your network.
- Learn about charts on this page:
- Learn about working with metrics.
ICA Summary
The following charts are available in this region:
- Sessions
- This chart displays when the client launched and aborted Citrix ICA sessions.
Metric Description Launches The number of Citrix ICA sessions that the device launched as a client. This count includes encrypted sessions. Aborts The number of Citrix ICA sessions begun by this Citrix ICA client that were closed by one of the endpoints before an application was loaded. - Total Sessions
- This chart displays how many Citrix ICA sessions the client launched and
aborted.
Metric Description Launches The number of Citrix ICA sessions that the device launched as a client. This count includes encrypted sessions. Aborts The number of Citrix ICA sessions begun by this Citrix ICA client that were closed by one of the endpoints before an application was loaded. - Performance (95th Percentile)
- This chart shows the 95th percentile of timing metrics, measured in milliseconds.
Metric Description Login Time The time between the transmission of the Citrix ICA packet that the client sends to the server with its credentials and the Citrix ICA packet that the server sends back to the client with the user name. Load Time The amount of time from the beginning of the flow until the ExtraHop system detects traffic on one of the following virtual channels: Clipboard, Citrix Windows Multimedia Redirection, Citrix Control Virtual Channel, or Zero Latency Font and Keyboard. Client Latency When the device is acting as a Citrix ICA client, the time between a user initiating an interaction with an application and when the result appears on the screen. This metric is available only in environments where Citrix EUEM is enabled. Network Latency The detected network latency between the servers and the device when acting as a Citrix ICA server, excluding processing time on the client or server. - Performance (95th)
- This chart shows the 95th percentile of timing metrics, measured in milliseconds.
Metric Description Login Time The time between the transmission of the Citrix ICA packet that the client sends to the server with its credentials and the Citrix ICA packet that the server sends back to the client with the user name. Load Time The amount of time from the beginning of the flow until the ExtraHop system detects traffic on one of the following virtual channels: Clipboard, Citrix Windows Multimedia Redirection, Citrix Control Virtual Channel, or Zero Latency Font and Keyboard. Client Latency When the device is acting as a Citrix ICA client, the time between a user initiating an interaction with an application and when the result appears on the screen. This metric is available only in environments where Citrix EUEM is enabled. Network Latency The detected network latency between the servers and the device when acting as a Citrix ICA server, excluding processing time on the client or server. The Performance (95th percentile) chart shows the highest value for a time period while filtering outliers; the 95th percentile is the highest value that falls below 95% of the values for a sample period. By displaying the 95th value, rather than the true maximum, the chart gives you a more accurate view of the data:
ICA Performance
The following charts are available in this region:
- Login Time Distribution
- This chart breaks out login times in a histogram, measured in milliseconds.
Metric Description Login Time The time between the transmission of the Citrix ICA packet that the client sends to the server with its credentials and the Citrix ICA packet that the server sends back to the client with the user name. - Login Time
- This chart shows the median login time for the client, measured in milliseconds.
Metric Description Login Time The time between the transmission of the Citrix ICA packet that the client sends to the server with its credentials and the Citrix ICA packet that the server sends back to the client with the user name. - Load Time Distribution
- This chart breaks out load times in a histogram, measured in milliseconds.
Metric Description Load Time The amount of time from the beginning of the flow until the ExtraHop system detects traffic on one of the following virtual channels: Clipboard, Citrix Windows Multimedia Redirection, Citrix Control Virtual Channel, or Zero Latency Font and Keyboard. - Load Time
- This chart shows the median load time for the client, measured in milliseconds.
Metric Description Load Time The amount of time from the beginning of the flow until the ExtraHop system detects traffic on one of the following virtual channels: Clipboard, Citrix Windows Multimedia Redirection, Citrix Control Virtual Channel, or Zero Latency Font and Keyboard. - Client Latency Distribution
- This chart breaks out client latency in a histogram, measured in milliseconds.
Metric Description Client Latency When the device is acting as a Citrix ICA client, the time between a user initiating an interaction with an application and when the result appears on the screen. This metric is available only in environments where Citrix EUEM is enabled. - Client Latency
- This chart shows the median load client latency, measured in milliseconds.
Metric Description Client Latency When the device is acting as a Citrix ICA client, the time between a user initiating an interaction with an application and when the result appears on the screen. This metric is available only in environments where Citrix EUEM is enabled. - Network Latency Distribution
- This chart breaks out network latency in a histogram, measured in milliseconds.
Metric Description Network Latency The detected network latency between the servers and the device when acting as a Citrix ICA server, excluding processing time on the client or server. - Network Latency
- This chart shows the median network latency for the client, measured in
milliseconds.
Metric Description Network Latency The detected network latency between the servers and the device when acting as a Citrix ICA server, excluding processing time on the client or server.
Launch Details
The following charts are available in this region:
- Top Users
- This chart shows which users launched the most sessions by breaking out the total number of sessions the client launched by user.
- Top Servers
- This chart shows which servers the client launched the most sessions on by breaking out the total number of sessions the client launched by server.
- Top Programs
- This chart shows which programs the client launched the most by breaking out the total number of sessions the client launched by program.
Abort Details
The following charts are available in this region:
- Top Users
- This chart shows which users aborted the most sessions by breaking out the total number of sessions aborted by user.
- Top Servers
- This chart shows which server sessions were aborted on the most by breaking out the total number of aborted sessions by server.
- Top Programs
- This chart shows which programs the client aborted the most by breaking out the total number of aborted sessions by server.
ICA Load Time Details
The following charts are available in this region:
- Top Users
- This chart shows which users had the highest load times by breaking out mean load times by user.
- Top Servers
- This chart shows which servers had the highest load times by breaking out mean load times by server.
- Top Programs
- This chart shows which programs had the highest load times by breaking out mean load times by program.
ICA Virtual Channels
The following charts are available in this region:
- Goodput Bytes In by Virtual Channel
- This chart shows you goodput bytes received over time broken out by virtual channel.
Metric Description Goodput Bytes In by Virtual Channel The number of goodput bytes received when the device is acting as a Citrix ICA client, broken down by virtual channel. Goodput refers to the throughput of the original data transferred and excludes other throughput such as protocol headers or retransmitted packets. A virtual channel is a subset of ICA communication pertaining to a specific task. A virtual channel is a subset of ICA communication pertaining to a specific task. - Goodput Bytes Out by Virtual Channel
- This chart shows you goodput bytes sent over time broken out by virtual channel.
Metric Description Goodput Bytes Out by Virtual Channel The number of goodput bytes sent when the device is acting as a Citrix ICA client, broken down by virtual channel. Goodput refers to the throughput of the original data transferred and excludes other throughput such as protocol headers or retransmitted packets. A virtual channel is a subset of ICA communication pertaining to a specific task.
Network Data
This region shows you TCP information that is related to the current protocol. In general, host stalls indicate that there is an issue with either the server or the client, and network stalls indicate that there is an issue with the network.
- Host Stalls
- This chart shows the number of zero windows that were advertised or received by the
device. Devices control the amount of data they receive by specifying the number of
packets that can be sent to them over a given time period. When a device is sent more
data than it can process, the device advertises a zero window to ask its peer device to
stop sending packets completely until the device catches up. If you see a large number
of zero windows, a server or client might not be not fast enough to support the amount
of data being received.
Metric Definition Zero Windows In The number of zero windows that were sent to the device to stop the flow of data over the connection. A device advertises a Zero Window when incoming data is arriving too quickly to be processed. A large number of zero windows in indicates that a peer device was too slow to process the amount of data received.
Zero Windows Out The number of zero windows that were sent from the device to stop the flow of data. A device advertises a Zero Window when incoming data is arriving too quickly to be processed. A large number of zero windows out indicates that the client was too slow to process the amount of data received.
- Network Stalls
-
This chart shows the number of retransmission timeouts that occurred. Retransmission timeouts (RTOs) occur when a network drops too many packets, usually due to packet collisions or buffer exhaustion. If a device sends a request or response and does not receive confirmation within a specified amount of time, the device retransmits the request. If too many retransmissions are unacknowledged, an RTO occurs. If you see a large number of RTOs, the network might be too slow to support the current level of activity.
Metric Definition RTOs In The number of retransmission timeouts (RTOs) caused by network congestion as peers were sending data to the current device. An RTO is a 1-5 second stall in the TCP connection flow due to excessive retransmissions. If you see a large number of RTOs in, the device did not send an acknowledgment to the server quickly enough, or the network might be too slow to support the current level of activity. Depending on the timeout value configured in the operating system, this delay can be anywhere from 1 to 8 seconds.
RTOs Out The number of retransmission timeouts (RTOs) caused by network congestion as the device was sending data to its peers. An RTO is a 1-5 second stall in the TCP connection flow due to excessive retransmissions. If you see a large number of RTOs out, the device did not receive an acknowledgment from the server quickly enough, or the network might be too slow to support the current level of activity. Depending on the timeout value configured in the operating system, this delay can be anywhere from 1 to 8 seconds.
ICA Metric Totals
The following charts are available in this region:
- Total Sessions
- Displays the total number of launches, aborts, and screen updates initiated by the
client.
Metric Description Launches The number of Citrix ICA sessions that the device launched as a client. This count includes encrypted sessions. Aborts The number of Citrix ICA sessions begun by this Citrix ICA client that were closed by one of the endpoints before an application was loaded. Screen Updates The number of times a server refreshed the screen when the device was acting as a Citrix ICA client. Encrypted Sessions The number of sessions that the device participated in as a Citrix ICA client and that used an encryption method other than Basic. Certain metrics are not available for these sessions. - Sessions and Messages
- Displays how many sessions the client participated in and how many messages the client
sent and received.
Metric Description Client Messages The number of Citrix ICA client messages sent by the device when acting as the Citrix ICA client. Server Messages The number of Citrix ICA server messages sent to the device when acting as a Citrix ICA client. Client CGP Messages The number of CGP messages sent when the device is acting as a Citrix ICA client. The Client Gateway Protocol (CGP) encapsulates Citrix ICA traffic in support of Session Reliability. Server CGP Messages The number of CGP server messages exchanged when the device is acting as a Citrix ICA client. The Client Gateway Protocol (CGP) encapsulates Citrix ICA traffic in support of Session Reliability.
ICA server page
This page displays metric charts of ICA traffic associated with a device on your network.
- Learn about charts on this page:
- Learn about working with metrics.
ICA Summary
The following charts are available in this region:
- Sessions
- This chart displays when the server launched and aborted Citrix ICA sessions.
Metric Description Launches The number of Citrix ICA sessions that the device launched as a server. This count includes encrypted sessions. Aborts The number of Citrix ICA sessions begun by this Citrix ICA server that were closed by one of the endpoints before an application was loaded. - Total Sessions
- This chart displays how many Citrix ICA sessions the server launched and
aborted.
Metric Description Launches The number of Citrix ICA sessions that the device launched as a server. This count includes encrypted sessions. Aborts The number of Citrix ICA sessions begun by this Citrix ICA server that were closed by one of the endpoints before an application was loaded. - Performance (95th Percentile)
- This chart shows the 95th percentile of timing metrics, measured in milliseconds.
Metric Description Login Time The time between the transmission of the Citrix ICA packet that the client sends to the server with its credentials and the Citrix ICA packet that the server sends back to the client with the user name. Load Time The amount of time from the beginning of the flow until the ExtraHop system detects traffic on one of the following virtual channels: Clipboard, Citrix Windows Multimedia Redirection, Citrix Control Virtual Channel, or Zero Latency Font and Keyboard. Server Latency When the device is acting as a Citrix ICA server, the time between users initiating an interaction with an application and when the result appears on the screen. This metric is available only in environments where Citrix EUEM is enabled . Network Latency The detected network latency between the servers and the device when acting as a Citrix ICA server, excluding processing time on the client or server. - Performance (95th)
- This chart shows the 95th percentile of timing metrics, measured in
milliseconds.
Metric Description Login Time The time between the transmission of the Citrix ICA packet that the client sends to the server with its credentials and the Citrix ICA packet that the server sends back to the client with the user name. Load Time The amount of time from the beginning of the flow until the ExtraHop system detects traffic on one of the following virtual channels: Clipboard, Citrix Windows Multimedia Redirection, Citrix Control Virtual Channel, or Zero Latency Font and Keyboard. Server Latency When the device is acting as a Citrix ICA server, the time between users initiating an interaction with an application and when the result appears on the screen. This metric is available only in environments where Citrix EUEM is enabled . Network Latency The detected network latency between the servers and the device when acting as a Citrix ICA server, excluding processing time on the client or server. The Performance (95th percentile) chart shows the highest value for a time period while filtering outliers; the 95th percentile is the highest value that falls below 95% of the values for a sample period. By displaying the 95th value, rather than the true maximum, the chart gives you a more accurate view of the data:
ICA Performance
The following charts are available in this region:
- Login Time Distribution
- This chart breaks out login times in a histogram, measured in milliseconds.
Metric Description Login Time The time between the transmission of the Citrix ICA packet that the client sends to the server with its credentials and the Citrix ICA packet that the server sends back to the client with the user name. - Login Time
- This chart shows the median login time for the server, measured in milliseconds.
Metric Description Login Time The time between the transmission of the Citrix ICA packet that the client sends to the server with its credentials and the Citrix ICA packet that the server sends back to the client with the user name. - Load Time Distribution
- This chart shows the median login time for the server, measured in milliseconds.
Metric Description Load Time The amount of time from the beginning of the flow until the ExtraHop system detects traffic on one of the following virtual channels: Clipboard, Citrix Windows Multimedia Redirection, Citrix Control Virtual Channel, or Zero Latency Font and Keyboard. - Load Time
- This chart shows the median load time for the server, measured in milliseconds.
Metric Description Load Time The amount of time from the beginning of the flow until the ExtraHop system detects traffic on one of the following virtual channels: Clipboard, Citrix Windows Multimedia Redirection, Citrix Control Virtual Channel, or Zero Latency Font and Keyboard. - Client Latency Distribution
- This chart breaks out client latency in a histogram, measured in milliseconds.
Metric Description Client Latency When the device is acting as a Citrix ICA server, the time between users initiating an interaction with an application and when the result appears on the screen. This metric is available only in environments where Citrix EUEM is enabled . - Client Latency
- This chart shows the median load client latency, measured in milliseconds.
Metric Description Client Latency When the device is acting as a Citrix ICA server, the time between users initiating an interaction with an application and when the result appears on the screen. This metric is available only in environments where Citrix EUEM is enabled . - Network Latency Distribution
- This chart breaks out network latency in a histogram, measured in milliseconds.
Metric Description Network Latency The detected network latency between the servers and the device when acting as a Citrix ICA server, excluding processing time on the client or server. - Network Latency
- This chart shows the median network latency for the server, measured in
milliseconds.
Metric Description Network Latency The detected network latency between the servers and the device when acting as a Citrix ICA server, excluding processing time on the client or server.
Launch Details
The following charts are available in this region:
- Top Users
- This chart shows which users launched the most sessions by breaking out the total number of sessions aborted by user.
- Top Clients
- This chart shows which clients launched the most sessions on the server by breaking out the total number of sessions launched by client.
- Top Programs
- This chart shows which programs were launched on the server the most by breaking out the total number of sessions launched by program.
Abort Details
The following charts are available in this region:
- Top Users
- This chart shows which users aborted the most sessions by breaking out the total number of sessions aborted by user.
- Top Clients
- This chart shows which clients aborted the most sessions on the server by breaking out the total number of sessions aborted by client.
- Top Programs
- This chart shows which programs were aborted on the server the most by breaking out the total number of sessions aborted by program.
Load Time Details
The following charts are available in this region:
- Top Users
- This chart shows which users had the highest load times by breaking out mean load times by user.
- Top Clients
- This chart shows which clients had the highest load times by breaking out mean load times by client.
- Top Programs
- This chart shows which programs had the highest load times by breaking out mean load times by program.
ICA Virtual Channels
The following charts are available in this region:
- Goodput Bytes In by Channel
- This chart shows you goodput bytes received over time broken out by virtual channel.
Metric Description Goodput Bytes In by Virtual Channel The number of goodput bytes received when the device is acting as a Citrix ICA server, broken down by virtual channel. Goodput refers to the throughput of the original data transferred and excludes other throughput such as protocol headers or retransmitted packets. A virtual channel is a subset of ICA communication pertaining to a specific task. - Goodput Bytes Out by Channel
- This chart shows you goodput bytes sent over time broken out by virtual channel.
Metric Description Goodput Bytes Out by Virtual Channel The number of goodput bytes received when the device is acting as a Citrix ICA server, broken down by virtual channel. Goodput refers to the throughput of the original data transferred and excludes other throughput such as protocol headers or retransmitted packets. A virtual channel is a subset of ICA communication pertaining to a specific task.
Network Data
This region shows you TCP information that is related to the current protocol. In general, host stalls indicate that there is an issue with either the server or the client, and network stalls indicate that there is an issue with the network.
- Host Stalls
- This chart shows the number of zero windows that were advertised or received by the
device. Devices control the amount of data they receive by specifying the number of
packets that can be sent to them over a given time period. When a device is sent more
data than it can process, the device advertises a zero window to ask its peer device to
stop sending packets completely until the device catches up. If you see a large number
of zero windows, a server or client might not be not fast enough to support the amount
of data being received.
Metric Definition Zero Windows In The number of zero windows that were sent to the device to stop the flow of data over the connection. A device advertises a Zero Window when incoming data is arriving too quickly to be processed. A large number of zero windows in indicates that a peer device was too slow to process the amount of data received.
Zero Windows Out The number of zero windows that were sent from the device to stop the flow of data. A device advertises a Zero Window when incoming data is arriving too quickly to be processed. A large number of zero windows out indicates that the client was too slow to process the amount of data received.
- Network Stalls
-
This chart shows the number of retransmission timeouts that occurred. Retransmission timeouts (RTOs) occur when a network drops too many packets, usually due to packet collisions or buffer exhaustion. If a device sends a request or response and does not receive confirmation within a specified amount of time, the device retransmits the request. If too many retransmissions are unacknowledged, an RTO occurs. If you see a large number of RTOs, the network might be too slow to support the current level of activity.
Metric Definition RTOs In The number of retransmission timeouts (RTOs) caused by network congestion as peers were sending data to the current device. An RTO is a 1-5 second stall in the TCP connection flow due to excessive retransmissions. If you see a large number of RTOs in, the device did not send an acknowledgment to the server quickly enough, or the network might be too slow to support the current level of activity. Depending on the timeout value configured in the operating system, this delay can be anywhere from 1 to 8 seconds.
RTOs Out The number of retransmission timeouts (RTOs) caused by network congestion as the device was sending data to its peers. An RTO is a 1-5 second stall in the TCP connection flow due to excessive retransmissions. If you see a large number of RTOs out, the device did not receive an acknowledgment from the server quickly enough, or the network might be too slow to support the current level of activity. Depending on the timeout value configured in the operating system, this delay can be anywhere from 1 to 8 seconds.
ICA Metric Totals
The following charts are available in this region:
- Total Sessions
- Displays the total number of launches, aborts, and screen updates initiated by the
server.
Metric Description Launches The number of Citrix ICA sessions that the device launched as a server. This count includes encrypted sessions. Aborts The number of Citrix ICA sessions begun by this Citrix ICA server that were closed by one of the endpoints before an application was loaded. Screen Updates The number of times the device, when acting as a Citrix ICA server, refreshed the screen of a client. Encrypted Sessions The number of sessions that the device participated in as a Citrix ICA server and that used an encryption method other than Basic. Certain metrics are not available for these sessions. - Total Messages
- Displays how many sessions the server participated in and how many messages the server
sent and received.
Metric Description Client Messages The number of Citrix ICA client messages received by the device when acting as the Citrix ICA server. Server Messages The number of Citrix ICA server messages sent by the device when acting as a Citrix ICA server. Client CGP Messages The number of CGP messages sent when the device is acting as a Citrix ICA server. The Client Gateway Protocol (CGP) encapsulates Citrix ICA traffic in support of Session Reliability. Server CGP Messages The number of CGP server messages exchanged when the device is acting as a Citrix ICA server. The Client Gateway Protocol (CGP) encapsulates Citrix ICA traffic in support of Session Reliability.
ICA client group page
This page displays metric charts of ICA traffic associated with a device group on your network.
- Learn about charts on this page:
- Learn about working with metrics.
DNS Summary for Group
The following charts are available in this region:
- Sessions
- This chart displays when clients in the group launched and aborted Citrix ICA
sessions.
Metric Description Launches The number of Citrix ICA sessions that the device launched as a client. This count includes encrypted sessions. Aborts The number of Citrix ICA sessions begun by this Citrix ICA client that were closed by one of the endpoints before an application was loaded. - Total Sessions
- This chart displays how many times clients in the group launched and aborted Citrix
ICA sessions.
Metric Description Launches The number of Citrix ICA sessions that the device launched as a client. This count includes encrypted sessions. Aborts The number of Citrix ICA sessions begun by this Citrix ICA client that were closed by one of the endpoints before an application was loaded.
ICA Launch Details for Group
The following charts are available in this region:
- Top Group Members (ICA Clients)
- This chart shows which ICA clients in the group were most active by breaking out the total number of ICA session launches by client.
- Top Users
- This chart shows which ICA users in the group were most active by breaking out the total number of ICA session launches by user.
- Top Programs
- This chart shows which ICA programs the group launched the most active by breaking out the total number of ICA session launches by program.
ICA Metrics for Group
The following charts are available in this region:
- Sessions
- Displays how many sessions clients in the group launched and aborted.
Metric Description Launches The number of Citrix ICA sessions that the device launched as a client. This count includes encrypted sessions. Aborts The number of Citrix ICA sessions begun by this Citrix ICA client that were closed by one of the endpoints before an application was loaded. Screen Updates The number of times a server refreshed the screen when the device was acting as a Citrix ICA client. Encrypted Sessions The number of sessions that the device participated in as a Citrix ICA client and that used an encryption method other than Basic. Certain metrics are not available for these sessions. - Total Messages
- Displays how many sessions the clients in the group participated in and how many
messages the clients sent and received.
Metric Description Encrypted Sessions The number of sessions that the device participated in as a Citrix ICA client and that used an encryption method other than Basic. Certain metrics are not available for these sessions. Client Messages The number of Citrix ICA client messages sent by the device when acting as the Citrix ICA client. Server Messages The number of Citrix ICA server messages sent to the device when acting as a Citrix ICA client. Client CGP Messages The number of CGP messages sent when the device is acting as a Citrix ICA client. The Client Gateway Protocol (CGP) encapsulates Citrix ICA traffic in support of Session Reliability. Server CGP Messages The number of CGP server messages exchanged when the device is acting as a Citrix ICA client. The Client Gateway Protocol (CGP) encapsulates Citrix ICA traffic in support of Session Reliability. - Login and Load Time (95th Percentile)
- This chart shows the 95th percentile of timing metrics, measured in
milliseconds.
Metric Description Login Time The time between the transmission of the Citrix ICA packet that the client sends to the server with its credentials and the Citrix ICA packet that the server sends back to the client with the user name. Load Time The amount of time from the beginning of the flow until the ExtraHop system detects traffic on one of the following virtual channels: Clipboard, Citrix Windows Multimedia Redirection, Citrix Control Virtual Channel, or Zero Latency Font and Keyboard.
ICA server group page
This page displays metric charts of ICA traffic associated with a device group on your network.
- Learn about charts on this page:
- Learn about working with metrics.
ICA Summary for Group
The following charts are available in this region:
- Sessions
- This chart displays when servers in the group launched and aborted Citrix ICA
sessions.
Metric Description Launches The number of Citrix ICA sessions that the device launched as a server. This count includes encrypted sessions. Aborts The number of Citrix ICA sessions begun by this Citrix ICA server that were closed by one of the endpoints before an application was loaded. - Total Sessions
- This chart displays how many times servers in the group launched and aborted Citrix
ICA sessions.
Metric Description Launches The number of Citrix ICA sessions that the device launched as a server. This count includes encrypted sessions. Aborts The number of Citrix ICA sessions begun by this Citrix ICA server that were closed by one of the endpoints before an application was loaded.
ICA Launch Details for Group
The following charts are available in this region:
- Top Group Members (ICA Servers)
- This chart shows which ICA servers in the group were most active by breaking out the total number of ICA responses the group sent by server.
- Top Users
- This chart shows which ICA users were most active in the group by breaking out the total number of ICA session launches by user.
- Top Programs
- This chart shows which ICA programs were launched on the group the most active by breaking out the total number of ICA session launches by program.
ICA Metrics for Group
The following charts are available in this region:
- Total Sessions
- This chart displays how many sessions servers in the group launched and aborted.
Metric Description Launches The number of Citrix ICA sessions that the device launched as a server. This count includes encrypted sessions. Aborts The number of Citrix ICA sessions begun by this Citrix ICA server that were closed by one of the endpoints before an application was loaded. Screen Updates The number of times the device, when acting as a Citrix ICA server, refreshed the screen of a client. Encrypted Sessions The number of sessions that the device participated in as a Citrix ICA server and that used an encryption method other than Basic. Certain metrics are not available for these sessions. - Total Messages
- Displays how many sessions the servers in the group participated in and how many
messages the servers sent and received.
Metric Description Encrypted Sessions The number of sessions that the device participated in as a Citrix ICA server and that used an encryption method other than Basic. Certain metrics are not available for these sessions. Client Messages The number of Citrix ICA client messages received by the device when acting as the Citrix ICA server. Server Messages The number of Citrix ICA server messages sent by the device when acting as a Citrix ICA server. Client CGP Messages The number of CGP messages sent when the device is acting as a Citrix ICA server. The Client Gateway Protocol (CGP) encapsulates Citrix ICA traffic in support of Session Reliability. Server CGP Messages The number of CGP server messages exchanged when the device is acting as a Citrix ICA server. The Client Gateway Protocol (CGP) encapsulates Citrix ICA traffic in support of Session Reliability. - Login and Load Time (95th Percentile)
- This chart shows the 95th percentile of timing metrics, measured in
milliseconds.
Metric Description Login Time The time between the transmission of the Citrix ICA packet that the client sends to the server with its credentials and the Citrix ICA packet that the server sends back to the client with the user name. Load Time The amount of time from the beginning of the flow until the ExtraHop system detects traffic on one of the following virtual channels: Clipboard, Citrix Windows Multimedia Redirection, Citrix Control Virtual Channel, or Zero Latency Font and Keyboard.
iSCSI
The ExtraHop system collects metrics about Internet Small Computer System Interface (iSCSI) activity. iSCSI is a TCP-level protocol that allows SCSI commands to be sent over a local-area network (LAN) or wide-area network (WAN).
iSCSI client page
This page displays metric charts of iSCSI traffic associated with a device on your network.
- Learn about charts on this page:
- Learn about working with metrics.
iSCSI Summary
The following charts are available in this region:
- Transactions
- This chart shows you when iSCSI errors occurred and how many responses the iSCSI
client received. This information can help you see how active the client was at the time
it received the errors.
In a healthy environment, the number of requests and responses should be roughly equal. For more information, see Requests and Responses.
Metric Description Responses The number of responses that the device received when acting as a iSCSI initiator. Errors When the device is acting as an iSCSI initiator, the combined total of Reject PDUs and unsuccessful login responses received. - Total Transactions
- This chart displays the total number of iSCSI sessions the client initiated, the
number of responses the client received, and how many of those responses contained
errors.
Metric Description Responses The number of responses that the device received when acting as a iSCSI initiator. Errors When the device is acting as an iSCSI initiator, the combined total of Reject PDUs and unsuccessful login responses received. Sessions The number of iSCSI sessions that the device began when acting as an iSCSI initiator. - Operations
- This chart shows you when the iSCSI client performed read, write, header digest, and
data digest operations.
Metric Description Reads (Data Out) The number of read operation requests that the device sent when acting as an iSCSI initiator. Writes (Data In) The number of write operation requests that the device sent when acting as an iSCSI initiator. Header Digest The number of operations that included optional header digests when the device is acting as an iSCSI initiator. Data Digest The number of operations that included optional data digests when the device is acting as an iSCSI initiator. - Total Operations
- This chart shows you how many read and write operations the iSCSI client
performed.
Metric Description Reads (Data Out) The number of read operation requests that the device sent when acting as an iSCSI initiator. Writes (Data In) The number of write operation requests that the device sent when acting as an iSCSI initiator. Header Digest The number of operations that included optional header digests when the device is acting as an iSCSI initiator. Data Digest The number of operations that included optional data digests when the device is acting as an iSCSI initiator.
iSCSI Details
The following charts are available in this region:
- Top Opcodes
- This chart shows which iSCSI opcodes the client received the most by breaking out the number of responses returned to the client by opcode.
- Top Login Errors
- This chart shows which iSCSI login errors the client received the most by breaking out the number of responses returned to the client by login errors.
- Top Reject Reasons
- This chart shows which reject reasons the client received the most by breaking out the number of responses returned to the client by reason.
Network Data
This region shows you TCP information that is related to the current protocol. In general, host stalls indicate that there is an issue with either the server or the client, and network stalls indicate that there is an issue with the network.
- Host Stalls
- This chart shows the number of zero windows that were advertised or received by the
device. Devices control the amount of data they receive by specifying the number of
packets that can be sent to them over a given time period. When a device is sent more
data than it can process, the device advertises a zero window to ask its peer device to
stop sending packets completely until the device catches up. If you see a large number
of zero windows, a server or client might not be not fast enough to support the amount
of data being received.
Metric Definition Zero Windows In The number of zero windows that were sent to the device to stop the flow of data over the connection. A device advertises a Zero Window when incoming data is arriving too quickly to be processed. A large number of zero windows in indicates that a peer device was too slow to process the amount of data received.
Zero Windows Out The number of zero windows that were sent from the device to stop the flow of data. A device advertises a Zero Window when incoming data is arriving too quickly to be processed. A large number of zero windows out indicates that the client was too slow to process the amount of data received.
- Network Stalls
-
This chart shows the number of retransmission timeouts that occurred. Retransmission timeouts (RTOs) occur when a network drops too many packets, usually due to packet collisions or buffer exhaustion. If a device sends a request or response and does not receive confirmation within a specified amount of time, the device retransmits the request. If too many retransmissions are unacknowledged, an RTO occurs. If you see a large number of RTOs, the network might be too slow to support the current level of activity.
Metric Definition RTOs In The number of retransmission timeouts (RTOs) caused by network congestion as peers were sending data to the current device. An RTO is a 1-5 second stall in the TCP connection flow due to excessive retransmissions. If you see a large number of RTOs in, the device did not send an acknowledgment to the server quickly enough, or the network might be too slow to support the current level of activity. Depending on the timeout value configured in the operating system, this delay can be anywhere from 1 to 8 seconds.
RTOs Out The number of retransmission timeouts (RTOs) caused by network congestion as the device was sending data to its peers. An RTO is a 1-5 second stall in the TCP connection flow due to excessive retransmissions. If you see a large number of RTOs out, the device did not receive an acknowledgment from the server quickly enough, or the network might be too slow to support the current level of activity. Depending on the timeout value configured in the operating system, this delay can be anywhere from 1 to 8 seconds.
iSCSI Metric Totals
The following charts are available in this region:
- Total Responses and Operations
- This chart displays the total number of responses the client received and the total
number of operations the client performed.
Metric Description Responses The number of responses that the device received when acting as a iSCSI initiator. Sessions The number of iSCSI sessions that the device began when acting as an iSCSI initiator. Errors When the device is acting as an iSCSI initiator, the combined total of Reject PDUs and unsuccessful login responses received. Reads (Data Out) The number of read operation requests that the device sent when acting as an iSCSI initiator. Writes (Data In) The number of write operation requests that the device sent when acting as an iSCSI initiator. Header Digest The number of operations that included optional header digests when the device is acting as an iSCSI initiator. Data Digest The number of operations that included optional data digests when the device is acting as an iSCSI initiator. Reject PDUs The number of Reject PDUs that the device received when acting as an iSCSI initiator. - Total Goodput Bytes
- This chart displays the total number of goodput bytes read and written by the
client.
Metric Description Goodput Bytes Read The number of goodput bytes sent for read operations when the device is acting as an iSCSI target. Goodput refers to the throughput of the original data transferred and excludes other throughput such as protocol headers or retransmitted packets. Goodput Bytes Written The number of goodput bytes the device received for write operations when acting as an iSCSI target. Goodput refers to the throughput of the original data transferred and excludes other throughput such as protocol headers or retransmitted packets.
iSCSI server page
This page displays metric charts of iSCSI traffic associated with a device on your network.
- Learn about charts on this page:
- Learn about working with metrics.
iSCSI Summary
The following charts are available in this region:
- Transactions
- This chart shows you when iSCSI errors occurred and how many iSCSI responses the
server sent. This information can help you see how active the server was at the time it
returned the errors.
In a healthy environment, the number of requests and responses should be roughly equal. For more information, see Requests and Responses.
Metric Description Responses The number of responses that the device sent when acting as a iSCSI target. Errors When the device is acting as an iSCSI target, the combined total of Reject PDUs and unsuccessful login responses sent. - Total Transactions
- This chart displays the total number of iSCSI sessions the server started, the number
of responses the server sent, and how many of those responses contained errors.
Metric Description Responses The number of responses that the device sent when acting as a iSCSI target. Errors When the device is acting as an iSCSI target, the combined total of Reject PDUs and unsuccessful login responses sent. Sessions The number of iSCSI sessions that the device began when acting as an iSCSI target. - Operations
- This chart shows you when read, write, header digest, and data digest operations were
performed on the iSCSI server.
Metric Description Reads (Data Out) The number of read operation requests that the device sent when acting as an iSCSI initiator. Writes (Data In) The number of write operation requests that the device sent when acting as an iSCSI initiator. Header Digest The number of operations that included optional header digests when the device is acting as an iSCSI initiator. Data Digest The number of operations that included optional data digests when the device is acting as an iSCSI initiator. - Total Operations
- This chart shows you how many read and write operations were performed on the iSCSI
server.
Metric Description Reads (Data Out) The number of read operation requests that the device sent when acting as an iSCSI initiator. Writes (Data In) The number of write operation requests that the device sent when acting as an iSCSI initiator. Header Digest The number of operations that included optional header digests when the device is acting as an iSCSI initiator. Data Digest The number of operations that included optional data digests when the device is acting as an iSCSI initiator.
iSCSI Details
The following charts are available in this region:
- Top Opcodes
- This chart shows which iSCSI opcodes the server returned the most by breaking out the total number of responses the server sent by opcode.
- Top Login Errors
- This chart shows which iSCSI login errors the server returned the most by breaking out the total number of responses the server sent by login error.
- Top Reject Reasons
- This chart shows which iSCSI reject reasons the server returned the most by breaking out the total number of responses the server sent by reasons.
Network Data
This region shows you TCP information that is related to the current protocol. In general, host stalls indicate that there is an issue with either the server or the client, and network stalls indicate that there is an issue with the network.
- Host Stalls
- This chart shows the number of zero windows that were advertised or received by the
device. Devices control the amount of data they receive by specifying the number of
packets that can be sent to them over a given time period. When a device is sent more
data than it can process, the device advertises a zero window to ask its peer device to
stop sending packets completely until the device catches up. If you see a large number
of zero windows, a server or client might not be not fast enough to support the amount
of data being received.
Metric Definition Zero Windows In The number of zero windows that were sent to the device to stop the flow of data over the connection. A device advertises a Zero Window when incoming data is arriving too quickly to be processed. A large number of zero windows in indicates that a peer device was too slow to process the amount of data received.
Zero Windows Out The number of zero windows that were sent from the device to stop the flow of data. A device advertises a Zero Window when incoming data is arriving too quickly to be processed. A large number of zero windows out indicates that the client was too slow to process the amount of data received.
- Network Stalls
-
This chart shows the number of retransmission timeouts that occurred. Retransmission timeouts (RTOs) occur when a network drops too many packets, usually due to packet collisions or buffer exhaustion. If a device sends a request or response and does not receive confirmation within a specified amount of time, the device retransmits the request. If too many retransmissions are unacknowledged, an RTO occurs. If you see a large number of RTOs, the network might be too slow to support the current level of activity.
Metric Definition RTOs In The number of retransmission timeouts (RTOs) caused by network congestion as peers were sending data to the current device. An RTO is a 1-5 second stall in the TCP connection flow due to excessive retransmissions. If you see a large number of RTOs in, the device did not send an acknowledgment to the server quickly enough, or the network might be too slow to support the current level of activity. Depending on the timeout value configured in the operating system, this delay can be anywhere from 1 to 8 seconds.
RTOs Out The number of retransmission timeouts (RTOs) caused by network congestion as the device was sending data to its peers. An RTO is a 1-5 second stall in the TCP connection flow due to excessive retransmissions. If you see a large number of RTOs out, the device did not receive an acknowledgment from the server quickly enough, or the network might be too slow to support the current level of activity. Depending on the timeout value configured in the operating system, this delay can be anywhere from 1 to 8 seconds.
iSCSI Metric Totals
The following charts are available in this region:
- Total Responses and Operations
- This chart displays the total number of responses the server sent and the total number
of operations that were performed on the server.
Metric Description Responses The number of responses that the device sent when acting as a iSCSI target. Sessions The number of iSCSI sessions that the device began when acting as an iSCSI target. Errors When the device is acting as an iSCSI target, the combined total of Reject PDUs and unsuccessful login responses sent. Reads (Data Out) The number of read operation requests that the device received when acting as an iSCSI target. Writes (Data In) The number of write operation requests that the device received when acting as an iSCSI target. Header Digest The number of operations that included optional header digests when the device is acting as an iSCSI target. Data Digest The number of operations that included optional data digests when the device is acting as an iSCSI target. Reject PDUs The number of Reject PDUs that the device sent when acting as an iSCSI target. - Total Goodput Bytes
- This chart displays the total number of goodput bytes read and written by the
server.
Metric Description Goodput Bytes Read The number of goodput bytes received for read operations when the device is acting as a iSCSI initiator. Goodput refers to the throughput of the original data transferred and excludes other throughput such as protocol headers or retransmitted packets. Goodput Bytes Written The number of goodput bytes sent for write operations when the device is acting as an iSCSI initiator. Goodput refers to the throughput of the original data transferred and excludes other throughput such as protocol headers or retransmitted packets.
iSCSI client group page
This page displays metric charts of iSCSI traffic associated with a device group on your network.
- Learn about charts on this page:
- Learn about working with metrics.
iSCSI Summary for Group
The following charts are available in this region:
- Transactions
- This chart shows you when iSCSI errors occurred and how many responses the iSCSI
clients received. This information can help you see how active the clients were at the
time they received the errors.
In a healthy environment, the number of requests and responses should be roughly equal.
Metric Description Responses The number of responses that the device received when acting as a iSCSI initiator. Errors When the device is acting as an iSCSI initiator, the combined total of Reject PDUs and unsuccessful login responses received. - Total Transactions
- This chart shows you how many iSCSI responses the clients received and how many of
those responses contained errors.
Metric Description Responses The number of responses that the device received when acting as a iSCSI initiator. Errors When the device is acting as an iSCSI initiator, the combined total of Reject PDUs and unsuccessful login responses received.
iSCSI Details for Group
The following charts are available in this region:
- Top Group Members (iSCSI Clients)
- This chart shows which iSCSI clients in the group were most active by breaking out the total number of iSCSI requests the group sent by client.
- Top Opcodes
- This chart shows which iSCSI opcodes the group received the most by breaking out the number of responses returned to the group by opcode.
- Top Login Errors
- This chart shows which iSCSI login errors the group received the most by breaking out the number of responses returned to the group by login error.
iSCSI Metrics for Group
The following charts are available in this region:
- Total Responses and Operations
-
Metric Description Responses The number of responses that the device received when acting as a iSCSI initiator. Sessions The number of iSCSI sessions that the device began when acting as an iSCSI initiator. Errors When the device is acting as an iSCSI initiator, the combined total of Reject PDUs and unsuccessful login responses received. Reads (Data Out) The number of read operation requests that the device sent when acting as an iSCSI initiator. Writes (Data In) The number of write operation requests that the device sent when acting as an iSCSI initiator. Header Digest The number of operations that included optional header digests when the device is acting as an iSCSI initiator. Data Digest The number of operations that included optional data digests when the device is acting as an iSCSI initiator. Reject PDUs The number of Reject PDUs that the device received when acting as an iSCSI initiator.
iSCSI server group page
This page displays metric charts of iSCSI traffic associated with a device group on your network.
- Learn about charts on this page:
- Learn about working with metrics.
iSCSI Summary for Group
The following charts are available in this region:
- Transactions
- This chart shows you when iSCSI errors occurred and how many iSCSI responses the
servers sent. This information can help you see how active the servers were at the time
they returned the errors.
In a healthy environment, the number of requests and responses should be roughly equal.
Metric Description Responses The number of responses that the device sent when acting as a iSCSI target. Errors When the device is acting as an iSCSI target, the combined total of Reject PDUs and unsuccessful login responses sent. - Total Transactions
- This chart shows you how many iSCSI responses servers in the group sent and how many
of those responses contained errors.
Metric Description Responses The number of responses that the device sent when acting as a iSCSI target. Errors When the device is acting as an iSCSI target, the combined total of Reject PDUs and unsuccessful login responses sent.
iSCSI Details for Group
The following charts are available in this region:
- Top Group Members (iSCSI Servers)
- This chart shows which iSCSI servers in the group were most active by breaking out the total number of iSCSI responses the group sent by server.
- Top Opcodes
- This chart shows which iSCSI opcodes the groups returned the most by breaking out the total number of responses the group sent by opcode.
- Top Login Errors
- This chart shows which iSCSI login errors the groups returned the most by breaking out the total number of responses the group sent by login error.
iSCSI Metrics for Group
The following charts are available in this region:
- Total Responses and Operations
-
Metric Description Responses The number of responses that the device sent when acting as a iSCSI target. Sessions The number of iSCSI sessions that the device began when acting as an iSCSI target. Errors When the device is acting as an iSCSI target, the combined total of Reject PDUs and unsuccessful login responses sent. Reads (Data Out) The number of read operation requests that the device received when acting as an iSCSI target. Writes (Data In) The number of write operation requests that the device received when acting as an iSCSI target. Header Digest The number of operations that included optional header digests when the device is acting as an iSCSI target. Data Digest The number of operations that included optional data digests when the device is acting as an iSCSI target. Reject PDUs The number of Reject PDUs that the device sent when acting as an iSCSI target.
Kerberos
The ExtraHop system collects metrics about Kerberos activity. Kerberos is a security protocol that applies mutual, secret-key cryptography to client and server authentication, requiring both the user and server to prove their identities.
Security considerations
- Kerberos Ticket Granting Tickets (TGTs) that are forged with a stolen KRBTGT hash are known as golden tickets. A golden ticket enables an attacker to impersonate a domain administrator and gain access to any service in a domain.
- Kerberos Ticket Granting Service (TGS) tickets that are forged with stolen service keys are known as silver tickets. A silver ticket enables an attacker to impersonate a domain administrator and gain access to a specific service.
- Kerberos TGS tickets can be stolen in a Kerberoasting attack, where an attacker attempts to crack the encrypted TGS tickets offline to harvest service account passwords.
- Kerberos AS-REP responses can be stolen in an AS-REP roasting attack, where an attacker attempts to crack the encrypted user account password from the AS-REP response offline.
- Kerberos authentication can be vulnerable to brute force, which is a method for guessing credentials by submitting numerous authentication requests with different username and password combinations.
- Attack tools, such as Impacket, can enable Kerberos attacks.
- Encrypted Kerberos traffic is an increasingly common vector for malicious activity. You can configure the ExtraHop system to decrypt domain traffic to identify suspicious behaviors and potential attacks.
Kerberos application page
This page displays metric charts of Kerberos traffic associated with an application container on your network.
- Learn about charts on this page:
- Learn about Kerberos security considerations
- Learn about working with metrics.
Kerberos Summary
The following charts are available in this region:
- Transactions
- This chart shows you when Kerberos errors and responses were associated with the
application. This information can help you see how active the application was at the
time the errors occurred.
In a healthy environment, the number of requests and responses should be roughly equal. For more information, see Requests and Responses.
Metric Description Responses The number of responses that were sent by Kerberos servers. Errors The number of Kerberos response errors. - Total Transactions
- This chart displays the total number of Kerberos responses that were associated with
the application and how many of those responses contained errors.
Metric Description Responses The number of responses that were sent by Kerberos servers. Errors The number of Kerberos response errors. - Performance (95th Percentile)
-
This chart shows the 95th percentile of timing metrics,
measured in milliseconds. The transfer and processing time metrics show parts of a
complete transaction. The request transfer time shows how long clients took to transmit
requests onto the network; the server processing time shows how long the servers took to
process requests; and the response transfer time shows how long the servers took to
transmit responses onto the network.
Transfer and processing times are calculated by measuring the time between when the first and last packets of requests and responses are seen by the ExtraHop system, as shown in the following figure:
It can be difficult to tell whether an issue is caused by a network or a device from looking only at transfer and processing times, because these metrics alone provide an incomplete picture. Therefore the round trip time (RTT) metric is also included in this chart. RTT metrics are a good indicator of how your network is performing. If you see high transfer or processing times, but the RTT is low, the issue is probably at the device-level. However, if the RTT, processing, and transfer times are all high, network latency might be affecting the transfer and processing times, and the issue might be with the network.
The RTT metric can help identify the source of the problem because it only measures how long an immediate acknowledgment takes to be sent from the client or server; it does not wait until all packets are delivered.
The ExtraHop system calculates the RTT value by measuring the time between the first packet of a request and the acknowledgment from the server, as shown in the following figure:
The request transfer time might be high because the client took a long time to transmit the request (possibly because the request was very large); however, the transfer time could also be high because the request took a long time to travel on the network (possibly because of network congestion).
Learn more about how the ExtraHop system calculates round trip time on the ExtraHop blog.
Metric Description Request Transfer Time The time between when the ExtraHop system detected the first packet and the last packet of a Kerberos request. A high number might indicate a large request or network delay. Server Processing Time The time taken for a Kerberos server to send the first packet of a response after receiving the last packet of a request. Response Transfer Time The time between when the ExtraHop system detected the first packet and the last packet of a Kerberos response. A high number might indicate a large response or network delay. Round Trip Time The length of time taken for the Kerberos server or client to receive an acknowledgment after sending the last packet over the TCP connection. A long round trip time (RTT) indicates network latency. The Performance (95th percentile) chart shows the highest value for a time period while filtering outliers; the 95th percentile is the highest value that falls below 95% of the values for a sample period. By displaying the 95th value, rather than the true maximum, the chart gives you a more accurate view of the data:
- Performance (95th)
-
This chart shows the 95th percentile of timing
metrics, measured in milliseconds. If an application is acting slow, performance
summary metrics can help you figure out whether the network or servers are causing the
issue. These metrics show the 95th percentile of time that servers took to process
requests from clients versus the 95th percentile time that packets from those requests
(and their respective responses) took to be transmitted across the network. High
server processing times indicate that clients are contacting slow servers. High TCP
round trip times indicate that clients are communicating over slow networks.
Metric Description Server Processing Time The time taken for a Kerberos server to send the first packet of a response after receiving the last packet of a request. Round Trip Time The length of time taken for the Kerberos server or client to receive an acknowledgment after sending the last packet over the TCP connection. A long round trip time (RTT) indicates network latency.
Kerberos Details
The following charts are available in this region:
- Top Request Message Types
- This chart shows which Kerberos message types the application sent the most by breaking out the total number of requests the application sent by message type.
- Top Response Message Types
- This chart shows which Kerberos message types the client received the most by breaking out the total number of responses the client received by message type.
- Top Error Types
- This chart shows which Kerberos error types the client received the most by breaking out the number of responses returned to the client by error type.
Kerberos Performance
The following charts are available in this region:
- Server Processing Time Distribution
-
This chart breaks out server processing times in a histogram to
show the most common processing times, measured in milliseconds.
Metric Description Server Processing Time The time taken for a Kerberos server to send the first packet of a response after receiving the last packet of a request. - Server Processing Time
-
This chart shows the median processing time for the
application, measured in milliseconds.
Metric Description Server Processing Time The time taken for a Kerberos server to send the first packet of a response after receiving the last packet of a request. - Round Trip Time Distribution
-
This chart breaks out round trip times in a histogram to show the
most common round trip times, measured in milliseconds.
Metric Description Round Trip Time The length of time taken for the Kerberos server or client to receive an acknowledgment after sending the last packet over the TCP connection. A long round trip time (RTT) indicates network latency. - Round Trip Time
-
This chart shows the median round trip time for the application,
measured in milliseconds.
Metric Description Round Trip Time The length of time taken for the Kerberos server or client to receive an acknowledgment after sending the last packet over the TCP connection. A long round trip time (RTT) indicates network latency.
Network Data
This region shows you TCP information that is related to the current protocol. In general, host stalls indicate that there is an issue with either a server or a client, and network stalls indicate that there is an issue with the network.
- Host Stalls
-
This chart shows the number of zero windows that were
associated with an application. Devices control the amount of data they receive by
specifying the number of packets that can be sent to them over a given time period.
When a device is sent more data than it can process, the device advertises a zero
window to ask its peer device to stop sending packets completely until the device
catches up. If you see a large number of zero windows, a server or client might not be
not fast enough to support the amount of data being received.
Metric Definition Request Zero Windows The number of Zero Window advertisements that were sent by Kerberos clients. A device advertises a Zero Window when incoming data is arriving too quickly to be processed. A large number of incoming Zero Windows indicates that a peer device was too slow to process the amount of data received.
Response Zero Windows The number of Zero Window advertisements that were sent by servers while receiving Kerberos requests. A device advertises a Zero Window when incoming data is arriving too quickly to be processed. A large number of outgoing Zero Windows indicates that a client was too slow to process the amount of data received.
- Total Host Stalls
- This chart shows the median number of zero window advertisements sent by devices.
- Network Stalls
-
This chart shows the number of retransmission
timeouts that occurred. Retransmission timeouts (RTOs) occur when a network drops too
many packets, usually due to packet collisions or buffer exhaustion. If a device sends
a request or response and does not receive confirmation within a specified amount of
time, the device retransmits the request. If too many retransmissions are
unacknowledged, an RTO occurs. If you see a large number of RTOs, the network might be
too slow to support the current level of activity.
Metric Definition RTOs In The number of retransmission timeouts that were caused by congestion when clients were sending Kerberos requests. An RTO is a 1-5 second stall in the TCP connection flow due to excessive retransmissions. If you see a large number of incoming RTOs, a device did not send an acknowledgment to the server quickly enough, or the network might be too slow to support the current level of activity. Depending on the timeout value configured in the operating system, this delay can be anywhere from 1 to 8 seconds.
RTOs Out The number of retransmission timeouts that were caused by congestion when servers were sending Kerberos responses. An RTO is a 1-5 second stall in the TCP connection flow due to excessive retransmissions. If you see a large number of outgoing RTOs, a device did not receive an acknowledgment from the server quickly enough, or the network might be too slow to support the current level of activity. Depending on the timeout value configured in the operating system, this delay can be anywhere from 1 to 8 seconds.
- Total Network Stalls
-
This chart shows the median number of
retransmission timeouts caused by congestion when clients and servers were sending
requests.
Metric Definition RTOs In The number of retransmission timeouts that were caused by congestion when clients were sending Kerberos requests. An RTO is a 1-5 second stall in the TCP connection flow due to excessive retransmissions. If you see a large number of incoming RTOs, a device did not send an acknowledgment to the server quickly enough, or the network might be too slow to support the current level of activity. Depending on the timeout value configured in the operating system, this delay can be anywhere from 1 to 8 seconds.
RTOs Out The number of retransmission timeouts that were caused by congestion when servers were sending Kerberos responses. An RTO is a 1-5 second stall in the TCP connection flow due to excessive retransmissions. If you see a large number of outgoing RTOs, a device did not receive an acknowledgment from the server quickly enough, or the network might be too slow to support the current level of activity. Depending on the timeout value configured in the operating system, this delay can be anywhere from 1 to 8 seconds.
Kerberos Metric Totals
The following charts are available in this region:
- Total Requests and Responses
-
Requests and responses represent the conversation taking place between clients and servers. If there are more requests than responses, clients might be sending more requests than servers can handle or the network might be too slow. To identify whether the issue is with the network or a server, check RTOs and zero windows in the Network Data section.
Note: It is unlikely that the total number of Kerberos requests and responses will be exactly equal, even in a healthy environment. For example, you might be viewing a time period that captures a response to a request that was sent before the start of the time period. In general, the greater the difference between responses and errors, the greater the chance that there is an issue with those transactions. Metric Description Requests The number of requests that were sent by Kerberos clients. Responses The number of responses that were sent by Kerberos servers. Errors The number of Kerberos response errors. - Kerberos Network Metrics
-
Metric Description Request Zero Windows The number of Zero Window advertisements that were sent by Kerberos clients. A device advertises a Zero Window when incoming data is arriving too quickly to be processed. Response Zero Windows The number of Zero Window advertisements that were sent by servers while receiving Kerberos requests. A device advertises a Zero Window when incoming data is arriving too quickly to be processed. Request RTOs The number of retransmission timeouts that were caused by congestion when clients were sending Kerberos requests. An RTO is a 1-5 second stall in the TCP connection flow due to excessive retransmissions. Response RTOs The number of retransmission timeouts that were caused by congestion when servers were sending Kerberos responses. An RTO is a 1-5 second stall in the TCP connection flow due to excessive retransmissions. Request L2 Bytes The number of L2 bytes that were sent by Kerberos clients that were associated with Kerberos requests. Response L2 Bytes The number of L2 bytes that were associated with Kerberos responses. Request Goodput Bytes The number of goodput bytes associated with Kerberos requests. Goodput refers to the throughput of the original data transferred and excludes other throughput such as protocol headers or retransmitted packets. Response Goodput Bytes The number of goodput bytes associated with Kerberos responses. Goodput refers to the throughput of the original data transferred and excludes other throughput such as protocol headers or retransmitted packets. Request Packets The number of packets that were sent by Kerberos clients that were associated with Kerberos requests. Response Packets The number of packets associated with responses that were sent by Kerberos servers.
Kerberos client page
This page displays metric charts of Kerberos traffic associated with a device on your network.
- Learn about charts on this page:
- Learn about Kerberos security considerations
- Learn about working with metrics.
Kerberos Summary
The following charts are available in this region:
- Transactions
- This chart shows you when Kerberos errors occurred and how many responses the Kerberos
client received. This information can help you see how active the client was at the time
it received the errors.
If you see a large number of errors, you can view details about each error, including the error code. However, if the number of errors is low, the issue might be more complex, and you should examine the ratio of requests to responses. In a healthy environment, the number of requests and responses should be roughly equal. For more information, see Requests and Responses.
Tip: To drill down by error code, click Errors and select Error from the menu. Metric Description Responses The number of responses that were received by this Kerberos client. Errors The number of response errors that were received by this Kerberos client. - Total Transactions
- This chart displays the total number of Kerberos responses the client received and how
many of those responses contained errors.
Metric Description Responses The number of responses that were received by this Kerberos client. Errors The number of response errors that were received by this Kerberos client. - Performance Summary (95th Percentile)
-
This chart shows the 95th percentile of timing metrics, measured in
milliseconds. The transfer and processing time metrics show parts of a complete
transaction. The request transfer time shows how long the client took to transmit requests
onto the network; the server processing time shows how long servers took to process the
requests; and the response transfer time shows how long servers took to transmit responses
onto the network.
Transfer and processing times are calculated by measuring the time between when the first and last packets of requests and responses are seen by the ExtraHop system, as shown in the following figure:
It can be difficult to tell whether an issue is caused by a network or a device from looking only at transfer and processing times, because these metrics alone provide an incomplete picture. Therefore the round trip time (RTT) metric is also included in this chart. RTT metrics are a good indicator of how your network is performing. If you see high transfer or processing times, but the RTT is low, the issue is probably at the device-level. However, if the RTT, processing, and transfer times are all high, network latency might be affecting the transfer and processing times, and the issue might be with the network.
The RTT metric can help identify the source of the problem because it only measures how long an immediate acknowledgment takes to be sent from the client or server; it does not wait until all packets are delivered.
The ExtraHop system calculates the RTT value by measuring the time between the first packet of a request and the acknowledgment from the server, as shown in the following figure:
The request transfer time might be high because the client took a long time to transmit the request (possibly because the request was very large); however, the transfer time could also be high because the request took a long time to travel on the network (possibly because of network congestion).
Learn more about how the ExtraHop system calculates round trip time on the ExtraHop blog.
Request Transfer Time The time between when the ExtraHop system detected the first packet and the last packet of a request that was sent by this Kerberos client. A high number might indicate a large request or network delay. Server Processing Time The time taken for this Kerberos client to receive the first packet of a response after sending the last packet of a request. Response Transfer Time The time between when the ExtraHop system detected the first packet and the last packet of a response that was sent to this Kerberos client. High values might indicate a large response or network delay. Round Trip Time The time between when a Kerberos client sent a packet that required immediate acknowledgment and when the acknowledgment was received. Round trip time (RTT) is a measurement of network latency. The Performance (95th percentile) chart shows the highest value for a time period while filtering outliers; the 95th percentile is the highest value that falls below 95% of the values for a sample period. By displaying the 95th value, rather than the true maximum, the chart gives you a more accurate view of the data:
- Performance (95th)
-
This chart shows the 95th percentile of timing
metrics, measured in milliseconds. If a client is acting slow, performance summary
metrics can help you figure out whether the network or servers are causing the issue.
These metrics show the 95th percentile amount of time that servers took to process
requests from the client versus the 95th percentile time that packets from those
requests (and their respective responses) took to be transmitted across the network.
High server processing times indicate that the client is contacting slow servers. High
TCP round trip times indicate that the client is communicating over slow
networks.
Metric Description Server Processing Time The time taken for this Kerberos client to receive the first packet of a response after sending the last packet of a request. Round Trip Time The time between when a Kerberos client sent a packet that required immediate acknowledgment and when the acknowledgment was received. Round trip time (RTT) is a measurement of network latency.
Kerberos Details
The following charts are available in this region:
- Top Client Principal Names
- This chart shows which Kerberos users were most active on this client by breaking out the total number of Kerberos responses returned to the client by Client Principal Name.
- Top Request Message Types
- This chart shows which Kerberos message types the client sent the most by breaking out the total number of requests the client sent by message type.
- Top Error Types
- This chart shows which Kerberos error types the client received the most by breaking out the number of responses returned to the client by error type.
- Top Server Principal Names
- This chart shows which Kerberos services were requested the most by this client by breaking out the total number of Kerberos responses returned to the client by Server Principal Name.
- Top Response Message Types
- This chart shows which Kerberos message types the client received the most by breaking out the total number of responses the client received by message type.
Kerberos Performance
The following charts are available in this region:
- Server Processing Time Distribution
-
This chart breaks out server processing times in a histogram to
show the most common processing times, measured in milliseconds.
Metric Description Server Processing Time The time taken for this Kerberos client to receive the first packet of a response after sending the last packet of a request. - Server Processing Time
-
This chart shows the median processing time for the client,
measured in milliseconds.
Metric Description Server Processing Time The time taken for this Kerberos client to receive the first packet of a response after sending the last packet of a request. - Round Trip Time Distribution
-
This chart breaks out round trip times in a histogram to show the
most common round trip times, measured in milliseconds.
Metric Description Round Trip Time The time between when a Kerberos client sent a packet that required immediate acknowledgment and when the acknowledgment was received. Round trip time (RTT) is a measurement of network latency. - Round Trip Time
-
This chart shows the median round trip time for the client, measured in
milliseconds.
Metric Description Round Trip Time The time between when a Kerberos client sent a packet that required immediate acknowledgment and when the acknowledgment was received. Round trip time (RTT) is a measurement of network latency.
Network Data
This region shows you TCP information that is related to the current protocol. In general, host stalls indicate that there is an issue with either the server or the client, and network stalls indicate that there is an issue with the network.
- Host Stalls
- This chart shows the number of zero windows that were advertised or received by the
device. Devices control the amount of data they receive by specifying the number of
packets that can be sent to them over a given time period. When a device is sent more
data than it can process, the device advertises a zero window to ask its peer device to
stop sending packets completely until the device catches up. If you see a large number
of zero windows, a server or client might not be not fast enough to support the amount
of data being received.
Metric Definition Zero Windows In The number of zero windows that were sent to the device to stop the flow of data over the connection. A device advertises a Zero Window when incoming data is arriving too quickly to be processed. A large number of zero windows in indicates that a peer device was too slow to process the amount of data received.
Zero Windows Out The number of zero windows that were sent from the device to stop the flow of data. A device advertises a Zero Window when incoming data is arriving too quickly to be processed. A large number of zero windows out indicates that the client was too slow to process the amount of data received.
- Network Stalls
-
This chart shows the number of retransmission timeouts that occurred. Retransmission timeouts (RTOs) occur when a network drops too many packets, usually due to packet collisions or buffer exhaustion. If a device sends a request or response and does not receive confirmation within a specified amount of time, the device retransmits the request. If too many retransmissions are unacknowledged, an RTO occurs. If you see a large number of RTOs, the network might be too slow to support the current level of activity.
Metric Definition RTOs In The number of retransmission timeouts (RTOs) caused by network congestion as peers were sending data to the current device. An RTO is a 1-5 second stall in the TCP connection flow due to excessive retransmissions. If you see a large number of RTOs in, the device did not send an acknowledgment to the server quickly enough, or the network might be too slow to support the current level of activity. Depending on the timeout value configured in the operating system, this delay can be anywhere from 1 to 8 seconds.
RTOs Out The number of retransmission timeouts (RTOs) caused by network congestion as the device was sending data to its peers. An RTO is a 1-5 second stall in the TCP connection flow due to excessive retransmissions. If you see a large number of RTOs out, the device did not receive an acknowledgment from the server quickly enough, or the network might be too slow to support the current level of activity. Depending on the timeout value configured in the operating system, this delay can be anywhere from 1 to 8 seconds.
Kerberos Metric Totals
The following charts are available in this region:
- Total Requests and Responses
- Requests and responses represent the conversation taking place between clients and
servers. If there are more requests than responses, the client might be sending more
requests than the servers can handle or the network might be too slow. To identify
whether the issue is with the network or the server, check RTOs and zero windows in the
Network Data
section.
Note: It is unlikely that the total number of Kerberos requests and responses will be exactly equal, even in a healthy environment. For example, you might be viewing a time period that captures a response to a request that was sent before the start of the time period. In general, the greater the difference between responses and errors, the greater the chance that there is an issue with those transactions. Metric Description Requests The number of requests that were sent by this Kerberos client. Responses The number of responses that were received by this Kerberos client. Errors The number of response errors that were received by this Kerberos client.
Kerberos server page
This page displays metric charts of Kerberos traffic associated with a device on your network.
- Learn about charts on this page:
- Learn about Kerberos security considerations
- Learn about working with metrics.
Kerberos Summary
The following charts are available in this region:
- Transactions
- This chart shows you when Kerberos errors occurred and how many Kerberos responses the
server sent. This information can help you see how active the server was at the time it
returned the errors.
If you see a large number of errors, you can view details about each error, including the error code. However, if the number of errors is low, the issue might be more complex, and you should examine the ratio of requests to responses. In a healthy environment, the number of requests and responses should be roughly equal. For more information, see Requests and Responses.
Tip: To drill down by error code, click Errors and select Error from the menu. Metric Description Responses The number of responses that were sent by this Kerberos server. Errors The number of response errors that were sent by this Kerberos server. - Total Transactions
- This chart displays the total number of Kerberos responses the server sent and how
many of those responses contained errors.
Metric Description Responses The number of responses that were sent by this Kerberos server. Errors The number of response errors that were sent by this Kerberos server. - Performance (95th Percentile)
- This chart shows the 95th percentile of timing metrics, measured in milliseconds. The
transfer and processing time metrics show parts of a complete transaction. The request
transfer time shows how long clients took to transmit requests onto the network; the
server processing time shows how long the server took to process the requests; and the
response transfer time shows how long the server took to transmit responses onto the
network.
Transfer and processing times are calculated by measuring the time between when the first and last packets of requests and responses are seen by the ExtraHop system, as shown in the following figure:
It can be difficult to tell whether an issue is caused by a network or a device from looking only at transfer and processing times, because these metrics alone provide an incomplete picture. Therefore the round trip time (RTT) metric is also included in this chart. RTT metrics are a good indicator of how your network is performing. If you see high transfer or processing times, but the RTT is low, the issue is probably at the device-level. However, if the RTT, processing, and transfer times are all high, network latency might be affecting the transfer and processing times, and the issue might be with the network.
The RTT metric can help identify the source of the problem because it only measures how long an immediate acknowledgment takes to be sent from the client or server; it does not wait until all packets are delivered.
The ExtraHop system calculates the RTT value by measuring the time between the first packet of a request and the acknowledgment from the server, as shown in the following figure:
The request transfer time might be high because the client took a long time to transmit the request (possibly because the request was very large); however, the transfer time could also be high because the request took a long time to travel on the network (possibly because of network congestion).
Learn more about how the ExtraHop system calculates round trip time on the ExtraHop blog.
Metric Description Request Transfer Time The time between when the ExtraHop system detected the first packet and the last packet of a request that was sent by this Kerberos client. A high number might indicate a large request or network delay. Server Server Processing Time The time taken to send the first packet of a response after receiving the last packet of a request that was received by this Kerberos server. Server Response Transfer Time The time between when the ExtraHop system detected the first packet and the last packet of a response that was sent by this Kerberos server. A high value might indicate a large response or network delay. Round Trip Time The time between when a Kerberos server sent a packet that required immediate acknowledgment and when the acknowledgment was received. Round trip time (RTT) is a measurement of network latency. The Performance (95th percentile) chart shows the highest value for a time period while filtering outliers; the 95th percentile is the highest value that falls below 95% of the values for a sample period. By displaying the 95th value, rather than the true maximum, the chart gives you a more accurate view of the data:
- Performance Summary (95th Percentile)
- This chart displays the total number of Kerberos responses the client received and how
many of those responses contained errors, measured in milliseconds.
Metric Description Server Processing Time The time taken to send the first packet of a response after receiving the last packet of a request that was received by this Kerberos server. Round Trip Time The time between when a Kerberos server sent a packet that required immediate acknowledgment and when the acknowledgment was received. Round trip time (RTT) is a measurement of network latency.
Kerberos Details
The following charts are available in this region:
- Top Client Principal Names
- This chart shows which Kerberos users were most active on this server by breaking out the total number of Kerberos responses the server sent by Client Principal Name.
- Top Request Message Types
- This chart shows which Kerberos message types the server received the most by breaking out the total number of requests the server received by message type.
- Top Response Message Types
- This chart shows which Kerberos message types the server sent the most by breaking out the total number of responses the server sent by message type.
- Top Server Principal Names
- This chart shows which Kerberos services were requested the most on this server by breaking out the total number of Kerberos responses the server sent by Server Principal Name.
- Top Error Types
- This chart shows which Kerberos error types the server returned the most by breaking out the total number of responses the server sent by error type.
Kerberos Performance
The following charts are available in this region:
- Server Processing Time Distribution
-
This chart breaks out server processing times in a histogram to
show the most common processing times, measured in milliseconds.
Metric Description Server Processing Time The time taken to send the first packet of a response after receiving the last packet of a request that was received by this Kerberos server. - Server Processing Time
-
This chart shows the median processing time for the server,
measured in milliseconds.
Metric Description Server Processing Time The time taken to send the first packet of a response after receiving the last packet of a request that was received by this Kerberos server. - Round Trip Time Distribution
-
This chart breaks out round trip times in a histogram to show the
most common round trip times, measured in milliseconds.
Metric Description Round Trip Time The time between when a Kerberos server sent a packet that required immediate acknowledgment and when the acknowledgment was received. Round trip time (RTT) is a measurement of network latency. - Round Trip Time
-
This chart shows the median round trip time for the client, measured in
milliseconds.
Metric Description Round Trip Time The time between when a Kerberos server sent a packet that required immediate acknowledgment and when the acknowledgment was received. Round trip time (RTT) is a measurement of network latency.
Network Data
This region shows you TCP information that is related to the current protocol. In general, host stalls indicate that there is an issue with either the server or the client, and network stalls indicate that there is an issue with the network.
- Host Stalls
- This chart shows the number of zero windows that were advertised or received by the
device. Devices control the amount of data they receive by specifying the number of
packets that can be sent to them over a given time period. When a device is sent more
data than it can process, the device advertises a zero window to ask its peer device to
stop sending packets completely until the device catches up. If you see a large number
of zero windows, a server or client might not be not fast enough to support the amount
of data being received.
Metric Definition Zero Windows In The number of zero windows that were sent to the device to stop the flow of data over the connection. A device advertises a Zero Window when incoming data is arriving too quickly to be processed. A large number of zero windows in indicates that a peer device was too slow to process the amount of data received.
Zero Windows Out The number of zero windows that were sent from the device to stop the flow of data. A device advertises a Zero Window when incoming data is arriving too quickly to be processed. A large number of zero windows out indicates that the client was too slow to process the amount of data received.
- Network Stalls
-
This chart shows the number of retransmission timeouts that occurred. Retransmission timeouts (RTOs) occur when a network drops too many packets, usually due to packet collisions or buffer exhaustion. If a device sends a request or response and does not receive confirmation within a specified amount of time, the device retransmits the request. If too many retransmissions are unacknowledged, an RTO occurs. If you see a large number of RTOs, the network might be too slow to support the current level of activity.
Metric Definition RTOs In The number of retransmission timeouts (RTOs) caused by network congestion as peers were sending data to the current device. An RTO is a 1-5 second stall in the TCP connection flow due to excessive retransmissions. If you see a large number of RTOs in, the device did not send an acknowledgment to the server quickly enough, or the network might be too slow to support the current level of activity. Depending on the timeout value configured in the operating system, this delay can be anywhere from 1 to 8 seconds.
RTOs Out The number of retransmission timeouts (RTOs) caused by network congestion as the device was sending data to its peers. An RTO is a 1-5 second stall in the TCP connection flow due to excessive retransmissions. If you see a large number of RTOs out, the device did not receive an acknowledgment from the server quickly enough, or the network might be too slow to support the current level of activity. Depending on the timeout value configured in the operating system, this delay can be anywhere from 1 to 8 seconds.
Kerberos Metric Totals
The following charts are available in this region:
- Total Requests and Responses
- Requests and responses represent the conversation taking place between clients and
servers. If there are more requests than responses, clients might be sending more
requests than the server can handle or the network might be too slow. To identify
whether the issue is with the network or the server, check RTOs and zero windows in the
Network Data
section.
Note: It is unlikely that the total number of Kerberos requests and responses will be exactly equal, even in a healthy environment. For example, you might be viewing a time period that captures a response to a request that was sent before the start of the time period. In general, the greater the difference between responses and errors, the greater the chance that there is an issue with those transactions. Metric Description Requests The number of requests that were received by this Kerberos server. Responses The number of responses that were sent by this Kerberos server. Errors The number of response errors that were sent by this Kerberos server.
Kerberos client group page
This page displays metric charts of Kerberos traffic associated with a device group on your network.
- Learn about charts on this page:
- Learn about Kerberos security considerations
- Learn about working with metrics.
Kerberos Summary for Group
The following charts are available in this region:
- Transactions
- This chart shows you when Kerberos errors occurred and how many responses the Kerberos
clients received. This information can help you see how active the clients were at the
time they received the errors.
If you see a large number of errors, you can view details about each error, including the error code. However, if the number of errors is low, the issue might be more complex, and you should examine the ratio of Kerberos requests to Kerberos responses. In a healthy environment, the number of requests and responses should be roughly equal. For more information, see the Kerberos Metrics for Group chart.
Tip: To drill down by error code, click Errors and select Error from the menu. Metric Description Responses The number of responses that were received by this Kerberos client. Errors The number of response errors that were received by this Kerberos client. - Total Transactions
- This chart shows you how many Kerberos responses the clients received and how many of
those responses contained errors.
Metric Description Responses The number of responses that were received by this Kerberos client. Errors The number of response errors that were received by this Kerberos client.
Kerberos Details for Group
The following charts are available in this region:
- Top Group Members (Kerberos Clients)
- This chart shows which Kerberos clients in the group were most active by breaking out the total number of Kerberos requests the group sent by client.
- Top Client Principal Names
- This chart shows which Kerberos users were most active on clients in the group by breaking out the total number of Kerberos responses the group received by Client Principal Name.
- Top Request Message Types
- This chart shows which Kerberos message types the group sent the most by breaking out the total number of requests the group sent by message type.
- Top Error Types
- This chart shows which Kerberos error types the group received the most by breaking out the number of responses returned to the group by error type.
- Top Server Principal Names
- This chart shows which Kerberos services were requested by clients in the group by breaking out the total number of Kerberos responses the group received by Server Principal Name.
- Top Response Message Types
- This chart shows which Kerberos message types the group received the most by breaking out the total number of responses the group received by message type.
Kerberos Metrics for Group
The following charts are available in this region:
- Total Requests and Responses
-
Requests
and responses represent the conversation taking place between clients and servers. If there
are more requests than responses, the clients might be sending more requests than servers
can handle or the network might be too slow.
Note: It is unlikely that the total number of requests and responses will be exactly equal, even in a healthy environment. For example, you might be viewing a time period that captures a response to a request that was sent before the start of the time period. In general, the greater the difference between responses and errors, the greater the chance that there is an issue with those transactions. Metric Description Requests The number of requests that were sent by this Kerberos client. Responses The number of responses that were received by this Kerberos client. Errors The number of response errors that were received by this Kerberos client. - Server Processing Time
-
If a client group is acting slow, the server processing time
can help you figure out whether the issue is with the servers. The Server Processing Time
chart shows the median amount of time servers took to process requests from the clients,
measured in milliseconds. High server processing times indicate that the clients are
contacting slow servers.
Metric Description Server Processing Time The time taken for this Kerberos client to receive the first packet of a response after sending the last packet of a request.
Kerberos server group page
This page displays metric charts of Kerberos traffic associated with a device group on your network.
- Learn about charts on this page:
- Learn about Kerberos security considerations
- Learn about working with metrics.
Kerberos Summary for Group
The following charts are available in this region:
- Transactions
- This chart shows you when Kerberos errors occurred and how many Kerberos responses the
servers sent. This information can help you see how active the servers were at the time
they returned the errors.
If you see a large number of errors, you can view details about each error, including the error code. However, if the number of errors is low, the issue might be more complex, and you should examine the ratio of Kerberos requests to Kerberos responses. In a healthy environment, the number of requests and responses should be roughly equal. For more information, see the Kerberos Metrics for Group chart.
Tip: To drill down by error code, click Errors and select Error from the menu. Metric Description Responses The number of responses that were sent by this Kerberos server. Errors The number of response errors that were sent by this Kerberos server. - Total Transactions
- This chart shows you how many Kerberos responses servers in the group sent and how
many of those responses contained errors.
Metric Description Responses The number of responses that were sent by this Kerberos server. Errors The number of response errors that were sent by this Kerberos server.
Kerberos Details for Group
The following charts are available in this region:
- Top Group Members (Kerberos Servers)
- This chart shows which Kerberos servers in the group were most active by breaking out the total number of Kerberos responses the group sent by server.
- Top Client Principal Names
- This chart shows which Kerberos users were most active on servers in the group by breaking out the total number of Kerberos responses the group sent by Client Principal Name.
- Top Request Message Types
- This chart shows which Kerberos message types servers in the group received the most by breaking out the total number of requests the group received by message type.
- Top Error Types
- This chart shows which Kerberos error types servers in the group returned the most by breaking out the total number of responses the group sent by error type.
- Top Server Principal Names
- This chart shows which Kerberos services were requested the most on servers in the group by breaking out the total number of Kerberos responses the group sent by Service Principal Name.
- Top Response Message Types
- This chart shows which Kerberos message types the server sent the most by breaking out the total number of responses servers in the group sent by message type.
Kerberos Metrics for Group
The following charts are available in this region:
- Total Requests and Responses
-
Requests
and responses represent the conversation taking place between clients and servers. If there
are more requests than responses, clients might be sending more requests than the servers
can handle or the network might be too slow.
Note: It is unlikely that the total number of requests and responses will be exactly equal, even in a healthy environment. For example, you might be viewing a time period that captures a response to a request that was sent before the start of the time period. In general, the greater the difference between responses and errors, the greater the chance that there is an issue with those transactions. Metric Description Requests The number of requests that were received by this Kerberos server. Responses The number of responses that were sent by this Kerberos server. Errors The number of response errors that were sent by this Kerberos server. - Server Processing Time
-
The Server Processing Time chart shows the median amount of
time the servers took to process requests from clients, measured in milliseconds. High
server processing times indicate that the servers in a group are slow.
Metric Description Server Processing Time The time taken to send the first packet of a response after receiving the last packet of a request that was received by this Kerberos server.
LDAP
The ExtraHop system collects metrics about Lightweight Directory Access Protocol (LDAP) activity. is a vendor-neutral protocol that maintains and provides easy access to a distributed directory. Read the ExtraHop blog post: What Is LDAP, and Who Needs It Anyway?
Security considerations
- LDAP queries can enable enumeration, which is a reconnaissance technique that helps attackers discover account information.
- Attack tools, such as BloodHound, submit LDAP queries to enumerate Active Directory objects, such as users, domain admins, workstations, and domain controllers, which can become future targets.
- Unencrypted LDAP connections might expose sensitive data to attackers that intercept LDAP traffic.
LDAP application page
This page displays metric charts of LDAP traffic associated with an application container on your network.
- Learn about charts on this page:
- Learn about LDAP security considerations
- Learn about working with metrics.
LDAP Summary
The following charts are available in this region:
- Transactions
- This chart shows you when LDAP errors and responses were associated with the
application. This information can help you see how active the application was at the
time the errors occurred.
In a healthy environment, the number of requests and responses should be roughly equal. For more information, see Requests and Responses.
Metric Description Responses The number of LDAP responses associated with this application. Errors The number of LDAP responses with result codes that indicate an error occurred. Responses with non-error result codes, such as success and referral, are not included. - Total Transactions
- This chart displays the total number of LDAP responses that were associated with the
application and how many of those responses contained errors.
Metric Description Responses The number of LDAP responses associated with this application. Errors The number of LDAP responses with result codes that indicate an error occurred. Responses with non-error result codes, such as success and referral, are not included. - Performance (95th Percentile)
-
This chart shows the 95th percentile of timing metrics,
measured in milliseconds. The transfer and processing time metrics show parts of a
complete transaction. The request transfer time shows how long clients took to transmit
requests onto the network; the server processing time shows how long the servers took to
process requests; and the response transfer time shows how long the servers took to
transmit responses onto the network.
Transfer and processing times are calculated by measuring the time between when the first and last packets of requests and responses are seen by the ExtraHop system, as shown in the following figure:
It can be difficult to tell whether an issue is caused by a network or a device from looking only at transfer and processing times, because these metrics alone provide an incomplete picture. Therefore the round trip time (RTT) metric is also included in this chart. RTT metrics are a good indicator of how your network is performing. If you see high transfer or processing times, but the RTT is low, the issue is probably at the device-level. However, if the RTT, processing, and transfer times are all high, network latency might be affecting the transfer and processing times, and the issue might be with the network.
The RTT metric can help identify the source of the problem because it only measures how long an immediate acknowledgment takes to be sent from the client or server; it does not wait until all packets are delivered.
The ExtraHop system calculates the RTT value by measuring the time between the first packet of a request and the acknowledgment from the server, as shown in the following figure:
The request transfer time might be high because the client took a long time to transmit the request (possibly because the request was very large); however, the transfer time could also be high because the request took a long time to travel on the network (possibly because of network congestion).
Learn more about how the ExtraHop system calculates round trip time on the ExtraHop blog.
Metric Description Request Transfer Time The time between the ExtraHop system detecting the first packet and last packet of LDAP requests. A high number might indicate a large request or network delay. Server Processing Time The time it took for devices to send the first packet in a response after receiving the last packet of the request. A long server processing time can indicate server-side latency. Response Transfer Time The time between the ExtraHop system detecting the first packet and last packet of LDAP responses. A high number might indicate a large response or network delay. Round Trip Time The time it took for the LDAP server or client to send a packet and receive an immediate acknowledgment (ACK). A long round trip time (RTT) indicates network latency. The Performance (95th percentile) chart shows the highest value for a time period while filtering outliers; the 95th percentile is the highest value that falls below 95% of the values for a sample period. By displaying the 95th value, rather than the true maximum, the chart gives you a more accurate view of the data:
- Performance (95th)
-
This chart shows the 95th percentile of timing
metrics, measured in milliseconds. If an application is acting slow, performance
summary metrics can help you figure out whether the network or servers are causing the
issue. These metrics show the 95th percentile of time that servers took to process
requests from clients versus the 95th percentile time that packets from those requests
(and their respective responses) took to be transmitted across the network. High
server processing times indicate that clients are contacting slow servers. High TCP
round trip times indicate that clients are communicating over slow networks.
Metric Description Server Processing Time The time it took for devices to send the first packet in a response after receiving the last packet of the request. A long server processing time can indicate server-side latency. Round Trip Time The time it took for the LDAP server or client to send a packet and receive an immediate acknowledgment (ACK). A long round trip time (RTT) indicates network latency.
LDAP Details
The following charts are available in this region:
- Top Clients
- This chart shows which LDAP clients the application was communicating with the most by breaking out the total number of requests the application received.
- Top Bind Distinguished Names
- This chart shows which users were active on the application the most by breaking out the total number of LDAP requests by username.
- Top Error Codes
- This chart shows which LDAP error codes the application returned the most by breaking out the number of responses the application returned by error code.
- Top SASL Authentication Mechanisms
- This chart shows which SASL mechanism the application authenticated over the most by breaking out the total number of LDAP requests by authentication mechanism.
- Top Methods
- This chart shows which LDAP methods were associated with the application by breaking out the total number of LDAP requests by method.
LDAP Performance
The following charts are available in this region:
- Server Processing Time Distribution
-
This chart breaks out server processing times in a histogram to
show the most common processing times, measured in milliseconds.
Metric Description Server Processing Time The time it took for devices to send the first packet in a response after receiving the last packet of the request. A long server processing time can indicate server-side latency. - Server Processing Time
-
This chart shows the median processing time for the
application, measured in milliseconds.
Metric Description Server Processing Time The time it took for devices to send the first packet in a response after receiving the last packet of the request. A long server processing time can indicate server-side latency. - Round Trip Time Distribution
-
This chart breaks out round trip times in a histogram to show the
most common round trip times, measured in milliseconds.
Metric Description Round Trip Time The time it took for the LDAP server or client to send a packet and receive an immediate acknowledgment (ACK). A long round trip time (RTT) indicates network latency. - Round Trip Time
-
This chart shows the median round trip time for the application,
measured in milliseconds.
Metric Description Round Trip Time The time it took for the LDAP server or client to send a packet and receive an immediate acknowledgment (ACK). A long round trip time (RTT) indicates network latency.
Network Data
This region shows you TCP information that is related to the current protocol. In general, host stalls indicate that there is an issue with either a server or a client, and network stalls indicate that there is an issue with the network.
- Host Stalls
-
This chart shows the number of zero windows that were
associated with an application. Devices control the amount of data they receive by
specifying the number of packets that can be sent to them over a given time period.
When a device is sent more data than it can process, the device advertises a zero
window to ask its peer device to stop sending packets completely until the device
catches up. If you see a large number of zero windows, a server or client might not be
not fast enough to support the amount of data being received.
Metric Definition Request Zero Windows The number of zero window advertisements sent by LDAP clients. A device advertises a Zero Window when incoming data is arriving too quickly to be processed. A large number of incoming Zero Windows indicates that a peer device was too slow to process the amount of data received.
Response Zero Windows The number of zero window advertisements sent by servers while receiving LDAP requests. A device advertises a Zero Window when incoming data is arriving too quickly to be processed. A large number of outgoing Zero Windows indicates that a client was too slow to process the amount of data received.
- Total Host Stalls
- This chart shows the median number of zero window advertisements sent by devices.
- Network Stalls
-
This chart shows the number of retransmission
timeouts that occurred. Retransmission timeouts (RTOs) occur when a network drops too
many packets, usually due to packet collisions or buffer exhaustion. If a device sends
a request or response and does not receive confirmation within a specified amount of
time, the device retransmits the request. If too many retransmissions are
unacknowledged, an RTO occurs. If you see a large number of RTOs, the network might be
too slow to support the current level of activity.
Metric Definition RTOs In The number of retransmission timeouts caused by congestion when clients were sending LDAP requests. An RTO is a 1-5 second stall in the TCP connection flow due to excessive retransmissions. If you see a large number of incoming RTOs, a device did not send an acknowledgment to the server quickly enough, or the network might be too slow to support the current level of activity. Depending on the timeout value configured in the operating system, this delay can be anywhere from 1 to 8 seconds.
RTOs Out The number of retransmission timeouts caused by congestion when servers were sending LDAP responses. An RTO is a 1-5 second stall in the TCP connection flow due to excessive retransmissions. If you see a large number of outgoing RTOs, a device did not receive an acknowledgment from the server quickly enough, or the network might be too slow to support the current level of activity. Depending on the timeout value configured in the operating system, this delay can be anywhere from 1 to 8 seconds.
- Total Network Stalls
-
This chart shows the median number of
retransmission timeouts caused by congestion when clients and servers were sending
requests.
Metric Definition RTOs In The number of retransmission timeouts caused by congestion when clients were sending LDAP requests. An RTO is a 1-5 second stall in the TCP connection flow due to excessive retransmissions. If you see a large number of incoming RTOs, a device did not send an acknowledgment to the server quickly enough, or the network might be too slow to support the current level of activity. Depending on the timeout value configured in the operating system, this delay can be anywhere from 1 to 8 seconds.
RTOs Out The number of retransmission timeouts caused by congestion when servers were sending LDAP responses. An RTO is a 1-5 second stall in the TCP connection flow due to excessive retransmissions. If you see a large number of outgoing RTOs, a device did not receive an acknowledgment from the server quickly enough, or the network might be too slow to support the current level of activity. Depending on the timeout value configured in the operating system, this delay can be anywhere from 1 to 8 seconds.
LDAP Metric Totals
The following charts are available in this region:
- Total Requests and Responses
-
Requests and responses represent the conversation taking place between clients and servers. If there are more requests than responses, clients might be sending more requests than servers can handle or the network might be too slow. To identify whether the issue is with the network or a server, check RTOs and zero windows in the Network Data section.
Note: It is unlikely that the total number of LDAP requests and responses will be exactly equal, even in a healthy environment. For example, you might be viewing a time period that captures a response to a request that was sent before the start of the time period. In general, the greater the difference between responses and errors, the greater the chance that there is an issue with those transactions. Metric Description Requests The number of LDAP requests associated with this application. Responses The number of LDAP responses associated with this application. Errors The number of LDAP responses with result codes that indicate an error occurred. Responses with non-error result codes, such as success and referral, are not included. Request RTOs The number of retransmission timeouts caused by congestion when clients were sending LDAP requests. An RTO is a 1-5 second stall in the TCP connection flow due to excessive retransmissions. Response RTOs The number of retransmission timeouts caused by congestion when servers were sending LDAP responses. An RTO is a 1-5 second stall in the TCP connection flow due to excessive retransmissions. Request Zero Windows The number of zero window advertisements sent by LDAP clients. A device advertises a Zero Window when incoming data is arriving too quickly to be processed. Response Zero Windows The number of zero window advertisements sent by servers while receiving LDAP requests. A device advertises a Zero Window when incoming data is arriving too quickly to be processed. Request L2 Bytes The number of L2 bytes associated with LDAP requests. Response L2 Bytes The number of L2 bytes associated with LDAP responses. Request Goodput Bytes The number of goodput bytes associated with LDAP requests. Goodput refers to the throughput of the original data transferred and excludes other throughput such as protocol headers or retransmitted packets. Response Goodput Bytes The number of goodput bytes associated with LDAP responses. Goodput refers to the throughput of the original data transferred and excludes other throughput such as protocol headers or retransmitted packets. Request Packets The number of packets associated with LDAP requests. Response Packets The number of packets associated with LDAP responses. - LDAP Network Metrics
-
Metric Description Plain Text Messages The number of plain-text messages exchanged that are associated with this application. SASL Messages The number of encrypted messages exchanged that are associated with this application.
LDAP client page
This page displays metric charts of LDAP traffic associated with a device on your network.
- Learn about charts on this page:
- Learn about LDAP security considerations
- Learn about working with metrics.
LDAP Summary
The following charts are available in this region:
- Transactions
- This chart shows you when LDAP errors occurred and how many responses the LDAP client
received. This information can help you see how active the client was at the time it
received the errors.
If you see a large number of errors, you can view details about each error, including the error code. However, if the number of errors is low, the issue might be more complex, and you should examine the ratio of requests to responses. In a healthy environment, the number of requests and responses should be roughly equal. For more information, see Requests and Responses.
Tip: To see which error codes were returned to the client, click Responses and select Error Code from the menu. Metric Description Responses The number of responses received by this LDAP client. Errors The number of responses received by this LDAP client that indicated an error occurred. Responses with non-error result codes, such as success and referral, are not included. - Total Transactions
- This chart displays the total number of LDAP responses the client received and how
many of those responses contained errors.
Metric Description Responses The number of responses received by this LDAP client. Errors The number of responses received by this LDAP client that indicated an error occurred. Responses with non-error result codes, such as success and referral, are not included. - Performance Summary (95th Percentile)
- This chart shows the 95th percentile of timing metrics, measured in milliseconds. The
server processing time shows how long servers took to process requests from clients.
Processing times are calculated by measuring the time between when the first and last
packets of requests and responses are seen by the ExtraHop system, as shown in the
following figure:
It can be difficult to tell whether an issue is caused by a network or a device from looking only at the processing time, because this metric alone provides an incomplete picture. Therefore the round trip time (RTT) metric is also included in this chart. RTT metrics are a good indicator of how your network is performing. If you see high processing times, but the RTT is low, the issue is probably at the device-level. However, if the RTT and processing times are both high, network latency might be affecting the transfer and processing times, and the issue might be with the network.
RTT only measures how long an immediate acknowledgment takes to be sent; it does not wait until all packets are delivered. Therefore, RTT is a good indicator of how your network is performing. If you see high processing times, but the TCP RTT is low, the issue is probably at the device-level. Check the network for latency issues if the TCP RTT and processing times are all both.
The RTT metric can help identify the source of the problem because it only measures how long an immediate acknowledgment takes to be sent from the client or server; it does not wait until all packets are delivered.
The processing time might be high because the server took a long time to transmit the response (possibly because the response was very large); however, the processing time could also be high because the response took a long time to travel on the network (possibly because of network congestion).
Learn more about how the ExtraHop system calculates round trip time on the ExtraHop blog.
Metric Description Request Transfer Time When the device is acting as an LDAP client, the time between the ExtraHop system detecting the first packet and last packet of sent requests. A high number might indicate a large request or network delay. Server Processing Time The time it took for the device to receive the first packet in response after sending the last packet of the request. A long server processing time can indicate server-side latency. Response Transfer Time When the device is acting as an LDAP client, the time between the ExtraHop system detecting the first packet and last packet of received responses. A high number might indicate a large request or network delay. Round Trip Time The time between when an LDAP client sent a packet that required an immediate acknowledgment and when the client received the acknowledgment. Round trip time (RTT) is a measurement of network latency. The Performance (95th percentile) chart shows the highest value for a time period while filtering outliers; the 95th percentile is the highest value that falls below 95% of the values for a sample period. By displaying the 95th value, rather than the true maximum, the chart gives you a more accurate view of the data:
- Performance (95th)
-
This chart shows the 95th percentile of timing
metrics, measured in milliseconds. If a client is acting slow, performance summary
metrics can help you figure out whether the network or servers are causing the issue.
These metrics show the 95th percentile amount of time that servers took to process
requests from the client versus the 95th percentile time that packets from those
requests (and their respective responses) took to be transmitted across the network.
High server processing times indicate that the client is contacting slow servers. High
TCP round trip times indicate that the client is communicating over slow
networks.
Metric Description Server Processing Time The time it took for the device to receive the first packet in response after sending the last packet of the request. A long server processing time can indicate server-side latency. Round Trip Time The time between when an LDAP client sent a packet that required an immediate acknowledgment and when the client received the acknowledgment. Round trip time (RTT) is a measurement of network latency.
LDAP Details
The following charts are available in this region:
- Top Servers
- This chart shows which LDAP servers the client was communicating with the most by breaking out the total number of requests the client sent by server.
- Top Bind Distinguished Names
- This chart shows which users were active on the client the most by breaking out the total number of requests the client sent by username.
- Top Error Codes
- This chart shows which LDAP error codes the client received the most by breaking out the number of responses returned to the client by error code.
- Top SASL Authentication Mechanisms
- This chart shows which SASL mechanism the client authenticated over the most by breaking out the total number of requests the client sent by authentication mechanism.
- Top Messages
- This chart shows which LDAP messages the client received the most by breaking out the number of responses returned to the client by message.
LDAP Performance
The following charts are available in this region:
- Server Processing Time Distribution
-
This chart breaks out server processing times in a histogram to
show the most common processing times, measured in milliseconds.
Metric Description Server Processing Time The time it took for the device to receive the first packet in response after sending the last packet of the request. A long server processing time can indicate server-side latency. - Server Processing Time
-
This chart shows the median processing time for the client,
measured in milliseconds.
Metric Description Server Processing Time The time it took for the device to receive the first packet in response after sending the last packet of the request. A long server processing time can indicate server-side latency. - Round Trip Time Distribution
-
This chart breaks out round trip times in a histogram to show the
most common round trip times, measured in milliseconds.
Metric Description Round Trip Time The time between when an LDAP client sent a packet that required an immediate acknowledgment and when the client received the acknowledgment. Round trip time (RTT) is a measurement of network latency. - Round Trip Time
-
This chart shows the median round trip time for the client, measured in
milliseconds.
Metric Description Round Trip Time The time between when an LDAP client sent a packet that required an immediate acknowledgment and when the client received the acknowledgment. Round trip time (RTT) is a measurement of network latency.
Network Data
This region shows you TCP information that is related to the current protocol. In general, host stalls indicate that there is an issue with either the server or the client, and network stalls indicate that there is an issue with the network.
- Host Stalls
- This chart shows the number of zero windows that were advertised or received by the
device. Devices control the amount of data they receive by specifying the number of
packets that can be sent to them over a given time period. When a device is sent more
data than it can process, the device advertises a zero window to ask its peer device to
stop sending packets completely until the device catches up. If you see a large number
of zero windows, a server or client might not be not fast enough to support the amount
of data being received.
Metric Definition Zero Windows In The number of zero windows that were sent to the device to stop the flow of data over the connection. A device advertises a Zero Window when incoming data is arriving too quickly to be processed. A large number of zero windows in indicates that a peer device was too slow to process the amount of data received.
Zero Windows Out The number of zero windows that were sent from the device to stop the flow of data. A device advertises a Zero Window when incoming data is arriving too quickly to be processed. A large number of zero windows out indicates that the client was too slow to process the amount of data received.
- Network Stalls
-
This chart shows the number of retransmission timeouts that occurred. Retransmission timeouts (RTOs) occur when a network drops too many packets, usually due to packet collisions or buffer exhaustion. If a device sends a request or response and does not receive confirmation within a specified amount of time, the device retransmits the request. If too many retransmissions are unacknowledged, an RTO occurs. If you see a large number of RTOs, the network might be too slow to support the current level of activity.
Metric Definition RTOs In The number of retransmission timeouts (RTOs) caused by network congestion as peers were sending data to the current device. An RTO is a 1-5 second stall in the TCP connection flow due to excessive retransmissions. If you see a large number of RTOs in, the device did not send an acknowledgment to the server quickly enough, or the network might be too slow to support the current level of activity. Depending on the timeout value configured in the operating system, this delay can be anywhere from 1 to 8 seconds.
RTOs Out The number of retransmission timeouts (RTOs) caused by network congestion as the device was sending data to its peers. An RTO is a 1-5 second stall in the TCP connection flow due to excessive retransmissions. If you see a large number of RTOs out, the device did not receive an acknowledgment from the server quickly enough, or the network might be too slow to support the current level of activity. Depending on the timeout value configured in the operating system, this delay can be anywhere from 1 to 8 seconds.
LDAP Metric Totals
The following charts are available in this region:
- Total Requests and Responses
- Requests and responses represent the conversation taking place between clients and
servers. If there are more requests than responses, the client might be sending more
requests than the servers can handle or the network might be too slow. To identify
whether the issue is with the network or the server, check RTOs and zero windows in the
Network Data
section.
Note: It is unlikely that the total number of LDAP requests and responses will be exactly equal, even in a healthy environment. For example, you might be viewing a time period that captures a response to a request that was sent before the start of the time period. In general, the greater the difference between responses and errors, the greater the chance that there is an issue with those transactions. Metric Description Requests The number of requests sent by this LDAP client. Responses The number of responses received by this LDAP client. Errors The number of responses received by this LDAP client that indicated an error occurred. Responses with non-error result codes, such as success and referral, are not included. - Total Messages
- Displays the total number of messages the client exchanged.
Metric Description Plain Text Messages The number of plain-text messages exchanged by this LDAP client. SASL Messages The number of encrypted messages exchanged by this LDAP client.
LDAP server page
This page displays metric charts of LDAP traffic associated with a device on your network.
- Learn about charts on this page:
- Learn about LDAP security considerations
- Learn about working with metrics.
LDAP Summary
The following charts are available in this region:
- Transactions
- This chart shows you when LDAP errors occurred and how many LDAP responses the server
sent. This information can help you see how active the server was at the time it
returned the errors.
If you see a large number of errors, you can view details about each error, including the error code. However, if the number of errors is low, the issue might be more complex, and you should examine the ratio of requests to responses. In a healthy environment, the number of requests and responses should be roughly equal. For more information, see Requests and Responses.
Tip: To see which error codes were the server sent, click Responses and select Error Code from the menu. Metric Description Responses The number of responses sent by this LDAP server. Errors The number of responses sent by the LDAP server that indicated an error occurred. Responses with non-error LDAP result codes, such as success and referral, are not included. - Total Transactions
- This chart displays the total number of LDAP responses the server sent and how many of
those responses contained errors.
Metric Description Responses The number of responses sent by this LDAP server. Errors The number of responses sent by the LDAP server that indicated an error occurred. Responses with non-error LDAP result codes, such as success and referral, are not included. Plain Text Messages The number of plain-text messages exchanged by this LDAP server. - Performance Summary (95th Percentile)
- This chart shows the 95th percentile of timing metrics, measured in milliseconds. The
server processing time shows how long servers took to process requests from clients.
Processing times are calculated by measuring the time between when the first and last
packets of requests and responses are seen by the ExtraHop system, as shown in the
following figure:
It can be difficult to tell whether an issue is caused by a network or a device from looking only at the processing time, because this metric alone provides an incomplete picture. Therefore the round trip time (RTT) metric is also included in this chart. RTT metrics are a good indicator of how your network is performing. If you see high processing times, but the RTT is low, the issue is probably at the device-level. However, if the RTT and processing times are both high, network latency might be affecting the transfer and processing times, and the issue might be with the network.
RTT only measures how long an immediate acknowledgment takes to be sent; it does not wait until all packets are delivered. Therefore, RTT is a good indicator of how your network is performing. If you see high processing times, but the TCP RTT is low, the issue is probably at the device-level. Check the network for latency issues if the TCP RTT and processing times are all both.
The RTT metric can help identify the source of the problem because it only measures how long an immediate acknowledgment takes to be sent from the client or server; it does not wait until all packets are delivered.
The processing time might be high because the server took a long time to transmit the response (possibly because the response was very large); however, the processing time could also be high because the response took a long time to travel on the network (possibly because of network congestion).
Learn more about how the ExtraHop system calculates round trip time on the ExtraHop blog.
Metric Description LDAP Server Request Transfer Time When the device is acting as an LDAP server, the time between the ExtraHop system detecting the first packet and last packet of sent requests. A high number might indicate a large request or network delay. LDAP Server Server Processing Time The time it took for the device to send the first packet in response after receiving the last packet of the request. A long server processing time can indicate server-side latency. LDAP Server Response Transfer Time When the device is acting as an LDAP server, the time between the ExtraHop system detecting the first packet and last packet of received responses. A high number might indicate a large request or network delay. Round Trip Time The time between when an LDAP server sent a packet that required an immediate acknowledgment and when the server received the acknowledgment. Round trip time (RTT) is a measurement of network latency. The Performance (95th percentile) chart shows the highest value for a time period while filtering outliers; the 95th percentile is the highest value that falls below 95% of the values for a sample period. By displaying the 95th value, rather than the true maximum, the chart gives you a more accurate view of the data:
- Performance (95th)
-
This chart shows the 95th percentile of timing
metrics, measured in milliseconds. If a server is acting slow, performance summary
metrics can help you figure out whether the network or the server is causing the
issue. The performance summary metrics show the 95th percentile amount of time the
server took to process requests from clients versus the 95th percentile time that
packets from those requests (and their respective responses) took to be transmitted
across the network. High server processing times indicate that the server is slow.
High RTTs indicate that the server is communicating over slow networks.
Metric Description LDAP Server Server Processing Time The time it took for the device to send the first packet in response after receiving the last packet of the request. A long server processing time can indicate server-side latency. Round Trip Time The time between when an LDAP server sent a packet that required an immediate acknowledgment and when the server received the acknowledgment. Round trip time (RTT) is a measurement of network latency.
LDAP Details
The following charts are available in this region:
- Top Clients
- This chart shows which LDAP clients the server was communicating with the most by breaking out the total number of requests the server received by client.
- Top Bind Distinguished Names
- This chart shows which users were active on the server the most by breaking out the total number of requests the server received by username.
- Top Error Codes
- This chart shows which LDAP error codes the server returned the most by breaking out the number of responses the server returned by error code.
- Top SASL Authentication Mechanisms
- This chart shows which SASL mechanism the server authenticated over the most by breaking out the total number of requests the server received by authentication mechanism.
- Top Messages
- This chart shows which LDAP messages the server sent the most by breaking out the number of responses the server sent by message.
LDAP Performance
The following charts are available in this region:
- Server Processing Time Distribution
-
This chart breaks out server processing times in a histogram to
show the most common processing times, measured in milliseconds.
Metric Description LDAP Server Server Processing Time The time it took for the device to send the first packet in response after receiving the last packet of the request. A long server processing time can indicate server-side latency. - Server Processing Time
-
This chart shows the median processing time for the server,
measured in milliseconds.
Metric Description LDAP Server Server Processing Time The time it took for the device to send the first packet in response after receiving the last packet of the request. A long server processing time can indicate server-side latency. - Round Trip Time Distribution
-
This chart breaks out round trip times in a histogram to show the
most common round trip times, measured in milliseconds.
Metric Description Round Trip Time The time between when an LDAP server sent a packet that required an immediate acknowledgment and when the server received the acknowledgment. Round trip time (RTT) is a measurement of network latency. - Round Trip Time
-
This chart shows the median round trip time for the client, measured in
milliseconds.
Metric Description Round Trip Time The time between when an LDAP server sent a packet that required an immediate acknowledgment and when the server received the acknowledgment. Round trip time (RTT) is a measurement of network latency.
Network Data
This region shows you TCP information that is related to the current protocol. In general, host stalls indicate that there is an issue with either the server or the client, and network stalls indicate that there is an issue with the network.
- Host Stalls
- This chart shows the number of zero windows that were advertised or received by the
device. Devices control the amount of data they receive by specifying the number of
packets that can be sent to them over a given time period. When a device is sent more
data than it can process, the device advertises a zero window to ask its peer device to
stop sending packets completely until the device catches up. If you see a large number
of zero windows, a server or client might not be not fast enough to support the amount
of data being received.
Metric Definition Zero Windows In The number of zero windows that were sent to the device to stop the flow of data over the connection. A device advertises a Zero Window when incoming data is arriving too quickly to be processed. A large number of zero windows in indicates that a peer device was too slow to process the amount of data received.
Zero Windows Out The number of zero windows that were sent from the device to stop the flow of data. A device advertises a Zero Window when incoming data is arriving too quickly to be processed. A large number of zero windows out indicates that the client was too slow to process the amount of data received.
- Network Stalls
-
This chart shows the number of retransmission timeouts that occurred. Retransmission timeouts (RTOs) occur when a network drops too many packets, usually due to packet collisions or buffer exhaustion. If a device sends a request or response and does not receive confirmation within a specified amount of time, the device retransmits the request. If too many retransmissions are unacknowledged, an RTO occurs. If you see a large number of RTOs, the network might be too slow to support the current level of activity.
Metric Definition RTOs In The number of retransmission timeouts (RTOs) caused by network congestion as peers were sending data to the current device. An RTO is a 1-5 second stall in the TCP connection flow due to excessive retransmissions. If you see a large number of RTOs in, the device did not send an acknowledgment to the server quickly enough, or the network might be too slow to support the current level of activity. Depending on the timeout value configured in the operating system, this delay can be anywhere from 1 to 8 seconds.
RTOs Out The number of retransmission timeouts (RTOs) caused by network congestion as the device was sending data to its peers. An RTO is a 1-5 second stall in the TCP connection flow due to excessive retransmissions. If you see a large number of RTOs out, the device did not receive an acknowledgment from the server quickly enough, or the network might be too slow to support the current level of activity. Depending on the timeout value configured in the operating system, this delay can be anywhere from 1 to 8 seconds.
LDAP Metric Totals
The following charts are available in this region:
- Total Requests and Responses
- Requests and responses represent the conversation taking place between clients and
servers. If there are more requests than responses, clients might be sending more
requests than the server can handle or the network might be too slow. To identify
whether the issue is with the network or the server, check RTOs and zero windows in the
Network Data
section.
Note: It is unlikely that the total number of LDAP requests and responses will be exactly equal, even in a healthy environment. For example, you might be viewing a time period that captures a response to a request that was sent before the start of the time period. In general, the greater the difference between responses and errors, the greater the chance that there is an issue with those transactions. Metric Description Requests The number of requests received by this LDAP server. Responses The number of responses sent by this LDAP server. Errors The number of responses sent by the LDAP server that indicated an error occurred. Responses with non-error LDAP result codes, such as success and referral, are not included. - Total Messages
- Displays the total number of messages the server exchanged.
Metric Description Plain Text Messages The number of plain-text messages exchanged by this LDAP server. SASL Messages The number of encrypted messages exchanged by this LDAP server.
LDAP client group page
This page displays metric charts of LDAP traffic associated with a device group on your network.
- Learn about charts on this page:
- Learn about LDAP security considerations
- Learn about working with metrics.
LDAP Summary for Group
The following charts are available in this region:
- Transactions
- This chart shows you when LDAP errors occurred and how many responses the LDAP clients
received. This information can help you see how active the clients were at the time they
received the errors.
If you see a large number of errors, you can view details about each error, including the error code. However, if the number of errors is low, the issue might be more complex, and you should examine the ratio of LDAP requests to LDAP responses. In a healthy environment, the number of requests and responses should be roughly equal. For more information, see the LDAP Metrics for Group chart.
Tip: To see which error codes were returned to the client, click Responses and select Error Code from the menu. Metric Description Responses The number of responses received by this LDAP client. Errors The number of responses received by this LDAP client that indicated an error occurred. Responses with non-error result codes, such as success and referral, are not included. - Total Transactions
- This chart shows you how many LDAP responses the clients received and how many of
those responses contained errors.
Metric Description Responses The number of responses received by this LDAP client. Errors The number of responses received by this LDAP client that indicated an error occurred. Responses with non-error result codes, such as success and referral, are not included.
LDAP Details for Group
The following charts are available in this region:
- Top Group Members (LDAP Clients)
- This chart shows which LDAP clients in the group were most active by breaking out the total number of LDAP requests the group sent by client.
- Top Bind Distinguished Names
- This chart shows which users were active in the group the most by breaking out the total number of requests the group sent by username.
- Top Error Codes
- This chart shows which LDAP error codes the group received the most by breaking out the number of responses returned to the group by error code.
- Top SASL Authentication Mechanisms
- This chart shows which SASL mechanism the group authenticated over the most by breaking out the total number of requests the group sent by authentication mechanism.
- Top Methods
- This chart shows which LDAP methods the group called the most by breaking out the total number of requests the group sent by method.
LDAP Metrics for Group
The following charts are available in this region:
- Total Requests and Responses
-
Requests
and responses represent the conversation taking place between clients and servers. If there
are more requests than responses, the clients might be sending more requests than servers
can handle or the network might be too slow.
Note: It is unlikely that the total number of requests and responses will be exactly equal, even in a healthy environment. For example, you might be viewing a time period that captures a response to a request that was sent before the start of the time period. In general, the greater the difference between responses and errors, the greater the chance that there is an issue with those transactions. Metric Description Requests The number of requests sent by this LDAP client. Responses The number of responses received by this LDAP client. Errors The number of responses received by this LDAP client that indicated an error occurred. Responses with non-error result codes, such as success and referral, are not included. Plain Text Messages The number of plain-text messages exchanged by this LDAP client. SASL Messages The number of encrypted messages exchanged by this LDAP client. - Server Processing Time
-
If a client group is acting slow, the server processing time
can help you figure out whether the issue is with the servers. The Server Processing Time
chart shows the median amount of time servers took to process requests from the clients,
measured in milliseconds. High server processing times indicate that the clients are
contacting slow servers.
Metric Description Server Processing Time The time it took for the device to receive the first packet in response after sending the last packet of the request. A long server processing time can indicate server-side latency.
LDAP server group page
This page displays metric charts of LDAP traffic associated with a device group on your network.
- Learn about charts on this page:
- Learn about LDAP security considerations
- Learn about working with metrics.
LDAP Summary for Group
The following charts are available in this region:
- Total Transactions
- This chart shows you when LDAP errors occurred and how many LDAP responses the servers
sent. This information can help you see how active the servers were at the time they
returned the errors.
If you see a large number of errors, you can view details about each error, including the error code. However, if the number of errors is low, the issue might be more complex, and you should examine the ratio of LDAP requests to LDAP responses. In a healthy environment, the number of requests and responses should be roughly equal. For more information, see the LDAP Metrics for Group chart.
Tip: To see which error codes were the server sent, click Responses and select Error Code from the menu. Metric Description Responses The number of responses sent by this LDAP server. Errors The number of responses sent by the LDAP server that indicated an error occurred. Responses with non-error LDAP result codes, such as success and referral, are not included. - Total Transactions
- This chart shows you how many LDAP responses servers in the group sent and how many of
those responses contained errors.
Metric Description Responses The number of responses sent by this LDAP server. Errors The number of responses sent by the LDAP server that indicated an error occurred. Responses with non-error LDAP result codes, such as success and referral, are not included.
LDAP Details for Group
The following charts are available in this region:
- Top Group Members (LDAP Servers)
- This chart shows which LDAP servers in the group were most active by breaking out the total number of LDAP responses the group sent by server.
- Top Bind Distinguished Names
- This chart shows which users were active in the group the most by breaking out the total number of requests the group received by username.
- Top Error Codes
- This chart shows which LDAP error codes the groups returned the most by breaking out the total number of responses the group sent by error code.
- Top SASL Authentication Mechanisms
- This chart shows which SASL mechanism the group authenticated over the most by breaking out the total number of requests the group received by authentication mechanism.
- Top Messages
- This chart shows which LDAP messages were sent to servers in the group the most by breaking out the total number of requests the group received by message.
LDAP Metrics for Group
The following charts are available in this region:
- Total Requests and Responses
-
Requests
and responses represent the conversation taking place between clients and servers. If there
are more requests than responses, clients might be sending more requests than the servers
can handle or the network might be too slow.
Note: It is unlikely that the total number of requests and responses will be exactly equal, even in a healthy environment. For example, you might be viewing a time period that captures a response to a request that was sent before the start of the time period. In general, the greater the difference between responses and errors, the greater the chance that there is an issue with those transactions. Metric Description Requests The number of requests received by this LDAP server. Responses The number of responses sent by this LDAP server. Errors The number of responses sent by the LDAP server that indicated an error occurred. Responses with non-error LDAP result codes, such as success and referral, are not included. Plain Text Messages The number of plain-text messages exchanged by this LDAP server. SASL Messages The number of encrypted messages exchanged by this LDAP server. - Server Processing Time
-
The Server Processing Time chart shows the median amount of
time the servers took to process requests from clients, measured in milliseconds. High
server processing times indicate that the servers in a group are slow.
Metric Description Server Processing Time The time it took for the device to send the first packet in response after receiving the last packet of the request. A long server processing time can indicate server-side latency.
LLMNR
The ExtraHop system collects metrics about Link-Local Multicast Name Resolution (LLMNR) activity. LLMNR is a protocol based on the Domain Name System (DNS) format and enables name resolution for hosts on the same local link when DNS name resolution fails. LLMNR is included in Microsoft Window systems.
| Note: | The ExtraHop system does not include any built-in metric pages for LLMNR. However, you can view LLMNR metrics by adding them to a custom page or dashboard. |
Security considerations
- LLMNR is vulnerable to LLMNR poisoning attacks.
mDNS
The ExtraHop system collects metrics about multicast DNS (mDNS) protocol activity. Multicast DNS is a protocol that provides zero-configuration service discovery on local networks.
| Note: | The ExtraHop system does not include any built-in metric pages for mDNS. However, you can view mDNS metrics by adding them to a custom page or dashboard. |
Memcache
The ExtraHop system collects metrics about Memcache activity. Memcache is a protocol that provides access to high-performance, distributed memory object caching systems over a TCP connection.
Memcache application page
This page displays metric charts of Memcache traffic associated with an application container on your network.
- Learn about charts on this page:
- Learn about working with metrics.
Memcache Summary
The following charts are available in this region:
- Transactions
- This chart shows you when Memcache errors and responses were associated with the
application. This information can help you see how active the application was at the
time the errors occurred.
In a healthy environment, the number of requests and responses should be roughly equal. For more information, see Requests and Responses.
Metric Description Responses The number of Memcache responses. Errors The number of Memcache response errors. - Total Transactions
- This chart displays the total number of Memcache responses that were associated with
the application and how many of those responses contained errors.
Metric Description Responses The number of Memcache responses. Errors The number of Memcache response errors. - Cache Hits and Misses
- This chart shows you when Memcache hits and misses occurred.
Metric Description Hits The number of items matched and that the device received in response to GET requests when acting as a Memcache client. Misses The number of items requested but not received in response to get commands when the device is acting as a Memcache client. Misses are counted even if the server did not explicitly inform the client of the miss (for example, if the get was a quiet request). - Cache Hits and Misses
- This chart shows you the total number of Memcache hits and misses that occurred.
Metric Description Hits The number of items matched and that the device received in response to GET requests when acting as a Memcache client. Misses The number of items requested but not received in response to get commands when the device is acting as a Memcache client. Misses are counted even if the server did not explicitly inform the client of the miss (for example, if the get was a quiet request). - Round Trip Time
- This chart shows percentiles of round trip time (RTT). The RTT metric measures how
long it took for packets to get an immediate acknowledgment from the client or server.
Therefore, RTT is a good indicator of how your network is performing.
Learn more about how the ExtraHop system calculates round trip time on the ExtraHop blog.
Metric Description Round Trip Time The time between when a Memcache client sent a packet that required an immediate acknowledgment and when the client received the acknowledgment. Round trip time (RTT) is a measurement of network latency. - Round Trip Time
- This chart shows the 95th percentile for RTT, measured in milliseconds.
Metric Description Round Trip Time The time between when a Memcache client sent a packet that required an immediate acknowledgment and when the client received the acknowledgment. Round trip time (RTT) is a measurement of network latency. The Performance (95th percentile) chart shows the highest value for a time period while filtering outliers; the 95th percentile is the highest value that falls below 95% of the values for a sample period. By displaying the 95th value, rather than the true maximum, the chart gives you a more accurate view of the data:
Memcache Details
The following charts are available in this region:
- Top Methods
- This chart shows which Memcache methods were associated with the application by breaking out the total number of Memcache requests by method.
- Top Status Codes
- This chart shows which Memcache status codes the server returned the most by breaking out the total number of responses the application sent by status code.
- Top Errors
- This chart shows which Memcache errors the application received the most by breaking out the number of responses returned by error.
Memcache Performance
The following charts are available in this region:
- Round Trip Time Distribution
-
This chart breaks out round trip times in a histogram to show the
most common round trip times, measured in milliseconds.
Metric Description Round Trip Time The time between when a Memcache client or server sent a packet requiring immediate acknowledgment and when the acknowledgment was received. - Round Trip Time
-
This chart shows the median round trip time for the application,
measured in milliseconds.
Metric Description Round Trip Time The time between when a Memcache client or server sent a packet requiring immediate acknowledgment and when the acknowledgment was received.
Memcache Network Data
This region shows you TCP information that is related to the current protocol. In general, host stalls indicate that there is an issue with either a server or a client, and network stalls indicate that there is an issue with the network.
- Host Stalls
-
This chart shows the number of zero windows that were
associated with an application. Devices control the amount of data they receive by
specifying the number of packets that can be sent to them over a given time period.
When a device is sent more data than it can process, the device advertises a zero
window to ask its peer device to stop sending packets completely until the device
catches up. If you see a large number of zero windows, a server or client might not be
not fast enough to support the amount of data being received.
Metric Definition Request Zero Windows The number of zero window advertisements sent by Memcache clients. A device advertises a Zero Window when incoming data is arriving too quickly to be processed. A large number of incoming Zero Windows indicates that a peer device was too slow to process the amount of data received.
Response Zero Windows The number of zero window advertisements sent by servers while receiving Memcache requests. A device advertises a Zero Window when incoming data is arriving too quickly to be processed. A large number of outgoing Zero Windows indicates that a client was too slow to process the amount of data received.
- Total Host Stalls
- This chart shows the median number of zero window advertisements sent by devices.
- Network Stalls
-
This chart shows the number of retransmission
timeouts that occurred. Retransmission timeouts (RTOs) occur when a network drops too
many packets, usually due to packet collisions or buffer exhaustion. If a device sends
a request or response and does not receive confirmation within a specified amount of
time, the device retransmits the request. If too many retransmissions are
unacknowledged, an RTO occurs. If you see a large number of RTOs, the network might be
too slow to support the current level of activity.
Metric Definition RTOs In The number of retransmission timeouts caused by congestion when clients were sending Memcache requests. An RTO is a 1-5 second stall in the TCP connection flow due to excessive retransmissions. If you see a large number of incoming RTOs, a device did not send an acknowledgment to the server quickly enough, or the network might be too slow to support the current level of activity. Depending on the timeout value configured in the operating system, this delay can be anywhere from 1 to 8 seconds.
RTOs Out The number of retransmission timeouts caused by congestion when servers were sending Memcache responses. An RTO is a 1-5 second stall in the TCP connection flow due to excessive retransmissions. If you see a large number of outgoing RTOs, a device did not receive an acknowledgment from the server quickly enough, or the network might be too slow to support the current level of activity. Depending on the timeout value configured in the operating system, this delay can be anywhere from 1 to 8 seconds.
- Total Network Stalls
-
This chart shows the median number of
retransmission timeouts caused by congestion when clients and servers were sending
requests.
Metric Definition RTOs In The number of retransmission timeouts caused by congestion when clients were sending Memcache requests. An RTO is a 1-5 second stall in the TCP connection flow due to excessive retransmissions. If you see a large number of incoming RTOs, a device did not send an acknowledgment to the server quickly enough, or the network might be too slow to support the current level of activity. Depending on the timeout value configured in the operating system, this delay can be anywhere from 1 to 8 seconds.
RTOs Out The number of retransmission timeouts caused by congestion when servers were sending Memcache responses. An RTO is a 1-5 second stall in the TCP connection flow due to excessive retransmissions. If you see a large number of outgoing RTOs, a device did not receive an acknowledgment from the server quickly enough, or the network might be too slow to support the current level of activity. Depending on the timeout value configured in the operating system, this delay can be anywhere from 1 to 8 seconds.
Memcache Metric Totals
The following charts are available in this region:
- Total Requests and Responses
-
Requests and responses represent the conversation taking place between clients and servers. If there are more requests than responses, clients might be sending more requests than servers can handle or the network might be too slow. To identify whether the issue is with the network or a server, check RTOs and zero windows in the Network Data section.
Note: It is unlikely that the total number of requests and responses will be exactly equal, even in a healthy environment. For example, you might be viewing a time period that captures a response to a request that was sent before the start of the time period. In general, the greater the difference between responses and errors, the greater the chance that there is an issue with those transactions. Metric Description Requests The number of Memcache requests. Responses The number of Memcache responses. Hits The number of items matched and returned in response to Memcache GET requests. Misses The number of items requested but not received in response to Memcache GET requests. Misses are counted even if the server did not explicitly inform the client of the miss (for example, if the GET was a quiet request). No-Replies The number of Memcache requests for which a response was not necessarily expected, and none was received. - Memcache Network Metrics
-
Metric Description Request Zero Windows The number of zero window advertisements sent by Memcache clients. A device advertises a Zero Window when incoming data is arriving too quickly to be processed. Response Zero Windows The number of zero window advertisements sent by servers while receiving Memcache requests. A device advertises a Zero Window when incoming data is arriving too quickly to be processed. RTOs In The number of retransmission timeouts caused by congestion when clients were sending Memcache requests. An RTO is a 1-5 second stall in the TCP connection flow due to excessive retransmissions. RTOs Out The number of retransmission timeouts caused by congestion when servers were sending Memcache responses. An RTO is a 1-5 second stall in the TCP connection flow due to excessive retransmissions. Request L2 Bytes The number of L2 bytes associated with Memcache requests. Response L2 Bytes The number of L2 bytes associated with Memcache responses. Request Goodput Bytes The number of goodput bytes associated with Memcache requests. Goodput refers to the throughput of the original data transferred and excludes other throughput such as protocol headers or retransmitted packets. Response Goodput Bytes The number of goodput bytes associated with Memcache responses. Goodput refers to the throughput of the original data transferred and excludes other throughput such as protocol headers or retransmitted packets. Request Packets The number of packets associated with Memcache requests. Response Packets The number of packets associated with Memcache responses.
Memcache client page
This page displays metric charts of Memcache traffic associated with a device on your network.
- Learn about charts on this page:
- Learn about working with metrics.
Memcache Summary
The following charts are available in this region:
- Transactions
- This chart shows you when Memcache errors occurred and how many responses the Memcache
client received. This information can help you see how active the client was at the time
it received the errors.
In a healthy environment, the number of requests and responses should be roughly equal. For more information, see Requests and Responses.
Metric Description Responses The number of responses that the device received when acting as a Memcache client. Errors The number of errors that the device received when acting as a Memcache client. - Total Transactions
- This chart displays the total number of Memcache responses the client received and how
many of those responses contained errors.
Metric Description Responses The number of responses that the device received when acting as a Memcache client. Errors The number of errors that the device received when acting as a Memcache client. - Cache Hits and Misses
- This chart shows you when Memcache hits and misses occurred.
Metric Description Hits The number of items matched and that the device received in response to GET requests when acting as a Memcache client. Misses The number of items requested but not received in response to get commands when the device is acting as a Memcache client. Misses are counted even if the server did not explicitly inform the client of the miss (for example, if the get was a quiet request). - Total Cache Hits and Misses
- This chart shows you the total number of Memcache hits and misses that occurred.
Metric Description Hits The number of items matched and that the device received in response to GET requests when acting as a Memcache client. Misses The number of items requested but not received in response to get commands when the device is acting as a Memcache client. Misses are counted even if the server did not explicitly inform the client of the miss (for example, if the get was a quiet request). - Performance Summary (95th Percentile)
- This chart shows the 95th percentile of timing metrics, measured in milliseconds. The
access time shows how long servers took to process read or write operations that
accessed block data within a file. Access times are calculated by measuring the time
between when the first and last packets of requests and responses are seen by the
ExtraHop system, as shown in the following figure:
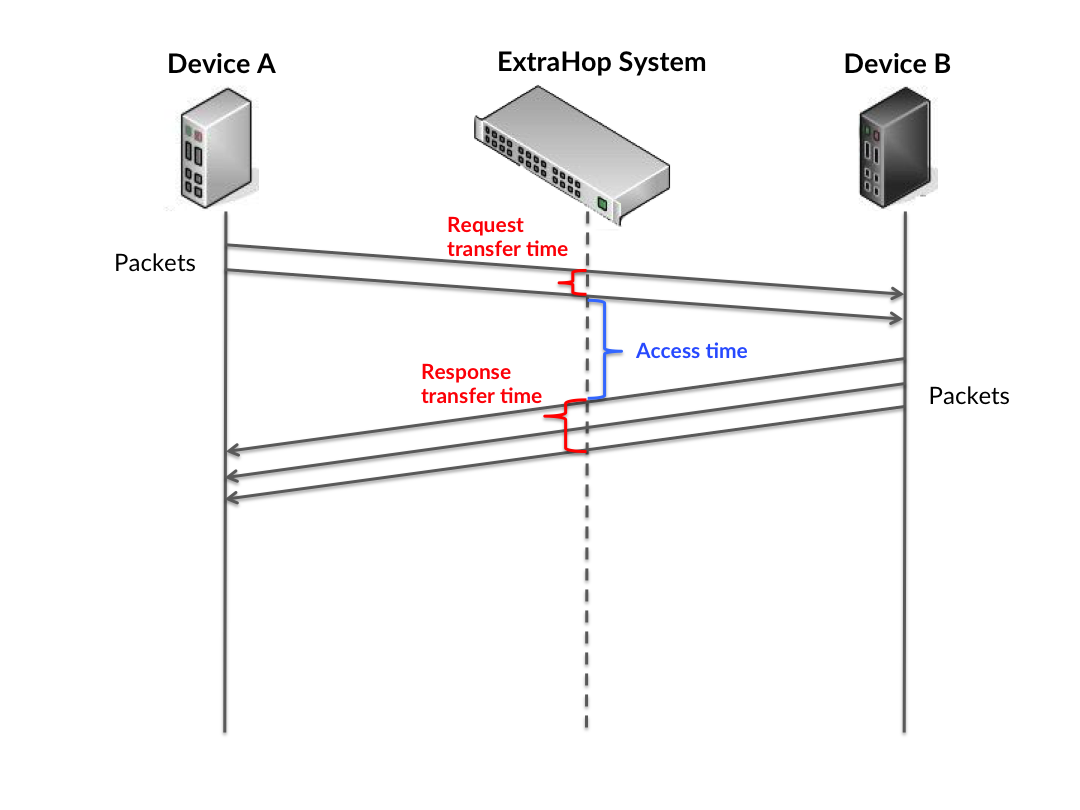
It can be difficult to tell whether an issue is caused by a network or a device from looking only at the access time, because this metric alone provides an incomplete picture. Therefore the round trip time (RTT) metric is also included in this chart. RTT metrics are a good indicator of how your network is performing. If you see high access times, but the RTT is low, the issue is probably at the device-level. However, if the RTT and access times are both high, network latency might be affecting the transfer and access times, and the issue might be with the network.
RTT only measures how long an immediate acknowledgment takes to be sent; it does not wait until all packets are delivered. Therefore, RTT is a good indicator of how your network is performing. If you see high access times, but the TCP RTT is low, the issue is probably at the device-level. Check the network for latency issues if the TCP RTT and access times are all both.
The RTT metric can help identify the source of the problem because it only measures how long an immediate acknowledgment takes to be sent from the client or server; it does not wait until all packets are delivered.
The access time might be high because the server took a long time to transmit the response (possibly because the response was very large); however, the access time could also be high because the response took a long time to travel on the network (possibly because of network congestion).
Learn more about how the ExtraHop system calculates round trip time on the ExtraHop blog.
Metric Description Client Access Time When the device is acting as a Memcache client, the time between the ExtraHop system detecting the last packet of the sent request and first packet of the received response. Round Trip Time The time between when a Memcache client sent a packet that required an immediate acknowledgment and when the client received the acknowledgment. Round trip time (RTT) is a measurement of network latency. The Performance (95th percentile) chart shows the highest value for a time period while filtering outliers; the 95th percentile is the highest value that falls below 95% of the values for a sample period. By displaying the 95th value, rather than the true maximum, the chart gives you a more accurate view of the data:
- Performance (95th)
- This chart shows the 95th percentile of timing metrics, measured in milliseconds. If a
client is acting slow, performance summary metrics can help you figure out whether the
network or servers are causing the issue. The performance summary metrics show the
median amount of time servers took to process requests from the client versus the median
time that packets from those requests (and their respective responses) took to be
transmitted across the network. High server access times indicate that the client is
contacting slow servers. High TCP round trip times indicate that the client is
communicating over slow networks.
Metric Description Client Access Time When the device is acting as a Memcache client, the time between the ExtraHop system detecting the last packet of the sent request and first packet of the received response. Round Trip Time The time between when a Memcache client sent a packet that required an immediate acknowledgment and when the client received the acknowledgment. Round trip time (RTT) is a measurement of network latency.
Memcache Details
The following charts are available in this region:
- Top Methods
- This chart shows which Memcache methods the client called the most by breaking out the total number of requests the client sent by method.
- Top Status Codes
- This chart shows which Memcache status codes the client received the most by breaking out the number of responses returned to the client by status code.
- Top Error
- This chart shows which Memcache errors the client received the most by breaking out the number of responses returned to the client by error.
Memcache Performance
The following charts are available in this region:
- Server Access Time Distribution
- This chart breaks out access times in a histogram to show the most common access
times, measured in milliseconds.
Metric Description Client Access Time When the device is acting as a Memcache client, the time between the ExtraHop system detecting the last packet of the sent request and first packet of the received response. - Server Access Time
- This chart shows the median access time for the client, measured in
milliseconds.
Metric Description Client Access Time When the device is acting as a Memcache client, the time between the ExtraHop system detecting the last packet of the sent request and first packet of the received response. - Round Trip Time Distribution
-
This chart breaks out round trip times in a histogram to show the
most common round trip times, measured in milliseconds.
Metric Description Round Trip Time The time between when a Memcache client sent a packet that required an immediate acknowledgment and when the client received the acknowledgment. Round trip time (RTT) is a measurement of network latency. - Round Trip Time
-
This chart shows the median round trip time for the client, measured in
milliseconds.
Metric Description Round Trip Time The time between when a Memcache client sent a packet that required an immediate acknowledgment and when the client received the acknowledgment. Round trip time (RTT) is a measurement of network latency.
Network Data
This region shows you TCP information that is related to the current protocol. In general, host stalls indicate that there is an issue with either the server or the client, and network stalls indicate that there is an issue with the network.
- Host Stalls
- This chart shows the number of zero windows that were advertised or received by the
device. Devices control the amount of data they receive by specifying the number of
packets that can be sent to them over a given time period. When a device is sent more
data than it can process, the device advertises a zero window to ask its peer device to
stop sending packets completely until the device catches up. If you see a large number
of zero windows, a server or client might not be not fast enough to support the amount
of data being received.
Metric Definition Zero Windows In The number of zero windows that were sent to the device to stop the flow of data over the connection. A device advertises a Zero Window when incoming data is arriving too quickly to be processed. A large number of zero windows in indicates that a peer device was too slow to process the amount of data received.
Zero Windows Out The number of zero windows that were sent from the device to stop the flow of data. A device advertises a Zero Window when incoming data is arriving too quickly to be processed. A large number of zero windows out indicates that the client was too slow to process the amount of data received.
- Network Stalls
-
This chart shows the number of retransmission timeouts that occurred. Retransmission timeouts (RTOs) occur when a network drops too many packets, usually due to packet collisions or buffer exhaustion. If a device sends a request or response and does not receive confirmation within a specified amount of time, the device retransmits the request. If too many retransmissions are unacknowledged, an RTO occurs. If you see a large number of RTOs, the network might be too slow to support the current level of activity.
Metric Definition RTOs In The number of retransmission timeouts (RTOs) caused by network congestion as peers were sending data to the current device. An RTO is a 1-5 second stall in the TCP connection flow due to excessive retransmissions. If you see a large number of RTOs in, the device did not send an acknowledgment to the server quickly enough, or the network might be too slow to support the current level of activity. Depending on the timeout value configured in the operating system, this delay can be anywhere from 1 to 8 seconds.
RTOs Out The number of retransmission timeouts (RTOs) caused by network congestion as the device was sending data to its peers. An RTO is a 1-5 second stall in the TCP connection flow due to excessive retransmissions. If you see a large number of RTOs out, the device did not receive an acknowledgment from the server quickly enough, or the network might be too slow to support the current level of activity. Depending on the timeout value configured in the operating system, this delay can be anywhere from 1 to 8 seconds.
Memcache Metric Totals
The following charts are available in this region:
- Total Requests and Responses
- Requests and responses represent the conversation taking place between clients and
servers. If there are more requests than responses, the client might be sending more
requests than the servers can handle or the network might be too slow. To identify
whether the issue is with the network or the server, check RTOs and zero windows in the
Network Data
section.
Note: It is unlikely that the total number of Memcache requests and responses will be exactly equal, even in a healthy environment. For example, you might be viewing a time period that captures a response to a request that was sent before the start of the time period. In general, the greater the difference between responses and errors, the greater the chance that there is an issue with those transactions. Metric Description Requests The number of requests that the device sent when acting as a Memcache client. Responses The number of responses that the device received when acting as a Memcache client. Hits The number of items matched and that the device received in response to GET requests when acting as a Memcache client. Misses The number of items requested but not received in response to get commands when the device is acting as a Memcache client. Misses are counted even if the server did not explicitly inform the client of the miss (for example, if the get was a quiet request). No-Replies The number of requests sent for which a response was not necessarily expected, and none was received when the device is acting as a Memcache client. - Request and Response Sizes
- This chart shows the average size of requests and responses.
Metric Description Request Size The distribution of sizes (in bytes) of requests that the device sent when acting as a Memcache client. Response Size The distribution of sizes (in bytes) of responses that the device received when acting as a Memcache client.
Memcache server page
This page displays metric charts of Memcache traffic associated with a device on your network.
- Learn about charts on this page:
- Learn about working with metrics.
Memcache Summary
The following charts are available in this region:
- Transactions
- This chart shows you when Memcache errors occurred and how many Memcache responses the
server sent. This information can help you see how active the server was at the time it
returned the errors.
In a healthy environment, the number of requests and responses should be roughly equal. For more information, see Requests and Responses.
Metric Description Responses The number of responses that the device sent when acting as a Memcache server. Errors The number of errors that the device sent when acting as a Memcache server. - Total Transactions
- This chart displays the total number of Memcache responses the server sent and how
many of those responses contained errors.
Metric Description Responses The number of responses that the device sent when acting as a Memcache server. Errors The number of errors that the device sent when acting as a Memcache server. - Cache Hits and Misses
- This chart shows you when Memcache hits and misses occurred.
Metric Description Hits The number of items matched and that the device sent in response to GET requests when acting as a Memcache server. Misses The number of items requested but not sent in response to get commands when the device is acting as a Memcache server. Misses are counted even if the server did not explicitly inform the client of the miss (for example, if the get was a quiet request). - Total Cache Hits and Misses
- This chart shows you the total number of Memcache hits and misses that occurred.
Metric Description Hits The number of items matched and that the device sent in response to GET requests when acting as a Memcache server. Misses The number of items requested but not sent in response to get commands when the device is acting as a Memcache server. Misses are counted even if the server did not explicitly inform the client of the miss (for example, if the get was a quiet request). - Performance Summary (95th Percentile)
- This chart shows the 95th percentile of timing metrics, measured in milliseconds. The
access time shows how long servers took to process read or write operations that
accessed block data within a file. Access times are calculated by measuring the time
between when the first and last packets of requests and responses are seen by the
ExtraHop system, as shown in the following figure:
It can be difficult to tell whether an issue is caused by a network or a device from looking only at the access time, because this metric alone provides an incomplete picture. Therefore the round trip time (RTT) metric is also included in this chart. RTT metrics are a good indicator of how your network is performing. If you see high access times, but the RTT is low, the issue is probably at the device-level. However, if the RTT and access times are both high, network latency might be affecting the transfer and access times, and the issue might be with the network.
RTT only measures how long an immediate acknowledgment takes to be sent; it does not wait until all packets are delivered. Therefore, RTT is a good indicator of how your network is performing. If you see high access times, but the TCP RTT is low, the issue is probably at the device-level. Check the network for latency issues if the TCP RTT and access times are all both.
The RTT metric can help identify the source of the problem because it only measures how long an immediate acknowledgment takes to be sent from the client or server; it does not wait until all packets are delivered.
The access time might be high because the server took a long time to transmit the response (possibly because the response was very large); however, the access time could also be high because the response took a long time to travel on the network (possibly because of network congestion).
Learn more about how the ExtraHop system calculates round trip time on the ExtraHop blog.
Metric Description Server Access Time When the device is acting as a Memcache server, the time between the ExtraHop system detecting the last packet of the received request and first packet of the sent response. Round Trip Time The time between when a Memcache server sent a packet that required an immediate acknowledgment and when the server received the acknowledgment. Round trip time (RTT) is a measurement of network latency. The Performance (95th percentile) chart shows the highest value for a time period while filtering outliers; the 95th percentile is the highest value that falls below 95% of the values for a sample period. By displaying the 95th value, rather than the true maximum, the chart gives you a more accurate view of the data:
- Performance (95th)
- This chart shows the 95th percentile of timing metrics, measured in milliseconds. If a
server is acting slow, performance summary metrics can help you figure out whether the
network or the server is causing the issue. The performance summary metrics show the
median amount of time the server took to process requests from clients versus the median
time that packets from those requests (and their respective responses) took to be
transmitted across the network. High server access times indicate that the server is
slow. High RTTs indicate that the server is communicating over slow networks.
Metric Description Server Access Time When the device is acting as a Memcache server, the time between the ExtraHop system detecting the last packet of the received request and first packet of the sent response. Round Trip Time The time between when a Memcache server sent a packet that required an immediate acknowledgment and when the server received the acknowledgment. Round trip time (RTT) is a measurement of network latency.
Memcache Details
The following charts are available in this region:
- Top Methods
- This chart shows which Memcache methods were called on the server the most by breaking out the total number of requests the server received by method.
- Top Status Codes
- This chart shows which Memcache status codes the server returned the most by breaking out the total number of responses the server sent by status code.
- Top Error
- This chart shows which Memcache errors the server returned the most by breaking out the number of responses the server returned by error.
Memcache Performance
The following charts are available in this region:
- Server Access Time Distribution
- This chart breaks out access times in a histogram to show the most common access
times, measured in milliseconds.
Metric Description Server Access Time When the device is acting as a Memcache server, the time between the ExtraHop system detecting the last packet of the received request and first packet of the sent response. - Server Access Time
- This chart shows the median access time for the client, measured in
milliseconds.
Metric Description Server Access Time When the device is acting as a Memcache server, the time between the ExtraHop system detecting the last packet of the received request and first packet of the sent response. - Round Trip Time Distribution
-
This chart breaks out round trip times in a histogram to show the
most common round trip times, measured in milliseconds.
Metric Description Round Trip Time The time between when a Memcache server sent a packet that required an immediate acknowledgment and when the server received the acknowledgment. Round trip time (RTT) is a measurement of network latency. - Round Trip Time
-
This chart shows the median round trip time for the server, measured in
milliseconds.
Metric Description Round Trip Time The time between when a Memcache server sent a packet that required an immediate acknowledgment and when the server received the acknowledgment. Round trip time (RTT) is a measurement of network latency.
Network Data
This region shows you TCP information that is related to the current protocol. In general, host stalls indicate that there is an issue with either the server or the client, and network stalls indicate that there is an issue with the network.
- Host Stalls
- This chart shows the number of zero windows that were advertised or received by the
device. Devices control the amount of data they receive by specifying the number of
packets that can be sent to them over a given time period. When a device is sent more
data than it can process, the device advertises a zero window to ask its peer device to
stop sending packets completely until the device catches up. If you see a large number
of zero windows, a server or client might not be not fast enough to support the amount
of data being received.
Metric Definition Zero Windows In The number of zero windows that were sent to the device to stop the flow of data over the connection. A device advertises a Zero Window when incoming data is arriving too quickly to be processed. A large number of zero windows in indicates that a peer device was too slow to process the amount of data received.
Zero Windows Out The number of zero windows that were sent from the device to stop the flow of data. A device advertises a Zero Window when incoming data is arriving too quickly to be processed. A large number of zero windows out indicates that the client was too slow to process the amount of data received.
- Network Stalls
-
This chart shows the number of retransmission timeouts that occurred. Retransmission timeouts (RTOs) occur when a network drops too many packets, usually due to packet collisions or buffer exhaustion. If a device sends a request or response and does not receive confirmation within a specified amount of time, the device retransmits the request. If too many retransmissions are unacknowledged, an RTO occurs. If you see a large number of RTOs, the network might be too slow to support the current level of activity.
Metric Definition RTOs In The number of retransmission timeouts (RTOs) caused by network congestion as peers were sending data to the current device. An RTO is a 1-5 second stall in the TCP connection flow due to excessive retransmissions. If you see a large number of RTOs in, the device did not send an acknowledgment to the server quickly enough, or the network might be too slow to support the current level of activity. Depending on the timeout value configured in the operating system, this delay can be anywhere from 1 to 8 seconds.
RTOs Out The number of retransmission timeouts (RTOs) caused by network congestion as the device was sending data to its peers. An RTO is a 1-5 second stall in the TCP connection flow due to excessive retransmissions. If you see a large number of RTOs out, the device did not receive an acknowledgment from the server quickly enough, or the network might be too slow to support the current level of activity. Depending on the timeout value configured in the operating system, this delay can be anywhere from 1 to 8 seconds.
Memcache Metric Totals
The following charts are available in this region:
- Total Requests and Responses
- Requests and responses represent the conversation taking place between clients and
servers. If there are more requests than responses, clients might be sending more
requests than the server can handle or the network might be too slow. To identify
whether the issue is with the network or the server, check RTOs and zero windows in the
Network Data
section.
Note: It is unlikely that the total number of Memcache requests and responses will be exactly equal, even in a healthy environment. For example, you might be viewing a time period that captures a response to a request that was sent before the start of the time period. In general, the greater the difference between responses and errors, the greater the chance that there is an issue with those transactions. Metric Description Requests The number of requests that the device received when acting as a Memcache server. Responses The number of responses that the device sent when acting as a Memcache server. Hits The number of items matched and that the device sent in response to GET requests when acting as a Memcache server. Misses The number of items requested but not sent in response to get commands when the device is acting as a Memcache server. Misses are counted even if the server did not explicitly inform the client of the miss (for example, if the get was a quiet request). No-Replies The number of requests sent for which a response was not necessarily expected, and none was received when the device is acting as a Memcache server. - Request and Response Sizes
- This chart shows the average size of requests and responses.
Metric Description Request Size The distribution of sizes (in bytes) of requests that the device received when acting as a Memcache server. Response Size The distribution of sizes (in bytes) of responses that the device sent when acting as a Memcache server.
Memcache client group page
This page displays metric charts of Memcache traffic associated with a device group on your network.
- Learn about charts on this page:
- Learn about working with metrics.
Memcache Summary for Group
The following charts are available in this region:
- Transactions
- This chart shows you when Memcache errors occurred and how many responses the Memcache
clients received. This information can help you see how active the clients were at the
time they received the errors.
In a healthy environment, the number of requests and responses should be roughly equal. For more information, see the Memcache Metrics for Group section.
Metric Description Responses The number of responses that the device received when acting as a Memcache client. Errors The number of errors that the device received when acting as a Memcache client. - Total Transactions
- This chart shows you how many Memcache responses the clients received and how many of
those responses contained errors.
Metric Description Responses The number of responses that the device received when acting as a Memcache client. Errors The number of errors that the device received when acting as a Memcache client.
Memcache Details for Group
The following charts are available in this region:
- Top Group Members (Memcache Clients)
- This chart shows which Memcache clients in the group were most active by breaking out the total number of Memcache requests the group sent by client.
- Top Methods
- This chart shows which Memcache methods the group called the most by breaking out the total number of requests the group sent by method.
- Top Status Codes
- This chart shows which Memcache status codes the group received the most by breaking out the number of responses returned to the group by status code.
Memcache Metrics for Group
The following charts are available in this region:
- Total Requests and Responses
-
Requests
and responses represent the conversation taking place between clients and servers. If there
are more requests than responses, the clients might be sending more requests than servers
can handle or the network might be too slow.
Note: It is unlikely that the total number of requests and responses will be exactly equal, even in a healthy environment. For example, you might be viewing a time period that captures a response to a request that was sent before the start of the time period. In general, the greater the difference between responses and errors, the greater the chance that there is an issue with those transactions. Metric Description Requests The number of requests that the device sent when acting as a Memcache client. Responses The number of responses that the device received when acting as a Memcache client. Hits The number of items matched and that the device received in response to GET requests when acting as a Memcache client. Misses The number of items requested but not received in response to get commands when the device is acting as a Memcache client. Misses are counted even if the server did not explicitly inform the client of the miss (for example, if the get was a quiet request). No-Replies The number of requests sent for which a response was not necessarily expected, and none was received when the device is acting as a Memcache client. - Access Time
- If a client group is acting slow, the access time can help you figure out whether the
issue is with the servers. The Server Processing Time chart shows the median amount of
time servers took to process requests from the clients, measured in milliseconds. High
access times indicate that the clients are contacting slow servers.
Metric Description Access Time When the device is acting as a Memcache client, the time between the ExtraHop system detecting the last packet of the sent request and first packet of the received response.
Memcache server group page
This page displays metric charts of Memcache traffic associated with a device group on your network.
- Learn about charts on this page:
- Learn about working with metrics.
Memcache Summary for Group
The following charts are available in this region:
- Transactions
- This chart shows you when Memcache errors occurred and how many Memcache responses the
servers sent. This information can help you see how active the servers were at the time
they returned the errors.
In a healthy environment, the number of requests and responses should be roughly equal. For more information, see the Memcache Metrics for Group section.
Metric Description Responses The number of responses that the device sent when acting as a Memcache server. Errors The number of errors that the device sent when acting as a Memcache server. - Total Transactions
- This chart shows you how many Memcache responses servers in the group sent and how
many of those responses contained errors.
Metric Description Responses The number of responses that the device sent when acting as a Memcache server. Errors The number of errors that the device sent when acting as a Memcache server.
Memcache Details for Group
The following charts are available in this region:
- Top Group Members (Memcache Servers)
- This chart shows which Memcache servers in the group were most active by breaking out the total number of Memcache responses the group sent by server.
- Top Methods
- This chart shows which Memcache methods were called on servers in the group the most by breaking out the total number of requests the group received by method.
- Top Status Code
- This chart shows which Memcache status codes the groups returned the most by breaking out the total number of responses the group sent by status code.
Memcache Metrics for Group
The following charts are available in this region:
- Total Requests and Responses
-
Requests
and responses represent the conversation taking place between clients and servers. If there
are more requests than responses, clients might be sending more requests than the servers
can handle or the network might be too slow.
Note: It is unlikely that the total number of requests and responses will be exactly equal, even in a healthy environment. For example, you might be viewing a time period that captures a response to a request that was sent before the start of the time period. In general, the greater the difference between responses and errors, the greater the chance that there is an issue with those transactions. Metric Description Requests The number of requests that the device received when acting as a Memcache server. Responses The number of responses that the device sent when acting as a Memcache server. Hits The number of items matched and that the device sent in response to GET requests when acting as a Memcache server. Misses The number of items requested but not sent in response to get commands when the device is acting as a Memcache server. Misses are counted even if the server did not explicitly inform the client of the miss (for example, if the get was a quiet request). No-Replies The number of requests sent for which a response was not necessarily expected, and none was received when the device is acting as a Memcache server. - Access Time
- If a client group is acting slow, the access time can help you figure out whether the
issue is with the servers. The Server Processing Time chart shows the median amount of
time servers took to process requests from the clients, measured in milliseconds. High
access times indicate that the clients are contacting slow servers.
Metric Description Access Time When the device is acting as a Memcache server, the time between the ExtraHop system detecting the last packet of the received request and first packet of the sent response.
Modbus
The ExtraHop system collects metrics about Modbus activity. Modbus is a serial communication protocol that is standard in industrial automation environments.
| Note: | The ExtraHop system does not include any built-in metric pages for Modbus. However, you can view Modbus metrics by adding them to a custom page or dashboard. |
MongoDB
The ExtraHop system collects metrics about MongoDB activity. MongoDB is an open-source document database that provides performance, availability, and scalability.
MongoDB application page
This page displays metric charts of MongoDB traffic associated with an application container on your network.
- Learn about charts on this page:
- Learn about working with metrics.
MongoDB Summary
The following charts are available in this region:
- Transactions
- This chart shows you when MongoDB errors and responses were associated with the
application. This information can help you see how active the application was at the
time the errors occurred.
In a healthy environment, the number of requests and responses should be roughly equal. For more information, see Requests and Responses.
Metric Description Responses The number of MongoDB responses. Errors The number of MongoDB response errors. - Total Transactions
- This chart displays the total number of MongoDB responses that were associated with
the application and how many of those responses contained errors.
Metric Description Responses The number of MongoDB responses. Errors The number of MongoDB response errors. - Performance (95th Percentile)
-
This chart shows the 95th percentile of timing metrics,
measured in milliseconds. The transfer and processing time metrics show parts of a
complete transaction. The request transfer time shows how long clients took to transmit
requests onto the network; the server processing time shows how long the servers took to
process requests; and the response transfer time shows how long the servers took to
transmit responses onto the network.
Transfer and processing times are calculated by measuring the time between when the first and last packets of requests and responses are seen by the ExtraHop system, as shown in the following figure:
It can be difficult to tell whether an issue is caused by a network or a device from looking only at transfer and processing times, because these metrics alone provide an incomplete picture. Therefore the round trip time (RTT) metric is also included in this chart. RTT metrics are a good indicator of how your network is performing. If you see high transfer or processing times, but the RTT is low, the issue is probably at the device-level. However, if the RTT, processing, and transfer times are all high, network latency might be affecting the transfer and processing times, and the issue might be with the network.
The RTT metric can help identify the source of the problem because it only measures how long an immediate acknowledgment takes to be sent from the client or server; it does not wait until all packets are delivered.
The ExtraHop system calculates the RTT value by measuring the time between the first packet of a request and the acknowledgment from the server, as shown in the following figure:
The request transfer time might be high because the client took a long time to transmit the request (possibly because the request was very large); however, the transfer time could also be high because the request took a long time to travel on the network (possibly because of network congestion).
Learn more about how the ExtraHop system calculates round trip time on the ExtraHop blog.
Metric Description Request Transfer Time The time between the ExtraHop system detecting the first packet and last packet of MongoDB requests. A high number might indicate a large request or network delay. Server Processing Time The time between the ExtraHop system detecting the last packet of MongoDB requests and the first packet of their corresponding responses. Response Transfer Time The time between the ExtraHop system detecting the first packet and last packet of MongoDB responses. A high number might indicate a large response or network delay. Round Trip Time The time between when a MongoDB client or server sent a packet requiring immediate acknowledgment and when the acknowledgment was received. The Performance (95th percentile) chart shows the highest value for a time period while filtering outliers; the 95th percentile is the highest value that falls below 95% of the values for a sample period. By displaying the 95th value, rather than the true maximum, the chart gives you a more accurate view of the data:
- Performance (95th)
-
This chart shows the 95th percentile of timing
metrics, measured in milliseconds. If an application is acting slow, performance
summary metrics can help you figure out whether the network or servers are causing the
issue. These metrics show the 95th percentile of time that servers took to process
requests from clients versus the 95th percentile time that packets from those requests
(and their respective responses) took to be transmitted across the network. High
server processing times indicate that clients are contacting slow servers. High TCP
round trip times indicate that clients are communicating over slow networks.
Metric Description Server Processing Time The time between the ExtraHop system detecting the last packet of MongoDB requests and the first packet of their corresponding responses. Round Trip Time The time between when a MongoDB client or server sent a packet requiring immediate acknowledgment and when the acknowledgment was received.
MongoDB Details
The following charts are available in this region:
- Top Methods
- This chart shows which MongoDB methods were associated with the application by breaking out the total number of MongoDB requests by method.
- Top Error Types
- This chart shows which MongoDB errors were associated with the application the most by breaking out the number of responses by error.
- Top Databases
- This chart shows which databases the application accessed the most by breaking out the total number of requests the application sent by database.
MongoDB Performance
The following charts are available in this region:
- Server Processing Time Distribution
-
This chart breaks out server processing times in a histogram to
show the most common processing times, measured in milliseconds.
Metric Description Server Processing Time The time between the ExtraHop system detecting the last packet of MongoDB requests and the first packet of their corresponding responses. - Server Processing Time
-
This chart shows the median processing time for the
application, measured in milliseconds.
Metric Description Server Processing Time The time between the ExtraHop system detecting the last packet of MongoDB requests and the first packet of their corresponding responses. - Round Trip Time Distribution
-
This chart breaks out round trip times in a histogram to show the
most common round trip times, measured in milliseconds.
Metric Description Round Trip Time The time between when a MongoDB client or server sent a packet requiring immediate acknowledgment and when the acknowledgment was received. - Round Trip Time
-
This chart shows the median round trip time for the application,
measured in milliseconds.
Metric Description Round Trip Time The time between when a MongoDB client or server sent a packet requiring immediate acknowledgment and when the acknowledgment was received.
Network Data
This region shows you TCP information that is related to the current protocol. In general, host stalls indicate that there is an issue with either a server or a client, and network stalls indicate that there is an issue with the network.
- Host Stalls
-
This chart shows the number of zero windows that were
associated with an application. Devices control the amount of data they receive by
specifying the number of packets that can be sent to them over a given time period.
When a device is sent more data than it can process, the device advertises a zero
window to ask its peer device to stop sending packets completely until the device
catches up. If you see a large number of zero windows, a server or client might not be
not fast enough to support the amount of data being received.
Metric Definition Request Zero Windows The number of zero window advertisements sent by MongoDB clients. A device advertises a Zero Window when incoming data is arriving too quickly to be processed. A large number of incoming Zero Windows indicates that a peer device was too slow to process the amount of data received.
Response Zero Windows The number of zero window advertisements sent by servers while receiving MongoDB requests. A device advertises a Zero Window when incoming data is arriving too quickly to be processed. A large number of outgoing Zero Windows indicates that a client was too slow to process the amount of data received.
- Total Host Stalls
- This chart shows the median number of zero window advertisements sent by devices.
- Network Stalls
-
This chart shows the number of retransmission
timeouts that occurred. Retransmission timeouts (RTOs) occur when a network drops too
many packets, usually due to packet collisions or buffer exhaustion. If a device sends
a request or response and does not receive confirmation within a specified amount of
time, the device retransmits the request. If too many retransmissions are
unacknowledged, an RTO occurs. If you see a large number of RTOs, the network might be
too slow to support the current level of activity.
Metric Definition RTOs In The number of retransmission timeouts caused by congestion when clients were sending MongoDB requests. An RTO is a 1-5 second stall in the TCP connection flow due to excessive retransmissions. If you see a large number of incoming RTOs, a device did not send an acknowledgment to the server quickly enough, or the network might be too slow to support the current level of activity. Depending on the timeout value configured in the operating system, this delay can be anywhere from 1 to 8 seconds.
RTOs Out The number of retransmission timeouts caused by congestion when servers were sending MongoDB responses. An RTO is a 1-5 second stall in the TCP connection flow due to excessive retransmissions. If you see a large number of outgoing RTOs, a device did not receive an acknowledgment from the server quickly enough, or the network might be too slow to support the current level of activity. Depending on the timeout value configured in the operating system, this delay can be anywhere from 1 to 8 seconds.
- Total Network Stalls
-
This chart shows the median number of
retransmission timeouts caused by congestion when clients and servers were sending
requests.
Metric Definition RTOs In The number of retransmission timeouts caused by congestion when clients were sending MongoDB requests. An RTO is a 1-5 second stall in the TCP connection flow due to excessive retransmissions. If you see a large number of incoming RTOs, a device did not send an acknowledgment to the server quickly enough, or the network might be too slow to support the current level of activity. Depending on the timeout value configured in the operating system, this delay can be anywhere from 1 to 8 seconds.
RTOs Out The number of retransmission timeouts caused by congestion when servers were sending MongoDB responses. An RTO is a 1-5 second stall in the TCP connection flow due to excessive retransmissions. If you see a large number of outgoing RTOs, a device did not receive an acknowledgment from the server quickly enough, or the network might be too slow to support the current level of activity. Depending on the timeout value configured in the operating system, this delay can be anywhere from 1 to 8 seconds.
MongoDB Metric Totals
The following charts are available in this region:
- Total Requests and Responses
-
Requests and responses represent the conversation taking place between clients and servers. If there are more requests than responses, clients might be sending more requests than servers can handle or the network might be too slow. To identify whether the issue is with the network or a server, check RTOs and zero windows in the Network Data section.
Note: It is unlikely that the total number of MongoDB requests and responses will be exactly equal, even in a healthy environment. For example, you might be viewing a time period that captures a response to a request that was sent before the start of the time period. In general, the greater the difference between responses and errors, the greater the chance that there is an issue with those transactions. Metric Description Requests The number of MongoDB requests. Responses The number of MongoDB responses. Errors The number of MongoDB response errors. - MongoDB Network Metrics
-
Metric Description Request Zero Windows The number of zero window advertisements sent by MongoDB clients. A device advertises a Zero Window when incoming data is arriving too quickly to be processed. Response Zero Windows The number of zero window advertisements sent by servers while receiving MongoDB requests. A device advertises a Zero Window when incoming data is arriving too quickly to be processed. Request RTOs The number of retransmission timeouts caused by congestion when clients were sending MongoDB requests. An RTO is a 1-5 second stall in the TCP connection flow due to excessive retransmissions. Response RTOs The number of retransmission timeouts caused by congestion when servers were sending MongoDB responses. An RTO is a 1-5 second stall in the TCP connection flow due to excessive retransmissions. Request L2 Bytes The number of L2 bytes associated with MongoDB requests. Response L2 Bytes The number of L2 bytes associated with MongoDB responses. Request Goodput Bytes The number of goodput bytes associated with MongoDB requests. Goodput refers to the throughput of the original data transferred and excludes other throughput such as protocol headers or retransmitted packets. Response Goodput Bytes The number of goodput bytes associated with MongoDB responses. Goodput refers to the throughput of the original data transferred and excludes other throughput such as protocol headers or retransmitted packets. Request Packets The number of packets associated with MongoDB requests. Response Packets The number of packets associated with MongoDB responses.
MongoDB client page
This page displays metric charts of MongoDB traffic associated with a device on your network.
- Learn about charts on this page:
- Learn about working with metrics.
MongoDB Summary
The following charts are available in this region:
- Transactions
- This chart shows you when MongoDB errors occurred and how many responses the MongoDB
client received. This information can help you see how active the client was at the time
it received the errors.
If you see a large number of errors, you can view details about each error, including the error code. However, if the number of errors is low, the issue might be more complex, and you should examine the ratio of requests to responses. In a healthy environment, the number of requests and responses should be roughly equal. For more information, see Requests and Responses.
Tip: To see which error codes the client received, click Errors and select Error from the menu. Metric Description Responses The number of responses that the device received when acting as a MongoDB client. Errors The number of errors that the device received when acting as a MongoDB client. - Total Transactions
- This chart displays the total number of MongoDB responses the client received and how
many of those responses contained errors.
Metric Description Responses The number of responses that the device received when acting as a MongoDB client. Errors The number of errors that the device received when acting as a MongoDB client. - Performance Summary (95th Percentile)
-
This chart shows the 95th percentile of timing metrics, measured in
milliseconds. The transfer and processing time metrics show parts of a complete
transaction. The request transfer time shows how long the client took to transmit requests
onto the network; the server processing time shows how long servers took to process the
requests; and the response transfer time shows how long servers took to transmit responses
onto the network.
Transfer and processing times are calculated by measuring the time between when the first and last packets of requests and responses are seen by the ExtraHop system, as shown in the following figure:
It can be difficult to tell whether an issue is caused by a network or a device from looking only at transfer and processing times, because these metrics alone provide an incomplete picture. Therefore the round trip time (RTT) metric is also included in this chart. RTT metrics are a good indicator of how your network is performing. If you see high transfer or processing times, but the RTT is low, the issue is probably at the device-level. However, if the RTT, processing, and transfer times are all high, network latency might be affecting the transfer and processing times, and the issue might be with the network.
The RTT metric can help identify the source of the problem because it only measures how long an immediate acknowledgment takes to be sent from the client or server; it does not wait until all packets are delivered.
The ExtraHop system calculates the RTT value by measuring the time between the first packet of a request and the acknowledgment from the server, as shown in the following figure:
The request transfer time might be high because the client took a long time to transmit the request (possibly because the request was very large); however, the transfer time could also be high because the request took a long time to travel on the network (possibly because of network congestion).
Learn more about how the ExtraHop system calculates round trip time on the ExtraHop blog.
Metric Description Request Transfer Time When the device is acting as a MongoDB client, the time between the ExtraHop system detecting the first packet and last packet of sent requests. A high number might indicate a large request or network delay. Server Processing Time When the device is acting as a MongoDB client, the time between the ExtraHop system detecting the last packet of the sent request and the first packet of the received response. Response Transfer Time When the device is acting as a MongoDB client, the time between the ExtraHop system detecting the first packet and last packet of received responses. A high number might indicate a large response or network delay. Round Trip Time The time between when a MongoDB client sent a packet that required an immediate acknowledgment and when the client received the acknowledgment. Round trip time (RTT) is a measurement of network latency. The Performance (95th percentile) chart shows the highest value for a time period while filtering outliers; the 95th percentile is the highest value that falls below 95% of the values for a sample period. By displaying the 95th value, rather than the true maximum, the chart gives you a more accurate view of the data:
- Performance (95th)
-
This chart shows the 95th percentile of timing
metrics, measured in milliseconds. If a client is acting slow, performance summary
metrics can help you figure out whether the network or servers are causing the issue.
These metrics show the 95th percentile amount of time that servers took to process
requests from the client versus the 95th percentile time that packets from those
requests (and their respective responses) took to be transmitted across the network.
High server processing times indicate that the client is contacting slow servers. High
TCP round trip times indicate that the client is communicating over slow
networks.
Metric Description Server Processing Time When the device is acting as a MongoDB client, the time between the ExtraHop system detecting the last packet of the sent request and the first packet of the received response. Round Trip Time The time between when a MongoDB client sent a packet that required an immediate acknowledgment and when the client received the acknowledgment. Round trip time (RTT) is a measurement of network latency.
MongoDB Details
The following charts are available in this region:
- Top Methods
- This chart shows which MongoDB methods the client called the most by breaking out the total number of requests the client sent by method.
- Top Databases
- This chart shows which databases the client accessed the most by breaking out the total number of requests the client sent by database.
- Top Errors
- This chart shows which MongoDB errors the client received the most by breaking out the number of responses returned to the client by error.
MongoDB Performance
The following charts are available in this region:
- Server Processing Time Breakdown
-
This chart breaks out server processing times in a histogram to
show the most common processing times, measured in milliseconds.
Metric Description Server Processing Time When the device is acting as a MongoDB client, the time between the ExtraHop system detecting the last packet of the sent request and the first packet of the received response. - Server Processing Time
-
This chart shows the median processing time for the client,
measured in milliseconds.
Metric Description Server Processing Time When the device is acting as a MongoDB client, the time between the ExtraHop system detecting the last packet of the sent request and the first packet of the received response. - Round Trip Time Distribution
-
This chart breaks out round trip times in a histogram to show the
most common round trip times, measured in milliseconds.
Metric Description Round Trip Time The time between when a MongoDB client sent a packet that required an immediate acknowledgment and when the client received the acknowledgment. Round trip time (RTT) is a measurement of network latency. - Round Trip Time
-
This chart shows the median round trip time for the client, measured in
milliseconds.
Metric Description Round Trip Time The time between when a MongoDB client sent a packet that required an immediate acknowledgment and when the client received the acknowledgment. Round trip time (RTT) is a measurement of network latency.
Network Data
This region shows you TCP information that is related to the current protocol. In general, host stalls indicate that there is an issue with either the server or the client, and network stalls indicate that there is an issue with the network.
- Host Stalls
- This chart shows the number of zero windows that were advertised or received by the
device. Devices control the amount of data they receive by specifying the number of
packets that can be sent to them over a given time period. When a device is sent more
data than it can process, the device advertises a zero window to ask its peer device to
stop sending packets completely until the device catches up. If you see a large number
of zero windows, a server or client might not be not fast enough to support the amount
of data being received.
Metric Definition Zero Windows In The number of zero windows that were sent to the device to stop the flow of data over the connection. A device advertises a Zero Window when incoming data is arriving too quickly to be processed. A large number of zero windows in indicates that a peer device was too slow to process the amount of data received.
Zero Windows Out The number of zero windows that were sent from the device to stop the flow of data. A device advertises a Zero Window when incoming data is arriving too quickly to be processed. A large number of zero windows out indicates that the client was too slow to process the amount of data received.
- Network Stalls
-
This chart shows the number of retransmission timeouts that occurred. Retransmission timeouts (RTOs) occur when a network drops too many packets, usually due to packet collisions or buffer exhaustion. If a device sends a request or response and does not receive confirmation within a specified amount of time, the device retransmits the request. If too many retransmissions are unacknowledged, an RTO occurs. If you see a large number of RTOs, the network might be too slow to support the current level of activity.
Metric Definition RTOs In The number of retransmission timeouts (RTOs) caused by network congestion as peers were sending data to the current device. An RTO is a 1-5 second stall in the TCP connection flow due to excessive retransmissions. If you see a large number of RTOs in, the device did not send an acknowledgment to the server quickly enough, or the network might be too slow to support the current level of activity. Depending on the timeout value configured in the operating system, this delay can be anywhere from 1 to 8 seconds.
RTOs Out The number of retransmission timeouts (RTOs) caused by network congestion as the device was sending data to its peers. An RTO is a 1-5 second stall in the TCP connection flow due to excessive retransmissions. If you see a large number of RTOs out, the device did not receive an acknowledgment from the server quickly enough, or the network might be too slow to support the current level of activity. Depending on the timeout value configured in the operating system, this delay can be anywhere from 1 to 8 seconds.
MongoDB Metric Totals
The following charts are available in this region:
- Total Requests and Responses
- Requests and responses represent the conversation taking place between clients and
servers. If there are more requests than responses, the client might be sending more
requests than the servers can handle or the network might be too slow. To identify
whether the issue is with the network or the server, check RTOs and zero windows in the
Network Data
section.
Note: It is unlikely that the total number of MongoDB requests and responses will be exactly equal, even in a healthy environment. For example, you might be viewing a time period that captures a response to a request that was sent before the start of the time period. In general, the greater the difference between responses and errors, the greater the chance that there is an issue with those transactions. Metric Description Requests The number of requests that the device sent when acting as a MongoDB client. Responses The number of responses that the device received when acting as a MongoDB client. Aborted Requests The number of requests that this MongoDB client began to send but did not send completely because the connection abruptly closed. Aborted Responses The number of requests that this MongoDB client began to send but did not send completely because the connection abruptly closed. Errors The number of errors that the device received when acting as a MongoDB client. - Request and Response Sizes
- This chart shows the average size of requests and responses.
Metric Description Request Size The distribution of sizes (in bytes) of requests that the device sent when acting as a MongoDB client. Response Size The distribution of sizes (in bytes) of responses that the device received when acting as a MongoDB client.
MongoDB server page
This page displays metric charts of MongoDB traffic associated with a device on your network.
- Learn about charts on this page:
- Learn about working with metrics.
MongoDB Summary
The following charts are available in this region:
- Transactions
- This chart shows you when MongoDB errors occurred and how many MongoDB responses the
server sent. This information can help you see how active the server was at the time it
returned the errors.
If you see a large number of errors, you can view details about each error, including the error code. However, if the number of errors is low, the issue might be more complex, and you should examine the ratio of requests to responses. In a healthy environment, the number of requests and responses should be roughly equal. For more information, see Requests and Responses.
Tip: To see which error codes the client received, click Errors and select Error from the menu. Metric Description Responses The number of responses that the device sent when acting as a MongoDB server. Errors The number of errors that the device sent when acting as a MongoDB server. - Total Transactions
- This chart displays the total number of MongoDB responses the server sent and how many
of those responses contained errors.
Metric Description Responses The number of responses that the device sent when acting as a MongoDB server. Errors The number of errors that the device sent when acting as a MongoDB server. - Performance Summary (95th Percentile)
-
This chart shows the 95th percentile of timing metrics, measured in
milliseconds. The transfer and processing time metrics show parts of a complete
transaction. The request transfer time shows how long clients took to transmit requests
onto the network; the server processing time shows how long the server took to process
requests; and the response transfer time shows how long the server took to transmit
responses onto the network.
Transfer and processing times are calculated by measuring the time between when the first and last packets of requests and responses are seen by the ExtraHop system, as shown in the following figure:
It can be difficult to tell whether an issue is caused by a network or a device from looking only at transfer and processing times, because these metrics alone provide an incomplete picture. Therefore the round trip time (RTT) metric is also included in this chart. RTT metrics are a good indicator of how your network is performing. If you see high transfer or processing times, but the RTT is low, the issue is probably at the device-level. However, if the RTT, processing, and transfer times are all high, network latency might be affecting the transfer and processing times, and the issue might be with the network.
The RTT metric can help identify the source of the problem because it only measures how long an immediate acknowledgment takes to be sent from the client or server; it does not wait until all packets are delivered.
The ExtraHop system calculates the RTT value by measuring the time between the first packet of a request and the acknowledgment from the server, as shown in the following figure:
The request transfer time might be high because the client took a long time to transmit the request (possibly because the request was very large); however, the transfer time could also be high because the request took a long time to travel on the network (possibly because of network congestion).
Learn more about how the ExtraHop system calculates round trip time on the ExtraHop blog.
Metric Description Request Transfer Time When the device is acting as a MongoDB server, the time between the ExtraHop system detecting the first packet and last packet of received requests. A high number might indicate a large request or network delay. Server Processing Time When the device is acting as a MongoDB server, the time between the ExtraHop system detecting the last packet of the received request and first packet of the sent response. Response Transfer Time When the device is acting as a MongoDB server, the time between the ExtraHop system detecting the first packet and last packet of sent responses. A high number might indicate a large response or network delay. Round Trip Time The time between when a MongoDB server sent a packet that required an immediate acknowledgment and when the server received the acknowledgment. Round trip time (RTT) is a measurement of network latency. The Performance (95th percentile) chart shows the highest value for a time period while filtering outliers; the 95th percentile is the highest value that falls below 95% of the values for a sample period. By displaying the 95th value, rather than the true maximum, the chart gives you a more accurate view of the data:
- Performance (95th)
-
This chart shows the 95th percentile of timing
metrics, measured in milliseconds. If a server is acting slow, performance summary
metrics can help you figure out whether the network or the server is causing the
issue. The performance summary metrics show the 95th percentile amount of time the
server took to process requests from clients versus the 95th percentile time that
packets from those requests (and their respective responses) took to be transmitted
across the network. High server processing times indicate that the server is slow.
High RTTs indicate that the server is communicating over slow networks.
Metric Description Server Processing Time When the device is acting as a MongoDB server, the time between the ExtraHop system detecting the last packet of the received request and first packet of the sent response. Round Trip Time The time between when a MongoDB server sent a packet that required an immediate acknowledgment and when the server received the acknowledgment. Round trip time (RTT) is a measurement of network latency.
MongoDB Details
The following charts are available in this region:
- Top Methods
- This chart shows which MongoDB methods were called on the server the most by breaking out the total number of requests the server received by method.
- Top Databases
- This chart shows which databases on the server were accessed the most by breaking out the total number of responses the server sent by database.
- Top Errors
- This chart shows which MongoDB errors the server returned the most by breaking out the number of responses the server returned by error.
MongoDB Performance
The following charts are available in this region:
- Server Processing Time Breakdown
-
This chart breaks out server processing times in a histogram to
show the most common processing times, measured in milliseconds.
Metric Description Server Processing Time When the device is acting as a MongoDB server, the time between the ExtraHop system detecting the last packet of the received request and first packet of the sent response. - Server Processing Time
-
This chart shows the median processing time for the server,
measured in milliseconds.
Metric Description Server Processing Time When the device is acting as a MongoDB server, the time between the ExtraHop system detecting the last packet of the received request and first packet of the sent response. - Round Trip Time Distribution
-
This chart breaks out round trip times in a histogram to show the
most common round trip times, measured in milliseconds.
Metric Description Round Trip Time The time between when a MongoDB server sent a packet that required an immediate acknowledgment and when the server received the acknowledgment. Round trip time (RTT) is a measurement of network latency. - Round Trip Time
-
This chart shows the median round trip time for the server, measured in
milliseconds.
Metric Description Round Trip Time The time between when a MongoDB server sent a packet that required an immediate acknowledgment and when the server received the acknowledgment. Round trip time (RTT) is a measurement of network latency.
Network Data
This region shows you TCP information that is related to the current protocol. In general, host stalls indicate that there is an issue with either the server or the client, and network stalls indicate that there is an issue with the network.
- Host Stalls
- This chart shows the number of zero windows that were advertised or received by the
device. Devices control the amount of data they receive by specifying the number of
packets that can be sent to them over a given time period. When a device is sent more
data than it can process, the device advertises a zero window to ask its peer device to
stop sending packets completely until the device catches up. If you see a large number
of zero windows, a server or client might not be not fast enough to support the amount
of data being received.
Metric Definition Zero Windows In The number of zero windows that were sent to the device to stop the flow of data over the connection. A device advertises a Zero Window when incoming data is arriving too quickly to be processed. A large number of zero windows in indicates that a peer device was too slow to process the amount of data received.
Zero Windows Out The number of zero windows that were sent from the device to stop the flow of data. A device advertises a Zero Window when incoming data is arriving too quickly to be processed. A large number of zero windows out indicates that the client was too slow to process the amount of data received.
- Network Stalls
-
This chart shows the number of retransmission timeouts that occurred. Retransmission timeouts (RTOs) occur when a network drops too many packets, usually due to packet collisions or buffer exhaustion. If a device sends a request or response and does not receive confirmation within a specified amount of time, the device retransmits the request. If too many retransmissions are unacknowledged, an RTO occurs. If you see a large number of RTOs, the network might be too slow to support the current level of activity.
Metric Definition RTOs In The number of retransmission timeouts (RTOs) caused by network congestion as peers were sending data to the current device. An RTO is a 1-5 second stall in the TCP connection flow due to excessive retransmissions. If you see a large number of RTOs in, the device did not send an acknowledgment to the server quickly enough, or the network might be too slow to support the current level of activity. Depending on the timeout value configured in the operating system, this delay can be anywhere from 1 to 8 seconds.
RTOs Out The number of retransmission timeouts (RTOs) caused by network congestion as the device was sending data to its peers. An RTO is a 1-5 second stall in the TCP connection flow due to excessive retransmissions. If you see a large number of RTOs out, the device did not receive an acknowledgment from the server quickly enough, or the network might be too slow to support the current level of activity. Depending on the timeout value configured in the operating system, this delay can be anywhere from 1 to 8 seconds.
MongoDB Metric Totals
The following charts are available in this region:
- Total Requests and Responses
- Requests and responses represent the conversation taking place between clients and
servers. If there are more requests than responses, clients might be sending more
requests than the server can handle or the network might be too slow. To identify
whether the issue is with the network or the server, check RTOs and zero windows in the
Network Data
section.
Note: It is unlikely that the total number of MongoDB requests and responses will be exactly equal, even in a healthy environment. For example, you might be viewing a time period that captures a response to a request that was sent before the start of the time period. In general, the greater the difference between responses and errors, the greater the chance that there is an issue with those transactions. Metric Description Requests The number of requests that the device received when acting as a MongoDB server. Responses The number of responses that the device sent when acting as a MongoDB server. Aborted Requests The number of requests that this MongoDB server began to receive but did not receive completely because the connection abruptly closed. Aborted Responses The number of requests that this MongoDB server began to receive but did not receive completely because the connection abruptly closed. Errors The number of errors that the device sent when acting as a MongoDB server. - Request and Response Sizes
- This chart shows the average size of requests and responses.
Metric Description Request Size The distribution of sizes (in bytes) of requests that the device received when acting as a MongoDB server. Response Size The distribution of sizes (in bytes) of responses that the device sent when acting as a MongoDB server.
MongoDB client group page
This page displays metric charts of MongoDB traffic associated with a device group on your network.
- Learn about charts on this page:
- Learn about working with metrics.
MongoDB Summary for Group
The following charts are available in this region:
- Transactions
- This chart shows you when MongoDB errors occurred and how many responses the MongoDB
clients received. This information can help you see how active the clients were at the
time they received the errors.
If you see a large number of errors, you can view details about each error, including the error code. However, if the number of errors is low, the issue might be more complex, and you should examine the ratio of MongoDB requests to MongoDB responses. In a healthy environment, the number of requests and responses should be roughly equal. For more information, see the MongoDB Metrics for Group chart.
Tip: To see which error codes the client received, click Errors and select Error from the menu. Metric Description Responses The number of responses that the device received when acting as a MongoDB client. Errors The number of errors that the device received when acting as a MongoDB client. - Total Transactions
- This chart shows you how many MongoDB responses the clients received and how many of
those responses contained errors.
Metric Description Responses The number of responses that the device received when acting as a MongoDB client. Errors The number of errors that the device received when acting as a MongoDB client.
MongoDB Details for Group
The following charts are available in this region:
- Top Group Members (MongoDB Clients)
- This chart shows which MongoDB clients in the group were most active by breaking out the total number of MongoDB requests the group sent by client.
- Top Methods
- This chart shows which MongoDB methods the group called the most by breaking out the total number of requests the group sent by method.
- Top Errors
- This chart shows which MongoDB errors the group received the most by breaking out the number of responses returned to the group by error.
MongoDB Metrics for Group
The following charts are available in this region:
- Total Requests and Responses
-
Requests
and responses represent the conversation taking place between clients and servers. If there
are more requests than responses, the clients might be sending more requests than servers
can handle or the network might be too slow.
Note: It is unlikely that the total number of requests and responses will be exactly equal, even in a healthy environment. For example, you might be viewing a time period that captures a response to a request that was sent before the start of the time period. In general, the greater the difference between responses and errors, the greater the chance that there is an issue with those transactions. Metric Description Requests The number of requests that the device sent when acting as a MongoDB client. Responses The number of responses that the device received when acting as a MongoDB client. Aborted Requests The number of requests that this MongoDB client began to send but did not send completely because the connection abruptly closed. Aborted Responses The number of requests that this MongoDB client began to send but did not send completely because the connection abruptly closed. Errors The number of errors that the device received when acting as a MongoDB client. - Server Processing Time
-
If a client group is acting slow, the server processing time
can help you figure out whether the issue is with the servers. The Server Processing Time
chart shows the median amount of time servers took to process requests from the clients,
measured in milliseconds. High server processing times indicate that the clients are
contacting slow servers.
Metric Description Server Processing Time When the device is acting as a MongoDB client, the time between the ExtraHop system detecting the last packet of the sent request and the first packet of the received response.
MongoDB server group page
This page displays metric charts of MongoDB traffic associated with a device group on your network.
- Learn about charts on this page:
- Learn about working with metrics.
MongoDB Summary for Group
The following charts are available in this region:
- Total Transactions
- This chart shows you when MongoDB errors occurred and how many MongoDB responses the
servers sent. This information can help you see how active the servers were at the time
they returned the errors.
If you see a large number of errors, you can view details about each error, including the error code. However, if the number of errors is low, the issue might be more complex, and you should examine the ratio of MongoDB requests to MongoDB responses. In a healthy environment, the number of requests and responses should be roughly equal. For more information, see the MongoDB Metrics for Group chart.
Tip: To see which error codes the client received, click Errors and select Error from the menu. Metric Description Responses The number of responses that the device sent when acting as a MongoDB server. Errors The number of errors that the device sent when acting as a MongoDB server. - Total Transactions
- This chart shows you how many MongoDB responses servers in the group sent and how many
of those responses contained errors.
Metric Description Responses The number of responses that the device sent when acting as a MongoDB server. Errors The number of errors that the device sent when acting as a MongoDB server.
MongoDB Details for Group
The following charts are available in this region:
- Top Group Members (MongoDB Servers)
- This chart shows which MongoDB servers in the group were most active by breaking out the total number of MongoDB responses the group sent by server.
- Top Methods
- This chart shows which MongoDB methods were called on servers in the group the most by breaking out the total number of requests the group received by method.
- Top Errors
- This chart shows which MongoDB errors the groups returned the most by breaking out the total number of responses the group sent by error.
MongoDB Metrics for Group
The following charts are available in this region:
- MongoDB Metrics for Group
-
Requests
and responses represent the conversation taking place between clients and servers. If there
are more requests than responses, clients might be sending more requests than the servers
can handle or the network might be too slow.
Note: It is unlikely that the total number of requests and responses will be exactly equal, even in a healthy environment. For example, you might be viewing a time period that captures a response to a request that was sent before the start of the time period. In general, the greater the difference between responses and errors, the greater the chance that there is an issue with those transactions. Metric Description Requests The number of requests that the device received when acting as a MongoDB server. Responses The number of responses that the device sent when acting as a MongoDB server. Errors The number of errors that the device sent when acting as a MongoDB server. Aborted Requests The number of requests that this MongoDB server began to receive but did not receive completely because the connection abruptly closed. Aborted Responses The number of requests that this MongoDB server began to receive but did not receive completely because the connection abruptly closed. - Server Processing Time
-
The Server Processing Time chart shows the median amount of
time the servers took to process requests from clients, measured in milliseconds. High
server processing times indicate that the servers in a group are slow.
Metric Description Server Processing Time When the device is acting as a MongoDB server, the time between the ExtraHop system detecting the last packet of the received request and first packet of the sent response.
MSMQ
The ExtraHop system collects metrics about Microsoft Message Queuing (MSMQ) activity. MSMQ is a protocol that enables applications to send messages and objects to each other.
| Note: | The ExtraHop system does not include any built-in metric pages for MSMQ. However, you can view MSMQ metrics by adding them to a custom page or dashboard. |
MSRPC
The ExtraHop system collects metrics about Microsoft Remote Procedure Call (MSRPC) activity. The MSRPC protocol enables a program to request service from a computer in another network, without having to understand the details of that particular network.
Security considerations
- MS-RPC enables administration utilities, such as PsExec, to send commands to remote devices. Attackers can take advantage of these utilities to compromise remote devices and laterally move across a network.
- MS-RPC commands can be leveraged by attackers to steal information from domain controllers (DCs). DCSync and DCShadow are examples of these attacks, which can lead to privilege escalation and Kerberos golden ticket attacks.
- Attack tools, such as Mimikatz, submit MS-RPC requests to DCs and other devices.
- Encrypted MS-RPC traffic is an increasingly common vector for malicious activity. You can configure the ExtraHop system to decrypt domain traffic to identify suspicious behaviors and potential attacks.
MSRPC client page
This page displays metric charts of MSRPC traffic associated with a device on your network.
- Learn about charts on this page:
- Learn about MSRPC security considerations
- Learn about working with metrics.
MSRPC Summary
The following charts are available in this region:
- Responses
- This chart shows you when the client received MSRPC responses and which of those
responses exceeded the maximum PDU body size.
Metric Description Responses The number of responses received by this MSRPC client. Response Fragments The number of responses received by this MSRPC client that exceeded the maximum PDU body size. - Total Responses
- This chart shows you how many MSRPC responses the client received and how many of
those responses exceeded the maximum PDU body size.
Metric Description Responses The number of responses received by this MSRPC client. Response Fragments The number of responses received by this MSRPC client that exceeded the maximum PDU body size. - Orphaned Calls
- This chart shows you when the client aborted requests in progress.
Metric Description Orphaned Calls The number of times a request aborted in progress when the device is acting as an MSRPC client. - Total Orphaned Calls
- This chart shows you how many requests the client aborted while in progress.
Metric Description Orphaned Calls The number of times a request aborted in progress when the device is acting as an MSRPC client. - Cancelled Operations
- This chart shows you when the client participated in MSRPC cancel operations.
Metric Description Cancelled Operations The number of cancel operations that this MSRPC client participated in. - Total Cancelled Operations
- This chart shows you how many MSRPC cancel operations the client participated
in.
Metric Description Cancelled Operations The number of cancel operations that this MSRPC client participated in.
MSRPC Traffic
The following charts are available in this region:
- Goodput Bit Rate
- This chart shows you the rate at which MSRPC goodput bits have been received and sent
by the client over time.
Metric Description Goodput Bytes In The number of goodput bytes received by this MSRPC client. Goodput refers to the throughput of the original data transferred and excludes other throughput such as protocol headers or retransmitted packets. Goodput Bytes Out The number of goodput bytes sent by this MSRPC client. Goodput refers to the throughput of the original data transferred and excludes other throughput such as protocol headers or retransmitted packets. - Total Goodput Bytes
- This chart shows you how many MSRPC goodput bytes have been received and sent by the
client.
Metric Description Goodput Bytes In The number of goodput bytes received by this MSRPC client. Goodput refers to the throughput of the original data transferred and excludes other throughput such as protocol headers or retransmitted packets. Goodput Bytes Out The number of goodput bytes sent by this MSRPC client. Goodput refers to the throughput of the original data transferred and excludes other throughput such as protocol headers or retransmitted packets. - Packet Rate
- This chart shows you the rate at which MSRPC packets have been received and sent by
the client over time.
Metric Description Packets In The number of packets received by this MSRPC client. Packets Out The number of packets sent by this MSRPC client. - Total Packets
- This chart shows you how many MSRPC packets have been received and sent by the
client.
Metric Description Packets In The number of packets received by this MSRPC client. Packets Out The number of packets sent by this MSRPC client.
MSRPC Metric Totals
The following charts are available in this region:
- Total Responses and Issues
- Displays the total number of responses and issues.
Metric Description Responses The number of responses received by this MSRPC client. Response Fragments The number of responses received by this MSRPC client that exceeded the maximum PDU body size. Orphaned Calls The number of times a request aborted in progress when the device is acting as an MSRPC client. Cancelled Operations The number of cancel operations that this MSRPC client participated in. Failed End-Point Mapper Binds When the device is acting as an MSRPC client, the number of times that the MSRPC server was unable to locate the current MSRPC application. Causes might include issues such as the server application failing to start or to initialize. Rejected Binds The number of remote procedure call (RPC) binds that were rejected by the server when the device is acting as an MSRPC client. Rejected binds occur when a server sends and receives bind updates from a peer server out of order. Fault PDUs The number of fault PDUs sent by this MSRPC client. - PDU Fragment Length
- This chart breaks out PDU fragment lengths in a box plot.
Metric Description PDU Fragment Length The distribution of fragment lengths (in bytes) exchanged when the device is acting as an MSRPC client.
MSRPC server page
This page displays metric charts of MSRPC traffic associated with a device on your network.
- Learn about charts on this page:
- Learn about MSRPC security considerations
- Learn about working with metrics.
MSRPC Summary
The following charts are available in this region:
- Responses
- This chart shows you when the server sent MSRPC responses and when the server received
responses that exceeded the maximum PDU body size.
Metric Description Responses The number of responses sent by this MSRPC server. Response Fragments The number of responses received by this MSRPC server that exceeded the maximum PDU body size. - Total Responses
- This chart shows you how many MSRPC responses the server sent and how many response
fragments the server received.
Metric Description Responses The number of responses sent by this MSRPC server. Response Fragments The number of responses received by this MSRPC server that exceeded the maximum PDU body size. - Orphaned Calls
- This chart shows you when clients aborted requests in progress on the MSRPC
server.
Metric Description Orphaned Calls The number of times that a client aborted a request in progress when the device is acting as an MSRPC server. - Total Orphaned Calls
- This chart shows you how many requests clients aborted while in progress on the MSRPC
server.
Metric Description Orphaned Calls The number of times that a client aborted a request in progress when the device is acting as an MSRPC server. - Cancelled Operations
- This chart shows you when the server participated in MSRPC cancel operations.
Metric Description Cancelled Operations The number of cancel operations that this MSRPC server participated in. - Total Cancelled Operations
- This chart shows you how many MSRPC cancel operations the server participated
in.
Metric Description Cancelled Operations The number of cancel operations that this MSRPC server participated in.
MSRPC Traffic
The following charts are available in this region:
- Goodput Bit Rate
- This chart shows you the rate at which MSRPC goodput bits were received and sent by
the server over time.
Metric Description Goodput Bytes In The number of goodput bytes received by this MSRPC server. Goodput refers to the throughput of the original data transferred and excludes other throughput such as protocol headers or retransmitted packets. Goodput Bytes Out The number of goodput bytes sent by this MSRPC server. Goodput refers to the throughput of the original data transferred and excludes other throughput such as protocol headers or retransmitted packets. - Total Goodput Bytes
- This chart shows you how many MSRPC goodput bytes have been received and sent by the
server.
Metric Description Goodput Bytes In The number of goodput bytes received by this MSRPC server. Goodput refers to the throughput of the original data transferred and excludes other throughput such as protocol headers or retransmitted packets. Goodput Bytes Out The number of goodput bytes sent by this MSRPC server. Goodput refers to the throughput of the original data transferred and excludes other throughput such as protocol headers or retransmitted packets. - Packet Rate
- This chart shows you the rate at which MSRPC packets were received and sent by the
server over time.
Metric Description Packets In The number of packets received by this MSRPC server. Packets Out The number of packets sent by this MSRPC server. - Total Packets
- This chart shows you how many MSRPC packets were received and sent by the
server.
Metric Description Packets In The number of packets received by this MSRPC server. Packets Out The number of packets sent by this MSRPC server.
MSRPC Metric Totals
The following charts are available in this region:
- Responses and Issues
- Displays the total number of responses and issues.
Metric Description Responses The number of responses sent by this MSRPC server. Response Fragments The number of responses received by this MSRPC server that exceeded the maximum PDU body size. Orphaned Calls The number of times that a client aborted a request in progress when the device is acting as an MSRPC server. Cancelled Operations The number of cancel operations that this MSRPC server participated in. Failed End-Point Mapper Binds The number of times that this MSRPC server was unable to locate the current MSRPC application. Causes might include issues such as the server application failing to start or to initialize. Rejected Binds The number of remote procedure call (RPC) binds that were rejected when the device is acting as an MSRPC server. Rejected binds occur when a server sends and receives bind updates from a peer server out of order. Fault PDUs The number of fault PDUs sent by this MSRPC server. - PDU Fragment Length
- This chart breaks out PDU fragment lengths in a box plot.
Metric Description PDU Fragment Length The distribution of fragment lengths (in bytes) exchanged when the device is acting as an MSRPC server.
MSRPC client group page
This page displays metric charts of MSRPC traffic associated with a device group on your network.
- Learn about charts on this page:
- Learn about MSRPC security considerations
- Learn about working with metrics.
MSRPC Summary for Group
The following charts are available in this region:
- Transactions
- This chart shows you when the clients received MSRPC responses and which of those
responses exceeded the maximum PDU body size.
Metric Description Responses The number of responses received by this MSRPC client. Response Fragments The number of responses received by this MSRPC client that exceeded the maximum PDU body size. - Total Transactions
- This chart shows you how many times MSRPC clients received MSRPC responses and which
of those responses exceeded the maximum PDU body size.
Metric Description Responses The number of responses received by this MSRPC client. Response Fragments The number of responses received by this MSRPC client that exceeded the maximum PDU body size.
MSRPC Details for Group
The following charts are available in this region:
- Top Group Members (MSRPC Servers)
- The most active MSRPC clients in the group. The ExtraHop system calculates these values by looking at the total number of MSRPC requests sent by the group and breaking those requests out by client.
MSRPC Metrics for Group
The following charts are available in this region:
- Total Requests and Responses
- Displays the total number of responses and issues.
Metric Description Responses The number of responses received by this MSRPC client. Response Fragments The number of responses received by this MSRPC client that exceeded the maximum PDU body size. Orphaned Calls The number of times a request aborted in progress when the device is acting as an MSRPC client. Cancelled Operations The number of cancel operations that this MSRPC client participated in. Failed End-Point Mapper Binds When the device is acting as an MSRPC client, the number of times that the MSRPC server was unable to locate the current MSRPC application. Causes might include issues such as the server application failing to start or to initialize. Rejected Binds The number of remote procedure call (RPC) binds that were rejected by the server when the device is acting as an MSRPC client. Rejected binds occur when a server sends and receives bind updates from a peer server out of order. Fault PDUs The number of fault PDUs sent by this MSRPC client.
MSRPC server group page
This page displays metric charts of MSRPC traffic associated with a device group on your network.
- Learn about charts on this page:
- Learn about MSRPC security considerations
- Learn about working with metrics.
MSRPC Summary for Group
The following charts are available in this region:
- Transactions
- This chart shows you when the servers sent MSRPC responses and when the servers
received responses that exceeded the maximum PDU body size.
Metric Description Responses The number of responses sent by this MSRPC server. Response Fragments The number of responses received by this MSRPC server that exceeded the maximum PDU body size. - Total Transactions
- This chart shows you how many times MSRPC servers sent RPC responses and when the
servers received responses that exceeded the maximum PDU body size.
Metric Description Responses The number of responses sent by this MSRPC server. Response Fragments The number of responses received by this MSRPC server that exceeded the maximum PDU body size.
MSRPC Details for Group
The following charts are available in this region:
- Top Group Members (MSRPC Servers)
- The most active MSRPC servers in the group. The ExtraHop system calculates these values by looking at the total number of MSRPC responses sent by the group and breaking those responses out by server.
MSRPC Metrics for Group
The following charts are available in this region:
- Total Requests and Responses
- Displays the total number of responses and issues.
Metric Description Responses The number of responses sent by this MSRPC server. Response Fragments The number of responses received by this MSRPC server that exceeded the maximum PDU body size. Orphaned Calls The number of times that a client aborted a request in progress when the device is acting as an MSRPC server. Cancelled Operations The number of cancel operations that this MSRPC server participated in. Failed End-Point Mapper Binds The number of times that this MSRPC server was unable to locate the current MSRPC application. Causes might include issues such as the server application failing to start or to initialize. Rejected Binds The number of remote procedure call (RPC) binds that were rejected when the device is acting as an MSRPC server. Rejected binds occur when a server sends and receives bind updates from a peer server out of order. Fault PDUs The number of fault PDUs sent by this MSRPC server.
NBNS
The ExtraHop system collects metrics about NetBIOS Name Service (NBNS) protocol activity. NBNS is a naming system for network hosts and resources.
| Note: | The ExtraHop system does not include any built-in metric pages for NBNS. However, you can view NBNS metrics by adding them to a custom page or dashboard. |
NetFlow
The ExtraHop system collects metrics about NetFlow activity.
Flow Networks
A flow network is a network device, such as a router or switch, that sends information about flows seen across the device. Summary pages provide built-in charts for the IP traffic that exits and enters through remote network devices, such as NetFlow traffic, for configured flow networks and flow interfaces.
Summary pages contain three regions with charts for top-level, summary data.
- Overview
- View the total amount of network throughput (average bits per second) traveling in and out of either the flow network or flow interface. For flow interfaces only, you can also view the bandwidth utilization of throughput traveling in and out of the flow interface.
- Protocols
- IP flow packets are typically transferred across the flow network or flow interface by UDP and TCP ports. View the total amount of traffic for each protocol and port that is transferring data in the bar chart. In the line chart, compare protocol and port throughput changes over time. You can also hover over the protocol and port name in the legend of the line chart to isolate protocol data in the chart.
- Endpoints
- View the amount data that devices (or endpoints) are sending and receiving across the
flow network or flow interface in the following ways:
- Top talker charts display individual devices with the highest volume of throughput.
- Top sender charts display the throughput for devices sending data.
- Top receiver charts display the throughput for devices receiving data.
- Conversation charts display the highest volume of throughput by flow between two devices (endpoints).
- Compare the top talkers, senders, and conversations in the bar chart.
- In the line chart, compare changes in throughput activity for individual devices over time.
- Hover over a device IP address in the line chart to isolate throughput data in the chart.
NetFlow application page
This page displays metric charts of NetFlow traffic associated with application containers on your network.
- Learn about charts on this page:
- Learn about working with metrics.
NetFlow Summary
- Throughput
- This chart shows NetFlow throughput over time by showing when bytes were
transmitted.
Metric Description NetFlow Bytes The number of L3 bytes associated with flow technologies. - Throughput Summary
- This chart shows the rate that NetFlow bytes are being transmitted.
Metric Description NetFlow Bytes The number of L3 bytes associated with flow technologies. - Total Traffic
- This chart shows the total number of NetFlow bytes that were transmitted.
Metric Description NetFlow Bytes The number of L3 bytes associated with flow technologies.
Protocols
- Top Protocols
- This chart shows which NetFlow protocols were most active over time by showing the
rate that bytes were transmitted, broken out by protocol.
Metric Description NetFlow Bytes by Protocol and Port The number of L3 bytes associated with flow technologies, listed by protocol and port number. - Top Protocols
- This chart shows which NetFlow protocols were most active.
Metric Description NetFlow Bytes by Protocol and Port The number of L3 bytes associated with flow technologies, listed by protocol and port number.
Endpoints
- Top Talkers
- This chart shows which IP addresses sent and received the most NetFlow data over
time.
Metric Description NetFlow Bytes by IP The number of L3 bytes associated with flow technologies, listed by IP address. - Top Talkers
- This chart shows which IP addresses sent and received the most NetFlow data.
Metric Description NetFlow Bytes by IP The number of L3 bytes associated with flow technologies, listed by IP address. - Top Senders
- This chart shows which IP addresses sent the most NetFlow data over time.
Metric Description NetFlow Bytes by Sender IP The number of L3 bytes associated with flow technologies, listed by the IP address of the sender. - Top Senders
- This chart shows which IP addresses sent the most NetFlow data.
Metric Description NetFlow Bytes by Sender IP The number of L3 bytes associated with flow technologies, listed by the IP address of the sender. - Top Receivers
- This chart shows which IP addresses received the most NetFlow data over time.
Metric Description NetFlow Bytes by Receiver IP The number of L3 bytes associated with flow technologies, listed by the IP address of the receiver. - Top Receivers
- This chart shows which IP addresses received the most NetFlow data.
Metric Description NetFlow Bytes by Receiver IP The number of L3 bytes associated with flow technologies, listed by the IP address of the receiver. - Top Conversations
- This chart shows which IP address pairs exchanged the most NetFlow data over
time.
Metric Description NetFlow Bytes by Conversation The number of L3 bytes associated with flow technologies, listed by the IP addresses of the flow endpoints. - Top Conversations
- This chart shows which IP address pairs exchanged the most NetFlow data.
Metric Description NetFlow Bytes by Conversation The number of L3 bytes associated with flow technologies, listed by the IP addresses of the flow endpoints.
NFS
The ExtraHop system collects metrics about Network File System (NFS) activity. NFS is a distributed file system protocol that provides client access to files on a network attached storage (NAS) repository, typically in a UNIX environment. The ExtraHop system supports NFSv2, NFSv3, and NFSv4.
Security considerations
- NFS authentication can be vulnerable to brute force, which is a method for guessing credentials by submitting numerous authentication requests with different username and password combinations.
- NFS can be vulnerable to ransomware malware, which performs thousands of reads and writes over NFS to encrypt files that are stored on file servers across the network.
NFS client page
This page displays metric charts of NFS traffic associated with a device on your network.
- Learn about charts on this page:
- Learn about NFS security considerations
- Learn about working with metrics.
NFS Summary
The following charts are available in this region:
- Transactions
- This chart shows you when NFS errors occurred and how many responses the NFS client
received. This information can help you see how active the client was at the time it
received the errors.
If you see a large number of errors, you can view details about each error, including the error code. However, if the number of errors is low, the issue might be more complex, and you should examine the ratio of requests to responses. In a healthy environment, the number of requests and responses should be roughly equal. For more information, see Requests and Responses.
Tip: To see which error codes the client received, click Errors and select Error from the menu. Metric Description Responses The number of responses that the device received when acting as an NFS client. Errors When the device is acting as an NFS client, the number of method calls that receive a result other than 'OK'. - Total Transactions
- This chart displays the total number of NFS responses the client received and how many
of those responses contained errors.
Metric Description Responses The number of responses that the device received when acting as an NFS client. Errors When the device is acting as an NFS client, the number of method calls that receive a result other than 'OK'. - Read and Write Operations
- This chart shows you when the NFS client performed read and write operations.
Metric Description Reads The number of NFS read requests that the device sent when acting as an NFS client. Writes The number of NFS write requests that the device sent when acting as an NFS client. - Total Operations
- This chart shows you how many read and write operations the NFS client
performed.
Metric Description Reads The number of NFS read requests that the device sent when acting as an NFS client. Writes The number of NFS write requests that the device sent when acting as an NFS client. - Performance Summary (95th Percentile)
-
This chart shows the 95th percentile of timing metrics, measured in
milliseconds. The transfer and processing time metrics show parts of a complete
transaction. The request transfer time shows how long the client took to transmit requests
onto the network; the server processing time shows how long servers took to process the
requests; and the response transfer time shows how long servers took to transmit responses
onto the network.
Transfer and processing times are calculated by measuring the time between when the first and last packets of requests and responses are seen by the ExtraHop system, as shown in the following figure:
It can be difficult to tell whether an issue is caused by a network or a device from looking only at transfer and processing times, because these metrics alone provide an incomplete picture. Therefore the round trip time (RTT) metric is also included in this chart. RTT metrics are a good indicator of how your network is performing. If you see high transfer or processing times, but the RTT is low, the issue is probably at the device-level. However, if the RTT, processing, and transfer times are all high, network latency might be affecting the transfer and processing times, and the issue might be with the network.
The RTT metric can help identify the source of the problem because it only measures how long an immediate acknowledgment takes to be sent from the client or server; it does not wait until all packets are delivered.
The ExtraHop system calculates the RTT value by measuring the time between the first packet of a request and the acknowledgment from the server, as shown in the following figure:
The request transfer time might be high because the client took a long time to transmit the request (possibly because the request was very large); however, the transfer time could also be high because the request took a long time to travel on the network (possibly because of network congestion).
Learn more about how the ExtraHop system calculates round trip time on the ExtraHop blog.
Metric Description Request Transfer Time When the device is acting as an NFS client, the time between the ExtraHop system detecting the first packet and last packet of sent requests. A high number might indicate a large request or network delay. Server Process Time When the device is acting as an NFS client, the time between the ExtraHop system detecting the last packet of the sent request and the first packet of the received response. Response Transfer Time When the device is acting as an NFS client, the time between the ExtraHop system detecting the first packet and last packet of received responses. A high number might indicate a large response or network delay. Round Trip Time The time between when an NFS client sent a packet that required an immediate acknowledgment and when the client received the acknowledgment. Round trip time (RTT) is a measurement of network latency. The Performance (95th percentile) chart shows the highest value for a time period while filtering outliers; the 95th percentile is the highest value that falls below 95% of the values for a sample period. By displaying the 95th value, rather than the true maximum, the chart gives you a more accurate view of the data:
- Performance (95th)
-
This chart shows the 95th percentile of timing
metrics, measured in milliseconds. If a client is acting slow, performance summary
metrics can help you figure out whether the network or servers are causing the issue.
These metrics show the 95th percentile amount of time that servers took to process
requests from the client versus the 95th percentile time that packets from those
requests (and their respective responses) took to be transmitted across the network.
High server processing times indicate that the client is contacting slow servers. High
TCP round trip times indicate that the client is communicating over slow
networks.
Metric Description Server Processing Time When the device is acting as an NFS client, the time between the ExtraHop system detecting the last packet of the sent request and the first packet of the received response. Round Trip Time The time between when an NFS client sent a packet that required an immediate acknowledgment and when the client received the acknowledgment. Round trip time (RTT) is a measurement of network latency.
NFS Details
The following charts are available in this region:
- Top Methods
- This chart shows which NFS methods the client called the most by breaking out the total number of requests the client sent by method.
- Top Status Codes
- This chart shows which NFS status codes the client received the most by breaking out the number of responses returned to the client by status code.
- Top Authentication Errors
- This chart shows which NFS authentication errors the client received the most by breaking out the number of responses returned to the client by error.
NFS Performance
The following charts are available in this region:
- Server Access Time Distribution
- This chart breaks out server access times in a histogram, measured in
milliseconds.
Metric Description Access Time When the device is acting as an NFS client, access time calculates the latency of a non-pipelined READ or WRITE command by file. The ExtraHop system detects when the last packet of the request is sent by the NFS client and when the first packet of the response is received by the NFS client. - Server Access Time
- This chart shows the median access time for the client, measured in
milliseconds.
Metric Description Access Time When the device is acting as an NFS client, access time calculates the latency of a non-pipelined READ or WRITE command by file. The ExtraHop system detects when the last packet of the request is sent by the NFS client and when the first packet of the response is received by the NFS client. - Server Processing Time Distribution
- This chart breaks out server access times in a histogram, measured in
milliseconds.
Metric Description Server Processing Time When the device is acting as an NFS client, the time between the ExtraHop system detecting the last packet of the sent request and the first packet of the received response. - Server Processing Time
-
This chart shows the median processing time for the client,
measured in milliseconds.
Metric Description Server Processing Time When the device is acting as an NFS client, the time between the ExtraHop system detecting the last packet of the sent request and the first packet of the received response. - Round Trip Time Distribution
-
This chart breaks out round trip times in a histogram to show the
most common round trip times, measured in milliseconds.
Metric Description Round Trip Time The time between when an NFS client sent a packet that required an immediate acknowledgment and when the client received the acknowledgment. Round trip time (RTT) is a measurement of network latency. - Round Trip Time
-
This chart shows the median round trip time for the client, measured in
milliseconds.
Metric Description Round Trip Time The time between when an NFS client sent a packet that required an immediate acknowledgment and when the client received the acknowledgment. Round trip time (RTT) is a measurement of network latency.
Network Data
This region shows you TCP information that is related to the current protocol. In general, host stalls indicate that there is an issue with either the server or the client, and network stalls indicate that there is an issue with the network.
- Host Stalls
- This chart shows the number of zero windows that were advertised or received by the
device. Devices control the amount of data they receive by specifying the number of
packets that can be sent to them over a given time period. When a device is sent more
data than it can process, the device advertises a zero window to ask its peer device to
stop sending packets completely until the device catches up. If you see a large number
of zero windows, a server or client might not be not fast enough to support the amount
of data being received.
Metric Definition Zero Windows In The number of zero windows that were sent to the device to stop the flow of data over the connection. A device advertises a Zero Window when incoming data is arriving too quickly to be processed. A large number of zero windows in indicates that a peer device was too slow to process the amount of data received.
Zero Windows Out The number of zero windows that were sent from the device to stop the flow of data. A device advertises a Zero Window when incoming data is arriving too quickly to be processed. A large number of zero windows out indicates that the client was too slow to process the amount of data received.
- Network Stalls
-
This chart shows the number of retransmission timeouts that occurred. Retransmission timeouts (RTOs) occur when a network drops too many packets, usually due to packet collisions or buffer exhaustion. If a device sends a request or response and does not receive confirmation within a specified amount of time, the device retransmits the request. If too many retransmissions are unacknowledged, an RTO occurs. If you see a large number of RTOs, the network might be too slow to support the current level of activity.
Metric Definition RTOs In The number of retransmission timeouts (RTOs) caused by network congestion as peers were sending data to the current device. An RTO is a 1-5 second stall in the TCP connection flow due to excessive retransmissions. If you see a large number of RTOs in, the device did not send an acknowledgment to the server quickly enough, or the network might be too slow to support the current level of activity. Depending on the timeout value configured in the operating system, this delay can be anywhere from 1 to 8 seconds.
RTOs Out The number of retransmission timeouts (RTOs) caused by network congestion as the device was sending data to its peers. An RTO is a 1-5 second stall in the TCP connection flow due to excessive retransmissions. If you see a large number of RTOs out, the device did not receive an acknowledgment from the server quickly enough, or the network might be too slow to support the current level of activity. Depending on the timeout value configured in the operating system, this delay can be anywhere from 1 to 8 seconds.
NFS Metric Totals
The following charts are available in this region:
- Total Requests and Responses
- Requests and responses represent the conversation taking place between clients and
servers. If there are more requests than responses, the client might be sending more
requests than the servers can handle or the network might be too slow. To identify
whether the issue is with the network or the server, check RTOs and zero windows in the
Network Data
section.
Note: It is unlikely that the total number of NFS requests and responses will be exactly equal, even in a healthy environment. For example, you might be viewing a time period that captures a response to a request that was sent before the start of the time period. In general, the greater the difference between responses and errors, the greater the chance that there is an issue with those transactions. Metric Description Requests The number of NFS requests that the device sent when acting as an NFS client. Responses The number of responses that the device received when acting as an NFS client. Aborted Requests The number of incomplete requests that this NFS client device sent because the connection abruptly closed. Reads The number of NFS read requests that the device sent when acting as an NFS client. Writes The number of NFS write requests that the device sent when acting as an NFS client. Retransmissions The number of NFS requests for which the retransmission timer expired and the request was retried when the device is acting as an NFS client. Errors When the device is acting as an NFS client, the number of method calls that receive a result other than 'OK'. - Request and Response Sizes
- This chart shows the average size of requests and responses.
Metric Description Request Size The distribution of sizes (in bytes) of requests that the device sent when acting as an NFS client. Response Size The distribution of sizes (in bytes) of responses that the device received when acting as an NFS client.
NFS server page
This page displays metric charts of NFS traffic associated with a device on your network.
- Learn about charts on this page:
- Learn about NFS security considerations
- Learn about working with metrics.
NFS Summary
The following charts are available in this region:
- Transactions
- This chart shows you when NFS errors occurred and how many NFS responses the server
sent. This information can help you see how active the server was at the time it
returned the errors.
If you see a large number of errors, you can view details about each error, including the error code. However, if the number of errors is low, the issue might be more complex, and you should examine the ratio of requests to responses. In a healthy environment, the number of requests and responses should be roughly equal. For more information, see Requests and Responses.
Tip: To see which error codes the client received, click Errors and select Error from the menu. Metric Description Responses The number of responses that the device sent when acting as an NFS server. Errors When the device is acting as an NFS server, the number of method calls that receive a result other than 'OK'. - Total Transactions
- This chart displays the total number of NFS responses the server sent and how many of
those responses contained errors.
Metric Description Responses The number of responses that the device sent when acting as an NFS server. Errors When the device is acting as an NFS server, the number of method calls that receive a result other than 'OK'. - Read and Write Operations
- This chart shows you when the read and write operations were performed on the NFS
server.
Metric Description Reads The number of NFS read requests that the device received when acting as an NFS server. Writes The number of NFS write requests that the device received when acting as an NFS server. - Operations Summary
- This chart shows you how many read and write operations the NFS client
performed.
Metric Description Reads The number of NFS read requests that the device received when acting as an NFS server. Writes The number of NFS write requests that the device received when acting as an NFS server. - Performance Summary (95th Percentile)
-
This chart shows the 95th percentile of timing metrics, measured in
milliseconds. The transfer and processing time metrics show parts of a complete
transaction. The request transfer time shows how long clients took to transmit requests
onto the network; the server processing time shows how long the server took to process
requests; and the response transfer time shows how long the server took to transmit
responses onto the network.
Transfer and processing times are calculated by measuring the time between when the first and last packets of requests and responses are seen by the ExtraHop system, as shown in the following figure:
It can be difficult to tell whether an issue is caused by a network or a device from looking only at transfer and processing times, because these metrics alone provide an incomplete picture. Therefore the round trip time (RTT) metric is also included in this chart. RTT metrics are a good indicator of how your network is performing. If you see high transfer or processing times, but the RTT is low, the issue is probably at the device-level. However, if the RTT, processing, and transfer times are all high, network latency might be affecting the transfer and processing times, and the issue might be with the network.
The RTT metric can help identify the source of the problem because it only measures how long an immediate acknowledgment takes to be sent from the client or server; it does not wait until all packets are delivered.
The ExtraHop system calculates the RTT value by measuring the time between the first packet of a request and the acknowledgment from the server, as shown in the following figure:
The request transfer time might be high because the client took a long time to transmit the request (possibly because the request was very large); however, the transfer time could also be high because the request took a long time to travel on the network (possibly because of network congestion).
Learn more about how the ExtraHop system calculates round trip time on the ExtraHop blog.
Metric Description Request Transfer Time When the device is acting as an NFS server, the time between the ExtraHop system detecting the first packet and last packet of received requests. A high number might indicate a large request or network delay. Server Process Time When the device is acting as an NFS server, the time between the ExtraHop system detecting the last packet of the received request and first packet of the sent response. Response Transfer Time When the device is acting as an NFS server, the time between the ExtraHop system detecting the first packet and last packet of sent responses. A high number might indicate a large response or network delay. Round Trip Time The time between when a NFS server sent a packet that required an immediate acknowledgment and when the server received the acknowledgment. Round trip time (RTT) is a measurement of network latency. The Performance (95th percentile) chart shows the highest value for a time period while filtering outliers; the 95th percentile is the highest value that falls below 95% of the values for a sample period. By displaying the 95th value, rather than the true maximum, the chart gives you a more accurate view of the data:
- Performance (95th Percentile)
-
This chart shows the 95th percentile of timing
metrics, measured in milliseconds. If a server is acting slow, performance summary
metrics can help you figure out whether the network or the server is causing the
issue. The performance summary metrics show the 95th percentile amount of time the
server took to process requests from clients versus the 95th percentile time that
packets from those requests (and their respective responses) took to be transmitted
across the network. High server processing times indicate that the server is slow.
High RTTs indicate that the server is communicating over slow networks.
Metric Description Server Processing Time When the device is acting as an NFS server, the time between the ExtraHop system detecting the last packet of the received request and first packet of the sent response. Round Trip Time The time between when a NFS server sent a packet that required an immediate acknowledgment and when the server received the acknowledgment. Round trip time (RTT) is a measurement of network latency.
NFS Details
The following charts are available in this region:
- Top Methods
- This chart shows which NFS methods were called on the server the most by breaking out the total number of requests the server received by method.
- Top Status Codes
- This chart shows which NFS status codes the server returned the most by breaking out the total number of responses the server sent by status code.
- Top Authentication Errors
- This chart shows which NFS authentication errors the server returned the most by breaking out the total number of responses the server sent by authentication error.
NFS Performance
The following charts are available in this region:
- Server Access Time Distribution
- This chart breaks out server access times in a histogram, measured in
milliseconds.
Metric Description Access Time When the device is acting as an NFS server, access time calculates the latency of a non-pipelined READ or WRITE command by file. The ExtraHop system detects when the last packet of the request is received by the NFS server and when the first packet of the response is sent by the NFS server. - Server Access Time
- This chart shows the median access time for the server, measured in
milliseconds.
Metric Description Access Time When the device is acting as an NFS server, access time calculates the latency of a non-pipelined READ or WRITE command by file. The ExtraHop system detects when the last packet of the request is received by the NFS server and when the first packet of the response is sent by the NFS server. - Server Processing Time Distribution
- This chart breaks out server access times in a histogram, measured in
milliseconds.
Metric Description Server Processing Time When the device is acting as an NFS server, the time between the ExtraHop system detecting the last packet of the received request and first packet of the sent response. - Server Processing Time
-
This chart shows the median processing time for the server,
measured in milliseconds.
Metric Description Server Processing Time When the device is acting as an NFS server, the time between the ExtraHop system detecting the last packet of the received request and first packet of the sent response. - Round Trip Time Distribution
-
This chart breaks out round trip times in a histogram to show the
most common round trip times, measured in milliseconds.
Metric Description Round Trip Time The time between when a NFS server sent a packet that required an immediate acknowledgment and when the server received the acknowledgment. Round trip time (RTT) is a measurement of network latency. - Round Trip Time
-
This chart shows the median round trip time for the server, measured in
milliseconds.
Metric Description Round Trip Time The time between when a NFS server sent a packet that required an immediate acknowledgment and when the server received the acknowledgment. Round trip time (RTT) is a measurement of network latency.
Network Data
This region shows you TCP information that is related to the current protocol. In general, host stalls indicate that there is an issue with either the server or the client, and network stalls indicate that there is an issue with the network.
- Host Stalls
- This chart shows the number of zero windows that were advertised or received by the
device. Devices control the amount of data they receive by specifying the number of
packets that can be sent to them over a given time period. When a device is sent more
data than it can process, the device advertises a zero window to ask its peer device to
stop sending packets completely until the device catches up. If you see a large number
of zero windows, a server or client might not be not fast enough to support the amount
of data being received.
Metric Definition Zero Windows In The number of zero windows that were sent to the device to stop the flow of data over the connection. A device advertises a Zero Window when incoming data is arriving too quickly to be processed. A large number of zero windows in indicates that a peer device was too slow to process the amount of data received.
Zero Windows Out The number of zero windows that were sent from the device to stop the flow of data. A device advertises a Zero Window when incoming data is arriving too quickly to be processed. A large number of zero windows out indicates that the client was too slow to process the amount of data received.
- Network Stalls
-
This chart shows the number of retransmission timeouts that occurred. Retransmission timeouts (RTOs) occur when a network drops too many packets, usually due to packet collisions or buffer exhaustion. If a device sends a request or response and does not receive confirmation within a specified amount of time, the device retransmits the request. If too many retransmissions are unacknowledged, an RTO occurs. If you see a large number of RTOs, the network might be too slow to support the current level of activity.
Metric Definition RTOs In The number of retransmission timeouts (RTOs) caused by network congestion as peers were sending data to the current device. An RTO is a 1-5 second stall in the TCP connection flow due to excessive retransmissions. If you see a large number of RTOs in, the device did not send an acknowledgment to the server quickly enough, or the network might be too slow to support the current level of activity. Depending on the timeout value configured in the operating system, this delay can be anywhere from 1 to 8 seconds.
RTOs Out The number of retransmission timeouts (RTOs) caused by network congestion as the device was sending data to its peers. An RTO is a 1-5 second stall in the TCP connection flow due to excessive retransmissions. If you see a large number of RTOs out, the device did not receive an acknowledgment from the server quickly enough, or the network might be too slow to support the current level of activity. Depending on the timeout value configured in the operating system, this delay can be anywhere from 1 to 8 seconds.
NFS Metric Totals
The following charts are available in this region:
- Requests and Responses
- Requests and responses represent the conversation taking place between clients and
servers. If there are more requests than responses, clients might be sending more
requests than the server can handle or the network might be too slow. To identify
whether the issue is with the network or the server, check RTOs and zero windows in the
Network Data
section.
Note: It is unlikely that the total number of NFS requests and responses will be exactly equal, even in a healthy environment. For example, you might be viewing a time period that captures a response to a request that was sent before the start of the time period. In general, the greater the difference between responses and errors, the greater the chance that there is an issue with those transactions. Metric Description Requests The number of NFS requests that the device received when acting as an NFS server. Responses The number of responses that the device sent when acting as an NFS server. Aborted Requests The number of incomplete requests that this NFS server received because the connection abruptly closed. Reads The number of NFS read requests that the device received when acting as an NFS server. Writes The number of NFS write requests that the device received when acting as an NFS server. Retransmissions The number of NFS requests for which the retransmission timer expired and the request was retried when the device is acting as an NFS server. - Request and Response Sizes
- This chart shows the average size of requests and responses.
Metric Description Request Size The distribution of sizes (in bytes) of requests that the device received when acting as an NFS server. Response Size The distribution of sizes (in bytes) of responses that the device sent when acting as an NFS server.
NFS client group page
This page displays metric charts of NFS traffic associated with a device group on your network.
- Learn about charts on this page:
- Learn about NFS security considerations
- Learn about working with metrics.
NFS Summary for Group
The following charts are available in this region:
- Total Transactions
- This chart shows you when NFS errors occurred and how many responses the NFS clients
received. This information can help you see how active the clients were at the time they
received the errors.
If you see a large number of errors, you can view details about each error, including the error code. However, if the number of errors is low, the issue might be more complex, and you should examine the ratio of requests to responses. In a healthy environment, the number of requests and responses should be roughly equal. For more information, see the NFS Metrics for Group chart.
Tip: To see which error codes the client received, click Errors and select Error from the menu. Metric Description Responses The number of responses that the device received when acting as an NFS client. Errors When the device is acting as an NFS client, the number of method calls that receive a result other than 'OK'. - Total Transactions
- This chart shows you how many NFS responses the clients received and how many of those
responses contained errors.
Metric Description Responses The number of responses that the device received when acting as an NFS client. Errors When the device is acting as an NFS client, the number of method calls that receive a result other than 'OK'.
NFS Details for Group
The following charts are available in this region:
- Top Group Members (NFS Clients)
- This chart shows which NFS clients in the group were most active by breaking out the total number of NFS requests the group sent by client.
- Top Methods
- This chart shows which NFS methods the group called the most by breaking out the total number of requests the group sent by method.
- Top Status Codes
- This chart shows which NFS status codes the group received the most by breaking out the number of responses returned to the group by status code.
NFS Metrics for Group
The following charts are available in this region:
- Total Requests and Responses
-
Requests
and responses represent the conversation taking place between clients and servers. If there
are more requests than responses, the clients might be sending more requests than servers
can handle or the network might be too slow.
Note: It is unlikely that the total number of requests and responses will be exactly equal, even in a healthy environment. For example, you might be viewing a time period that captures a response to a request that was sent before the start of the time period. In general, the greater the difference between responses and errors, the greater the chance that there is an issue with those transactions. Metric Description Requests The number of NFS requests that the device sent when acting as an NFS client. Responses The number of responses that the device received when acting as an NFS client. Aborted Requests The number of incomplete requests that this NFS client device sent because the connection abruptly closed. Reads The number of NFS read requests that the device sent when acting as an NFS client. Writes The number of NFS write requests that the device sent when acting as an NFS client. Retransmissions The number of NFS requests for which the retransmission timer expired and the request was retried when the device is acting as an NFS client. Errors When the device is acting as an NFS client, the number of method calls that receive a result other than 'OK'. - Access Time
- If a client group is acting slow, the access time can help you figure out whether the
issue is with the servers. The Server Processing Time chart shows the median amount of
time servers took to process requests from the clients, measured in milliseconds. High
access times indicate that the clients are contacting slow servers.
Metric Description Access Time When the device is acting as an NFS client, access time calculates the latency of a non-pipelined READ or WRITE command by file. The ExtraHop system detects when the last packet of the request is sent by the NFS client and when the first packet of the response is received by the NFS client.
NFS server group page
This page displays metric charts of NFS traffic associated with a device group on your network.
- Learn about charts on this page:
- Learn about NFS security considerations
- Learn about working with metrics.
NFS Summary for Group
The following charts are available in this region:
- Total Transactions
- This chart shows you when NFS errors occurred and how many NFS responses the servers
sent. This information can help you see how active the servers were at the time they
returned the errors.
If you see a large number of errors, you can view details about each error, including the error code. However, if the number of errors is low, the issue might be more complex, and you should examine the ratio of NFS requests to NFS responses. In a healthy environment, the number of requests and responses should be roughly equal. For more information, see the NFS Metrics for Group chart.
Tip: To see which error codes the client received, click Errors and select Error from the menu. Metric Description Responses The number of responses that the device sent when acting as an NFS server. Errors When the device is acting as an NFS server, the number of method calls that receive a result other than 'OK'. - Total Transactions
- This chart shows you how many NFS responses servers in the group sent and how many of
those responses contained errors.
Metric Description Responses The number of responses that the device sent when acting as an NFS server. Errors When the device is acting as an NFS server, the number of method calls that receive a result other than 'OK'.
NFS Details for Group
The following charts are available in this region:
- Top Group Members (NFS Servers)
- This chart shows which NFS servers in the group were most active by breaking out the total number of NFS responses the group sent by server.
- Top Methods
- This chart shows which NFS methods were called on servers in the group the most by breaking out the total number of requests the group received by method.
- Top Status Code
- This chart shows which NFS status codes the groups returned the most by breaking out the total number of responses the group sent by status code.
NFS Metrics for Group
The following charts are available in this region:
- Total Requests and Responses
-
Requests
and responses represent the conversation taking place between clients and servers. If there
are more requests than responses, clients might be sending more requests than the servers
can handle or the network might be too slow.
Note: It is unlikely that the total number of requests and responses will be exactly equal, even in a healthy environment. For example, you might be viewing a time period that captures a response to a request that was sent before the start of the time period. In general, the greater the difference between responses and errors, the greater the chance that there is an issue with those transactions. Metric Description Requests The number of NFS requests that the device received when acting as an NFS server. Responses The number of responses that the device sent when acting as an NFS server. Aborted Requests The number of incomplete requests that this NFS server received because the connection abruptly closed. Reads The number of NFS read requests that the device received when acting as an NFS server. Writes The number of NFS write requests that the device received when acting as an NFS server. Retransmissions The number of NFS requests for which the retransmission timer expired and the request was retried when the device is acting as an NFS server. Responses When the device is acting as an NFS server, the number of method calls that receive a result other than 'OK'. - Access Time
- If a server group is acting slow, the Access Time chart can help you figure out
whether the issue is with the servers. The Access Time chart shows the median amount of
time the servers took to process requests from clients, measured in milliseconds. High
server access times indicate that the servers are slow.
Metric Description Access Time When the device is acting as an NFS server, access time calculates the latency of a non-pipelined READ or WRITE command by file. The ExtraHop system detects when the last packet of the request is received by the NFS server and when the first packet of the response is sent by the NFS server.
NTP
The ExtraHop system collects metrics about Network Time Protocol (NTP) activity. NTP is a protocol based on UDP that synchronizes clocks between devices on a network.
| Note: | The ExtraHop system does not include any built-in metric pages for NTP. However, you can view NTP metrics by adding them to a custom page or dashboard. |
NTLM
The ExtraHop system collects metrics about New Technology LAN Manager (NTLM) protocol activity. NTLM is a Microsoft security protocol that provides user authentication through a challenge-response mechanism instead of requiring users to send passwords over the network.
| Note: | The ExtraHop system does not include any built-in metric pages for NTLM. However, you can view NTLM metrics by adding them to a custom page or dashboard. |
POP3
The ExtraHop system collects metrics about Post Office Protocol version 3 (POP3) activity. POP3 is a standard application-level protocol that transfers email messages between a server and a client application over a TCP connection.
| Note: | The ExtraHop system does not include any built-in metric pages for POP3. However, you can add and display POP3 metrics in a custom page or dashboard. |
POP3 application page
This page displays metric charts of POP3 traffic associated with an application container on your network.
- Learn about charts on this page:
- Learn about working with metrics.
POP3 Summary
The following charts are available in this region:
- Transactions
- This chart shows you when POP3 errors and responses were associated with the
application. This information can help you see how active the application was at the
time the errors occurred.
In a healthy environment, the number of requests and responses should be roughly equal. For more information, see Requests and Responses.
Metric Description Responses The number of POP3 responses. Errors The number of POP3 response errors. - Total Transactions
- This chart displays the total number of POP3 responses that were associated with the
application and how many of those responses contained errors.
Metric Description Responses The number of POP3 responses. Errors The number of POP3 response errors. - Performance (95th Percentile)
-
This chart shows the 95th percentile of timing metrics,
measured in milliseconds. The transfer and processing time metrics show parts of a
complete transaction. The request transfer time shows how long clients took to transmit
requests onto the network; the server processing time shows how long the servers took to
process requests; and the response transfer time shows how long the servers took to
transmit responses onto the network.
Transfer and processing times are calculated by measuring the time between when the first and last packets of requests and responses are seen by the ExtraHop system, as shown in the following figure:
It can be difficult to tell whether an issue is caused by a network or a device from looking only at transfer and processing times, because these metrics alone provide an incomplete picture. Therefore the round trip time (RTT) metric is also included in this chart. RTT metrics are a good indicator of how your network is performing. If you see high transfer or processing times, but the RTT is low, the issue is probably at the device-level. However, if the RTT, processing, and transfer times are all high, network latency might be affecting the transfer and processing times, and the issue might be with the network.
The RTT metric can help identify the source of the problem because it only measures how long an immediate acknowledgment takes to be sent from the client or server; it does not wait until all packets are delivered.
The ExtraHop system calculates the RTT value by measuring the time between the first packet of a request and the acknowledgment from the server, as shown in the following figure:
The request transfer time might be high because the client took a long time to transmit the request (possibly because the request was very large); however, the transfer time could also be high because the request took a long time to travel on the network (possibly because of network congestion).
Learn more about how the ExtraHop system calculates round trip time on the ExtraHop blog.
Metric Description Request Transfer Time The time between the ExtraHop system detecting the first packet and last packet of POP3 requests. A high number might indicate a large request or network delay. Server Processing Time The time between the ExtraHop system detecting the last packet of POP3 requests and the first packet of their corresponding responses. Response Transfer Time The time between the ExtraHop system detecting the first packet and last packet of POP3 responses. A high number might indicate a large response or network delay. Round Trip Time The time between when an POP3 client or server sent a packet requiring immediate acknowledgment and when the acknowledgment was received. The Performance (95th percentile) chart shows the highest value for a time period while filtering outliers; the 95th percentile is the highest value that falls below 95% of the values for a sample period. By displaying the 95th value, rather than the true maximum, the chart gives you a more accurate view of the data:
- Performance (95th)
-
This chart shows the 95th percentile of timing
metrics, measured in milliseconds. If an application is acting slow, performance
summary metrics can help you figure out whether the network or servers are causing the
issue. These metrics show the 95th percentile of time that servers took to process
requests from clients versus the 95th percentile time that packets from those requests
(and their respective responses) took to be transmitted across the network. High
server processing times indicate that clients are contacting slow servers. High TCP
round trip times indicate that clients are communicating over slow networks.
Metric Description Server Processing Time The time between the ExtraHop system detecting the last packet of POP3 requests and the first packet of their corresponding responses. Round Trip Time The time between when an POP3 client or server sent a packet requiring immediate acknowledgment and when the acknowledgment was received.
POP3 Details
The following charts are available in this region:
- Top Methods
- This chart shows which POP3 methods were associated with the application by breaking out the total number of POP3 requests by method.
- Top Errors
- This chart shows which POP3 errors were associated with the application the most by breaking out the number of responses by error.
POP3 Performance
The following charts are available in this region:
- Server Processing Time Distribution
-
This chart breaks out server processing times in a histogram to
show the most common processing times, measured in milliseconds.
Metric Description Processing Time The time between the ExtraHop system detecting the last packet of POP3 requests and the first packet of their corresponding responses. - Server Processing Time
-
This chart shows the median processing time for the
application, measured in milliseconds.
Metric Description Processing Time The time between the ExtraHop system detecting the last packet of POP3 requests and the first packet of their corresponding responses. - Round Trip Time Distribution
-
This chart breaks out round trip times in a histogram to show the
most common round trip times, measured in milliseconds.
Metric Description Round Trip Time The time between when an POP3 client or server sent a packet requiring immediate acknowledgment and when the acknowledgment was received. - Round Trip Time
-
This chart shows the median round trip time for the application,
measured in milliseconds.
Metric Description Round Trip Time The time between when an POP3 client or server sent a packet requiring immediate acknowledgment and when the acknowledgment was received.
Network Data
This region shows you TCP information that is related to the current protocol. In general, host stalls indicate that there is an issue with either a server or a client, and network stalls indicate that there is an issue with the network.
- Host Stalls
-
This chart shows the number of zero windows that were
associated with an application. Devices control the amount of data they receive by
specifying the number of packets that can be sent to them over a given time period.
When a device is sent more data than it can process, the device advertises a zero
window to ask its peer device to stop sending packets completely until the device
catches up. If you see a large number of zero windows, a server or client might not be
not fast enough to support the amount of data being received.
Metric Definition Request Zero Windows The number of zero window advertisements sent by POP3 clients. A device advertises a Zero Window when incoming data is arriving too quickly to be processed. A large number of incoming Zero Windows indicates that a peer device was too slow to process the amount of data received.
Response Zero Windows The number of zero window advertisements sent by servers while receiving POP3 requests. A device advertises a Zero Window when incoming data is arriving too quickly to be processed. A large number of outgoing Zero Windows indicates that a client was too slow to process the amount of data received.
- Total Host Stalls
- This chart shows the median number of zero window advertisements sent by devices.
- Network Stalls
-
This chart shows the number of retransmission
timeouts that occurred. Retransmission timeouts (RTOs) occur when a network drops too
many packets, usually due to packet collisions or buffer exhaustion. If a device sends
a request or response and does not receive confirmation within a specified amount of
time, the device retransmits the request. If too many retransmissions are
unacknowledged, an RTO occurs. If you see a large number of RTOs, the network might be
too slow to support the current level of activity.
Metric Definition RTOs In The number of retransmission timeouts caused by congestion when clients were sending POP3 requests. An RTO is a 1-5 second stall in the TCP connection flow due to excessive retransmissions. If you see a large number of incoming RTOs, a device did not send an acknowledgment to the server quickly enough, or the network might be too slow to support the current level of activity. Depending on the timeout value configured in the operating system, this delay can be anywhere from 1 to 8 seconds.
RTOs Out The number of retransmission timeouts caused by congestion when servers were sending POP3 responses. An RTO is a 1-5 second stall in the TCP connection flow due to excessive retransmissions. If you see a large number of outgoing RTOs, a device did not receive an acknowledgment from the server quickly enough, or the network might be too slow to support the current level of activity. Depending on the timeout value configured in the operating system, this delay can be anywhere from 1 to 8 seconds.
- Total Network Stalls
-
This chart shows the median number of
retransmission timeouts caused by congestion when clients and servers were sending
requests.
Metric Definition RTOs In The number of retransmission timeouts caused by congestion when clients were sending POP3 requests. An RTO is a 1-5 second stall in the TCP connection flow due to excessive retransmissions. If you see a large number of incoming RTOs, a device did not send an acknowledgment to the server quickly enough, or the network might be too slow to support the current level of activity. Depending on the timeout value configured in the operating system, this delay can be anywhere from 1 to 8 seconds.
RTOs Out The number of retransmission timeouts caused by congestion when servers were sending POP3 responses. An RTO is a 1-5 second stall in the TCP connection flow due to excessive retransmissions. If you see a large number of outgoing RTOs, a device did not receive an acknowledgment from the server quickly enough, or the network might be too slow to support the current level of activity. Depending on the timeout value configured in the operating system, this delay can be anywhere from 1 to 8 seconds.
POP3 Metric Totals
The following charts are available in this region:
- Total Requests and Responses
-
Requests and responses represent the conversation taking place between clients and servers. If there are more requests than responses, clients might be sending more requests than servers can handle or the network might be too slow. To identify whether the issue is with the network or a server, check RTOs and zero windows in the Network Data section.
Note: It is unlikely that the total number of POP3 requests and responses will be exactly equal, even in a healthy environment. For example, you might be viewing a time period that captures a response to a request that was sent before the start of the time period. In general, the greater the difference between responses and errors, the greater the chance that there is an issue with those transactions. Metric Description Requests The number of POP3 requests. Responses The number of POP3 responses. Errors The number of POP3 response errors. Encrypted Sessions The number of encrypted POP3 sessions. - POP3 Network Metrics
-
Metric Description Request Zero Windows The number of zero window advertisements sent by POP3 clients. A device advertises a Zero Window when incoming data is arriving too quickly to be processed. Response Zero Windows The number of zero window advertisements sent by servers while receiving POP3 requests. A device advertises a Zero Window when incoming data is arriving too quickly to be processed. Request RTOs The number of retransmission timeouts caused by congestion when clients were sending POP3 requests. An RTO is a 1-5 second stall in the TCP connection flow due to excessive retransmissions. Response RTOs The number of retransmission timeouts caused by congestion when servers were sending POP3 responses. An RTO is a 1-5 second stall in the TCP connection flow due to excessive retransmissions. Request L2 Bytes The number of L2 bytes associated with POP3 requests. Response L2 Bytes The number of L2 bytes associated with POP3 responses. Request Goodput Bytes The number of goodput bytes associated with POP3 requests. Goodput refers to the throughput of the original data transferred and excludes other throughput such as protocol headers or retransmitted packets. Response Goodput Bytes The number of goodput bytes associated with POP3 responses. Goodput refers to the throughput of the original data transferred and excludes other throughput such as protocol headers or retransmitted packets. Request Packets The number of packets associated with POP3 requests. Response Packets The number of packets associated with POP3 responses.
POP3 client page
This page displays metric charts of POP3 traffic associated with a device on your network.
- Learn about charts on this page:
- Learn about working with metrics.
POP3 Summary
The following charts are available in this region:
- Transactions
- This chart shows you when POP3 errors occurred and how many responses the POP3 client
received. This information can help you see how active the client was at the time it
received the errors.
However, if the number of errors is low, the issue might be more complex, and you should examine the ratio of requests to responses. In a healthy environment, the number of requests and responses should be roughly equal. For more information, see Requests and Responses.
Metric Description Responses The number of responses that the device received when acting as an POP3 client. Sessions The number of sessions that the device participated in when acting as an POP3 client. - Total Transactions
- This chart displays the total number of POP3 responses the client received and how
many of those responses contained errors.
Metric Description Responses The number of responses that the device received when acting as an POP3 client. Errors When the device is acting as an POP3 client, the number of command responses received that have a reply code >= 400. - Sessions
- This chart shows you when the client participated in POP3 sessions.
Metric Description Sessions The number of sessions that the device participated in when acting as an POP3 client. Encrypted Sessions The number of encrypted sessions that the device participated in when acting as an POP3 client. - Total Sessions
- This chart displays the total number of POP3 sessions that the client participated in
and how many of those sessions were encrypted.
Metric Description Sessions The number of sessions that the device participated in when acting as an POP3 client. Encrypted Sessions The number of encrypted sessions that the device participated in when acting as an POP3 client. - Performance Summary (95th Percentile)
-
This chart shows the 95th percentile of timing metrics, measured in
milliseconds. The transfer and processing time metrics show parts of a complete
transaction. The request transfer time shows how long the client took to transmit requests
onto the network; the server processing time shows how long servers took to process the
requests; and the response transfer time shows how long servers took to transmit responses
onto the network.
Transfer and processing times are calculated by measuring the time between when the first and last packets of requests and responses are seen by the ExtraHop system, as shown in the following figure:
It can be difficult to tell whether an issue is caused by a network or a device from looking only at transfer and processing times, because these metrics alone provide an incomplete picture. Therefore the round trip time (RTT) metric is also included in this chart. RTT metrics are a good indicator of how your network is performing. If you see high transfer or processing times, but the RTT is low, the issue is probably at the device-level. However, if the RTT, processing, and transfer times are all high, network latency might be affecting the transfer and processing times, and the issue might be with the network.
The RTT metric can help identify the source of the problem because it only measures how long an immediate acknowledgment takes to be sent from the client or server; it does not wait until all packets are delivered.
The ExtraHop system calculates the RTT value by measuring the time between the first packet of a request and the acknowledgment from the server, as shown in the following figure:
The request transfer time might be high because the client took a long time to transmit the request (possibly because the request was very large); however, the transfer time could also be high because the request took a long time to travel on the network (possibly because of network congestion).
Learn more about how the ExtraHop system calculates round trip time on the ExtraHop blog.
Metric Description Request Transfer Time When the device is acting as an POP3 client, the time between the ExtraHop system detecting the first packet and last packet of sent requests. A high number might indicate a large request or network delay. Server Processing Time When the device is acting as an POP3 client, the time between the ExtraHop system detecting the last packet of the sent request and the first packet of the received response. Response Transfer Time When the device is acting as an POP3 client, the time between the ExtraHop system detecting the first packet and last packet of received responses. A high number might indicate a large response or network delay. Round Trip Time The time between when a POP3 client sent a packet that required an immediate acknowledgment and when the client received the acknowledgment. Round trip time (RTT) is a measurement of network latency. The Performance (95th percentile) chart shows the highest value for a time period while filtering outliers; the 95th percentile is the highest value that falls below 95% of the values for a sample period. By displaying the 95th value, rather than the true maximum, the chart gives you a more accurate view of the data:
- Performance (95th Percentile)
-
This chart shows the 95th percentile of timing
metrics, measured in milliseconds. If a client is acting slow, performance summary
metrics can help you figure out whether the network or servers are causing the issue.
These metrics show the 95th percentile amount of time that servers took to process
requests from the client versus the 95th percentile time that packets from those
requests (and their respective responses) took to be transmitted across the network.
High server processing times indicate that the client is contacting slow servers. High
TCP round trip times indicate that the client is communicating over slow
networks.
Metric Description Server Processing Time When the device is acting as an POP3 client, the time between the ExtraHop system detecting the last packet of the sent request and the first packet of the received response. Round Trip Time The time between when a POP3 client sent a packet that required an immediate acknowledgment and when the client received the acknowledgment. Round trip time (RTT) is a measurement of network latency.
POP3 Details
The following charts are available in this region:
- Top Methods
- This chart shows which POP3 methods the client called the most by breaking out the total number of requests the client sent by method.
- Top Errors
- This chart shows which POP3 errors the client received the most by breaking out the number of responses returned to the client by error.
POP3 Performance
The following charts are available in this region:
- Server Processing Time Distribution
-
This chart breaks out server processing times in a histogram to
show the most common processing times, measured in milliseconds.
Metric Description Server Processing Time When the device is acting as an POP3 client, the time between the ExtraHop system detecting the last packet of the sent request and the first packet of the received response. - Server Processing Time
-
This chart shows the median processing time for the client,
measured in milliseconds.
Metric Description Server Processing Time When the device is acting as an POP3 client, the time between the ExtraHop system detecting the last packet of the sent request and the first packet of the received response. - Round Trip Time Distribution
-
This chart breaks out round trip times in a histogram to show the
most common round trip times, measured in milliseconds.
Metric Description Round Trip Time The time between when a POP3 client sent a packet that required an immediate acknowledgment and when the client received the acknowledgment. Round trip time (RTT) is a measurement of network latency. - Round Trip Time
-
This chart shows the median round trip time for the client, measured in
milliseconds.
Metric Description Round Trip Time The time between when a POP3 client sent a packet that required an immediate acknowledgment and when the client received the acknowledgment. Round trip time (RTT) is a measurement of network latency.
Network Data
This region shows you TCP information that is related to the current protocol. In general, host stalls indicate that there is an issue with either the server or the client, and network stalls indicate that there is an issue with the network.
- Host Stalls
- This chart shows the number of zero windows that were advertised or received by the
device. Devices control the amount of data they receive by specifying the number of
packets that can be sent to them over a given time period. When a device is sent more
data than it can process, the device advertises a zero window to ask its peer device to
stop sending packets completely until the device catches up. If you see a large number
of zero windows, a server or client might not be not fast enough to support the amount
of data being received.
Metric Definition Zero Windows In The number of zero windows that were sent to the device to stop the flow of data over the connection. A device advertises a Zero Window when incoming data is arriving too quickly to be processed. A large number of zero windows in indicates that a peer device was too slow to process the amount of data received.
Zero Windows Out The number of zero windows that were sent from the device to stop the flow of data. A device advertises a Zero Window when incoming data is arriving too quickly to be processed. A large number of zero windows out indicates that the client was too slow to process the amount of data received.
- Network Stalls
-
This chart shows the number of retransmission timeouts that occurred. Retransmission timeouts (RTOs) occur when a network drops too many packets, usually due to packet collisions or buffer exhaustion. If a device sends a request or response and does not receive confirmation within a specified amount of time, the device retransmits the request. If too many retransmissions are unacknowledged, an RTO occurs. If you see a large number of RTOs, the network might be too slow to support the current level of activity.
Metric Definition RTOs In The number of retransmission timeouts (RTOs) caused by network congestion as peers were sending data to the current device. An RTO is a 1-5 second stall in the TCP connection flow due to excessive retransmissions. If you see a large number of RTOs in, the device did not send an acknowledgment to the server quickly enough, or the network might be too slow to support the current level of activity. Depending on the timeout value configured in the operating system, this delay can be anywhere from 1 to 8 seconds.
RTOs Out The number of retransmission timeouts (RTOs) caused by network congestion as the device was sending data to its peers. An RTO is a 1-5 second stall in the TCP connection flow due to excessive retransmissions. If you see a large number of RTOs out, the device did not receive an acknowledgment from the server quickly enough, or the network might be too slow to support the current level of activity. Depending on the timeout value configured in the operating system, this delay can be anywhere from 1 to 8 seconds.
POP3 Metric Totals
The following charts are available in this region:
- Total Requests and Responses
- Requests and responses represent the conversation taking place between clients and
servers. If there are more requests than responses, the client might be sending more
requests than the servers can handle or the network might be too slow. To identify
whether the issue is with the network or the server, check RTOs and zero windows in the
Network Data
section.
Note: It is unlikely that the total number of POP3 requests and responses will be exactly equal, even in a healthy environment. For example, you might be viewing a time period that captures a response to a request that was sent before the start of the time period. In general, the greater the difference between responses and errors, the greater the chance that there is an issue with those transactions. Metric Description Requests The number of requests that the device sent when acting as an POP3 client. Responses The number of responses that the device received when acting as an POP3 client. Aborted Requests The number of requests that this POP3 client began to send but did not send completely because the connection abruptly closed. Aborted Responses The number of responses that this POP3 client began to receive but did not receive completely because the connection abruptly closed. Encrypted Sessions The number of encrypted sessions that the device participated in when acting as an POP3 client. Errors When the device is acting as an POP3 client, the number of command responses received that have a reply code >= 400. - Request and Response Sizes
- This chart shows the average size of requests and responses.
Metric Description Request Size The distribution of sizes (in bytes) of requests that the device sent when acting as an POP3 client. Response Size The distribution of sizes (in bytes) of responses that the device received when acting as an POP3 client.
POP3 server page
This page displays metric charts of POP3 traffic associated with a device on your network.
- Learn about charts on this page:
- Learn about working with metrics.
POP3 Summary
The following charts are available in this region:
- Transactions
- This chart shows you when POP3 errors occurred and how many POP3 responses the server
sent. This information can help you see how active the server was at the time it
returned the errors.
However, if the number of errors is low, the issue might be more complex, and you should examine the ratio of requests to responses. In a healthy environment, the number of requests and responses should be roughly equal. For more information, see Requests and Responses.
Metric Description Responses The number of responses that the device sent when acting as an POP3 server. Sessions The number of sessions that the device participated in when acting as an POP3 server. - Total Transactions
- This chart displays the total number of POP3 responses the server sent and how many of
those responses contained errors.
Metric Description Responses The number of responses that the device sent when acting as an POP3 server. Sessions The number of sessions that the device participated in when acting as an POP3 server. Errors When the device is acting as an POP3 server, the number of command responses sent that have a reply code >= 400. - Sessions
- This chart shows you when the server participated in POP3 sessions.
Metric Description Sessions The number of sessions that the device participated in when acting as an POP3 server. Encrypted Sessions The number of encrypted sessions that the device participated in when acting as an POP3 server. - Total Sessions
- This chart displays the total number of POP3 sessions that the server participated in
and how many of those sessions were encrypted.
Metric Description Sessions The number of sessions that the device participated in when acting as an POP3 server. Encrypted Sessions The number of encrypted sessions that the device participated in when acting as an POP3 server. - Performance Summary (95th Percentile)
-
This chart shows the 95th percentile of timing metrics, measured in
milliseconds. The transfer and processing time metrics show parts of a complete
transaction. The request transfer time shows how long clients took to transmit requests
onto the network; the server processing time shows how long the server took to process
requests; and the response transfer time shows how long the server took to transmit
responses onto the network.
Transfer and processing times are calculated by measuring the time between when the first and last packets of requests and responses are seen by the ExtraHop system, as shown in the following figure:
It can be difficult to tell whether an issue is caused by a network or a device from looking only at transfer and processing times, because these metrics alone provide an incomplete picture. Therefore the round trip time (RTT) metric is also included in this chart. RTT metrics are a good indicator of how your network is performing. If you see high transfer or processing times, but the RTT is low, the issue is probably at the device-level. However, if the RTT, processing, and transfer times are all high, network latency might be affecting the transfer and processing times, and the issue might be with the network.
The RTT metric can help identify the source of the problem because it only measures how long an immediate acknowledgment takes to be sent from the client or server; it does not wait until all packets are delivered.
The ExtraHop system calculates the RTT value by measuring the time between the first packet of a request and the acknowledgment from the server, as shown in the following figure:
The request transfer time might be high because the client took a long time to transmit the request (possibly because the request was very large); however, the transfer time could also be high because the request took a long time to travel on the network (possibly because of network congestion).
Learn more about how the ExtraHop system calculates round trip time on the ExtraHop blog.
Metric Description Request Transfer Time When the device is acting as an POP3 server, the time between the ExtraHop system detecting the first packet and last packet of received requests. A high number might indicate a large request or network delay. Server Processing Time When the device is acting as an POP3 server, the time between the ExtraHop system detecting the last packet of the received request and first packet of the sent response. Response Transfer Time When the device is acting as an POP3 server, the time between the ExtraHop system detecting the first packet and last packet of sent responses. A high number might indicate a large response or network delay. Round Trip Time The time between when a POP3 server sent a packet that required an immediate acknowledgment and when the server received the acknowledgment. Round trip time (RTT) is a measurement of network latency. The Performance (95th percentile) chart shows the highest value for a time period while filtering outliers; the 95th percentile is the highest value that falls below 95% of the values for a sample period. By displaying the 95th value, rather than the true maximum, the chart gives you a more accurate view of the data:
- Performance (95th)
-
This chart shows the 95th percentile of timing
metrics, measured in milliseconds. If a server is acting slow, performance summary
metrics can help you figure out whether the network or the server is causing the
issue. The performance summary metrics show the 95th percentile amount of time the
server took to process requests from clients versus the 95th percentile time that
packets from those requests (and their respective responses) took to be transmitted
across the network. High server processing times indicate that the server is slow.
High RTTs indicate that the server is communicating over slow networks.
Metric Description Server Processing Time When the device is acting as an POP3 server, the time between the ExtraHop system detecting the last packet of the received request and first packet of the sent response. Round Trip Time The time between when a POP3 server sent a packet that required an immediate acknowledgment and when the server received the acknowledgment. Round trip time (RTT) is a measurement of network latency.
POP3 Details
The following charts are available in this region:
- Top Methods
- This chart shows which POP3 methods were called on the server the most by breaking out the total number of requests the server received by method.
- Top Errors
- This chart shows which POP3 errors the server returned the most by breaking out the total number of responses the server sent by error.
POP3 Performance
The following charts are available in this region:
- Server Processing Time Distribution
-
This chart breaks out server processing times in a histogram to
show the most common processing times, measured in milliseconds.
Metric Description Server Processing Time When the device is acting as an POP3 server, the time between the ExtraHop system detecting the last packet of the received request and first packet of the sent response. - Server Processing Time
-
This chart shows the median processing time for the server,
measured in milliseconds.
Metric Description Server Processing Time When the device is acting as an POP3 server, the time between the ExtraHop system detecting the last packet of the received request and first packet of the sent response. - Round Trip Time Distribution
-
This chart breaks out round trip times in a histogram to show the
most common round trip times, measured in milliseconds.
Metric Description Round Trip Time The time between when a POP3 server sent a packet that required an immediate acknowledgment and when the server received the acknowledgment. Round trip time (RTT) is a measurement of network latency. - Round Trip Time
-
This chart shows the median round trip time for the server, measured in
milliseconds.
Metric Description Round Trip Time The time between when a POP3 server sent a packet that required an immediate acknowledgment and when the server received the acknowledgment. Round trip time (RTT) is a measurement of network latency.
Network Data
This region shows you TCP information that is related to the current protocol. In general, host stalls indicate that there is an issue with either the server or the client, and network stalls indicate that there is an issue with the network.
- Host Stalls
- This chart shows the number of zero windows that were advertised or received by the
device. Devices control the amount of data they receive by specifying the number of
packets that can be sent to them over a given time period. When a device is sent more
data than it can process, the device advertises a zero window to ask its peer device to
stop sending packets completely until the device catches up. If you see a large number
of zero windows, a server or client might not be not fast enough to support the amount
of data being received.
Metric Definition Zero Windows In The number of zero windows that were sent to the device to stop the flow of data over the connection. A device advertises a Zero Window when incoming data is arriving too quickly to be processed. A large number of zero windows in indicates that a peer device was too slow to process the amount of data received.
Zero Windows Out The number of zero windows that were sent from the device to stop the flow of data. A device advertises a Zero Window when incoming data is arriving too quickly to be processed. A large number of zero windows out indicates that the client was too slow to process the amount of data received.
- Network Stalls
-
This chart shows the number of retransmission timeouts that occurred. Retransmission timeouts (RTOs) occur when a network drops too many packets, usually due to packet collisions or buffer exhaustion. If a device sends a request or response and does not receive confirmation within a specified amount of time, the device retransmits the request. If too many retransmissions are unacknowledged, an RTO occurs. If you see a large number of RTOs, the network might be too slow to support the current level of activity.
Metric Definition RTOs In The number of retransmission timeouts (RTOs) caused by network congestion as peers were sending data to the current device. An RTO is a 1-5 second stall in the TCP connection flow due to excessive retransmissions. If you see a large number of RTOs in, the device did not send an acknowledgment to the server quickly enough, or the network might be too slow to support the current level of activity. Depending on the timeout value configured in the operating system, this delay can be anywhere from 1 to 8 seconds.
RTOs Out The number of retransmission timeouts (RTOs) caused by network congestion as the device was sending data to its peers. An RTO is a 1-5 second stall in the TCP connection flow due to excessive retransmissions. If you see a large number of RTOs out, the device did not receive an acknowledgment from the server quickly enough, or the network might be too slow to support the current level of activity. Depending on the timeout value configured in the operating system, this delay can be anywhere from 1 to 8 seconds.
POP3 Metric Totals
The following charts are available in this region:
- Total Requests and Responses
- Requests and responses represent the conversation taking place between clients and
servers. If there are more requests than responses, clients might be sending more
requests than the server can handle or the network might be too slow. To identify
whether the issue is with the network or the server, check RTOs and zero windows in the
Network Data
section.
Note: It is unlikely that the total number of POP3 requests and responses will be exactly equal, even in a healthy environment. For example, you might be viewing a time period that captures a response to a request that was sent before the start of the time period. In general, the greater the difference between responses and errors, the greater the chance that there is an issue with those transactions. Metric Description Requests The number of requests that the device received when acting as an POP3 server. Responses The number of responses that the device sent when acting as an POP3 server. Aborted Requests The number of requests that this POP3 server began to receive but did not receive completely because the connection abruptly closed. Aborted Responses The number of responses that this POP3 server began to send but did not send completely because the connection abruptly closed. Encrypted Sessions The number of encrypted sessions that the device participated in when acting as an POP3 server. Errors When the device is acting as an POP3 server, the number of command responses sent that have a reply code >= 400. - Request and Response Sizes
- This chart shows the average size of requests and responses.
Metric Description Request Size The distribution of sizes (in bytes) of requests that the device received when acting as an POP3 server. Response Size The distribution of sizes (in bytes) of responses that the device received when acting as an POP3 server.
POP3 client group page
This page displays metric charts of POP3 traffic associated with a device group on your network.
- Learn about charts on this page:
- Learn about working with metrics.
POP3 Summary for Group
The following charts are available in this region:
- Transactions
- This chart shows you when POP3 errors occurred and how many responses the POP3 clients
received. This information can help you see how active the clients were at the time they
received the errors.
In a healthy environment, the number of requests and responses should be roughly equal. For more information, see the POP3 Metrics for Group section.
Metric Description Responses The number of responses that the device received when acting as an POP3 client. Errors When the device is acting as an POP3 client, the number of command responses received that have a reply code >= 400. - Total Transactions
- This chart shows you how many POP3 responses the clients received and how many of
those responses contained errors.
Metric Description Responses The number of responses that the device received when acting as an POP3 client. Errors When the device is acting as an POP3 client, the number of command responses received that have a reply code >= 400.
POP3 Details for Group
The following charts are available in this region:
- Top Group Members (POP3 Clients)
- This chart shows which POP3 clients in the group were most active by breaking out the total number of POP3 requests the group sent by client.
- Top Methods
- This chart shows which POP3 methods the group called the most by breaking out the total number of requests the group sent by method.
- Top Errors
- This chart shows which POP3 errors the group received the most by breaking out the number of responses returned to the group by error.
POP3 Metrics for Group
The following charts are available in this region:
- Total Requests and Responses
-
Requests
and responses represent the conversation taking place between clients and servers. If there
are more requests than responses, the clients might be sending more requests than servers
can handle or the network might be too slow.
Note: It is unlikely that the total number of requests and responses will be exactly equal, even in a healthy environment. For example, you might be viewing a time period that captures a response to a request that was sent before the start of the time period. In general, the greater the difference between responses and errors, the greater the chance that there is an issue with those transactions. Metric Description Requests The number of requests that the device sent when acting as an POP3 client. Responses The number of responses that the device received when acting as an POP3 client. Aborted Requests The number of requests that this POP3 client began to send but did not send completely because the connection abruptly closed. Aborted Responses The number of responses that this POP3 client began to receive but did not receive completely because the connection abruptly closed. Encrypted Sessions The number of encrypted sessions that the device participated in when acting as an POP3 client. Errors When the device is acting as an POP3 client, the number of command responses received that have a reply code >= 400. - Server Processing Time
-
If a client group is acting slow, the server processing time
can help you figure out whether the issue is with the servers. The Server Processing Time
chart shows the median amount of time servers took to process requests from the clients,
measured in milliseconds. High server processing times indicate that the clients are
contacting slow servers.
Metric Description Server Processing Time When the device is acting as an POP3 client, the time between the ExtraHop system detecting the last packet of the sent request and the first packet of the received response.
POP3 server group page
This page displays metric charts of POP3 traffic associated with a device group on your network.
- Learn about charts on this page:
- Learn about working with metrics.
POP3 Summary for Group
The following charts are available in this region:
- Transactions
- This chart shows you when POP3 errors occurred and how many POP3 responses the servers
sent. This information can help you see how active the servers were at the time they
returned the errors.
In a healthy environment, the number of requests and responses should be roughly equal. For more information, see the POP3 Metrics for Group section.
Metric Description Responses The number of responses that the device sent when acting as an POP3 server. Errors When the device is acting as an POP3 server, the number of command responses sent that have a reply code >= 400. - Total Transactions
- This chart shows you how many POP3 responses servers in the group sent and how many of
those responses contained errors.
Metric Description Responses The number of responses that the device sent when acting as an POP3 server. Errors When the device is acting as an POP3 server, the number of command responses sent that have a reply code >= 400.
POP3 Details for Group
The following charts are available in this region:
- Top Group Members (POP3 Servers)
- This chart shows which POP3 servers in the group were most active by breaking out the total number of POP3 responses the group sent by server.
- Top Methods
- This chart shows which POP3 methods were called on servers in the group the most by breaking out the total number of requests the group received by method.
- Top Errors
- This chart shows which POP3 errors the groups returned the most by breaking out the total number of responses the group sent by error.
POP3 Metrics for Group
The following charts are available in this region:
- Total Requests and Responses
-
Requests
and responses represent the conversation taking place between clients and servers. If there
are more requests than responses, clients might be sending more requests than the servers
can handle or the network might be too slow.
Note: It is unlikely that the total number of requests and responses will be exactly equal, even in a healthy environment. For example, you might be viewing a time period that captures a response to a request that was sent before the start of the time period. In general, the greater the difference between responses and errors, the greater the chance that there is an issue with those transactions. Metric Description Requests The number of requests that the device received when acting as an POP3 server. Responses The number of responses that the device sent when acting as an POP3 server. Aborted Requests The number of requests that this POP3 server began to receive but did not receive completely because the connection abruptly closed. Aborted Responses The number of responses that this POP3 server began to send but did not send completely because the connection abruptly closed. Encrypted Sessions The number of encrypted sessions that the device participated in when acting as an POP3 server. Errors When the device is acting as an POP3 server, the number of command responses sent that have a reply code >= 400. - Server Processing Time
-
The Server Processing Time chart shows the median amount of
time the servers took to process requests from clients, measured in milliseconds. High
server processing times indicate that the servers in a group are slow.
Metric Description Server Processing Time When the device is acting as an POP3 server, the time between the ExtraHop system detecting the last packet of the received request and first packet of the sent response.
QUIC
QUIC is an encrypted transport layer network protocol that establishes connections over UDP.
QUIC client page
This page displays metric charts of QUIC client traffic associated with a device on your network.
- Learn about charts on this page:
- Learn about working with metrics.
QUIC Summary
The following charts are available in this region:
- Connections
- This chart shows you when connections were established by the QUIC client
during the selected time interval.
Metric Description QUIC Connections The number of secure connections established by the QUIC client. - Total Connections
- This chart shows you the total number of connections established by the QUIC
client during the selected time interval.
Metric Description QUIC Connections The number of secure connections established by the QUIC client.
QUIC Traffic
The following charts are available in this region:
- Bytes In by Domain (SNI)
- This chart shows you the number of bytes received by the QUIC client, broken
out by Server Name Indication (SNI), and when the bytes were received during
the selected time interval. The SNI indicates the domain or hostname
connected to at the beginning of the handshake.
Metric Description Bytes In by Server Name Indication The number of goodput bytes received by the QUIC client, listed by the Server Name Indication (SNI). - Bytes Out by Domain (SNI)
- This chart shows you the number of bytes sent by the QUIC client, broken out
by Server Name Indication (SNI), and when the bytes were sent during the
selected time interval. The SNI indicates the domain or hostname connected
to at the beginning of the handshake.
Metric Description Bytes Out by Server Name Indication The number of goodput bytes sent by the QUIC client, listed by the Server Name Indication (SNI).
QUIC Details
The following charts are available in this region:
- Top Domains (SNI)
- This chart shows you the Server Name Indications (SNI) that had the most
connections established with the QUIC client, broken down by the number of
connections. The SNI indicates the domain or hostname connected to at the
beginning of the handshake.
Metric Description QUIC Connections by Server Name Indication The number of secure connections established by the QUIC client, listed by the Server Name Indication (SNI).
QUIC client group page
This page displays metric charts of QUIC client traffic associated with a device group on your network.
- Learn about charts on this page:
- Learn about working with metrics.
QUIC Summary for Group
The following charts are available in this region:
- Connections
- This chart shows you when connections were established by QUIC clients in
this device group during the selected time interval.
Metric Description QUIC Connections The number of secure connections established by the QUIC client. - Total Connections
- This chart shows you the total number of connections established by QUIC
clients in this device group during the selected time interval.
Metric Description QUIC Connections The number of secure connections established by the QUIC client.
QUIC Details
The following charts are available in this region:
- Top Group Members (QUIC Clients)
- This chart shows which QUIC clients in this device group were most active by
breaking out the total number of connections established by each QUIC
client.
Metric Description QUIC Connections The number of secure connections established by the QUIC client. - Top Domains (SNI)
- This chart shows you the Server Name Indications (SNI) that had the most
connections established with QUIC clients in this device group, broken down
by the number of connections. The SNI indicates the domain or hostname
connected to at the beginning of the handshake.
Metric Description QUIC Connections by Server Name Indication The number of secure connections established by the QUIC client, listed by the Server Name Indication (SNI).
QUIC server page
This page displays metric charts of QUIC server traffic associated with a device on your network.
- Learn about charts on this page:
- Learn about working with metrics.
QUIC Summary
The following charts are available in this region:
- Connections
- This chart shows you when connections were established with the QUIC server
during the selected time interval.
Metric Description QUIC Connections The number of secure connections established with the QUIC server. - Total Connections
- This chart shows you the total number of connections established with the
QUIC server during the selected time interval.
Metric Description QUIC Connections The number of secure connections established with the QUIC server.
QUIC Traffic
The following charts are available in this region:
- Bytes In by Domain (SNI)
- This chart shows you the number of bytes received by the QUIC server, broken
out by Server Name Indication (SNI), and when the bytes were received during
the selected time interval. The SNI indicates the domain or hostname
connected to at the beginning of the handshake.
Metric Description Bytes In by Server Name Indication The number of goodput bytes received by the QUIC server, listed by the Server Name Indication (SNI). - Bytes Out by Domain (SNI)
- This chart shows you the number of bytes sent by the QUIC server, broken out
by Server Name Indication (SNI), and when the bytes were sent during the
selected time interval. The SNI indicates the domain or hostname connected
to at the beginning of the handshake.
Metric Description Bytes Out by Server Name Indication The number of goodput bytes sent by the QUIC server, listed by the Server Name Indication (SNI).
QUIC Details
The following charts are available in this region:
- Top Domains (SNI)
- This chart shows you the Server Name Indications (SNI) that had the most
connections established with the QUIC server, broken down by the number of
connections. The SNI indicates the domain or hostname connected to at the
beginning of the handshake.
Metric Description QUIC Connections by Server Name Indication The number of secure connections established with the QUIC server, listed by the Server Name Indication (SNI).
QUIC server group page
This page displays metric charts of QUIC server traffic associated with a device group on your network.
- Learn about charts on this page:
- Learn about working with metrics.
QUIC Summary for Group
The following charts are available in this region:
- Connections
- This chart shows you when connections were established with QUIC servers in
this device group during the selected time interval.
Metric Description QUIC Connections The number of secure connections established with the QUIC server. - Total Connections
- This chart shows you the total number of connections established with QUIC
servers in this device group during the selected time interval.
Metric Description QUIC Connections The number of secure connections established with the QUIC server.
QUIC Details
The following charts are available in this region:
- Top Group Members (QUIC Servers)
- This chart shows which QUIC servers in this device group were most active by
breaking out the total number of connections established by each QUIC
server.
Metric Description QUIC Connections The number of secure connections established with the QUIC server. - Top Domains (SNI)
- This chart shows you the Server Name Indications (SNI) that had the most
connections established with QUIC servers in this device group, broken down
by the number of connections. The SNI indicates the domain or hostname
connected to at the beginning of the handshake.
Metric Description QUIC Connections by Server Name Indication The number of secure connections established with the QUIC server, listed by the Server Name Indication (SNI).
RDP
The ExtraHop system collects metrics about Remote Desktop Protocol (RDP) activity. RDP is a proprietary Microsoft protocol for communicating between a Remote Desktop Session Host server and a client running Remote Desktop Connections software. RDP is encapsulated and encrypted within TCP.
Security considerations
- RDP authentication can be vulnerable to brute force, which is a method for guessing credentials by submitting numerous authentication requests with different username and password combinations.
- RDP should be disabled unless necessary to prevent unauthorized access to internal devices.
- Deprecated versions of RDP have known vulnerabilities such as BlueKeep.
- RDP is a remote service protocol that an attacker can leverage to interact with remote devices and laterally move across the network.
RDP application page
This page displays metric charts of RDP traffic associated with an application container on your network.
- Learn about charts on this page:
- Learn about RDP security considerations
- Learn about working with metrics.
RDP Summary
The following charts are available in this region:
- Sessions
- This chart shows you when RDP client connections were opened, when encrypted
connections were opened, and when errors were associated with the application. This
information can help you see how active the application was at the time the errors
occurred.
Metric Description Client Opens The number of RDP sessions that were opened by clients. Encrypted Opens The number of encrypted RDP sessions that were opened. Errors The number of errors that prevented RDP sessions from opening. - Total Sessions
- This chart displays the total numbers of RDP client connections, encrypted
connections, and errors that were associated with the application.
Metric Description Client Opens The number of RDP sessions that were opened by clients. Encrypted Opens The number of encrypted RDP sessions that were opened. Errors The number of errors that prevented RDP sessions from opening. - Round Trip Time
- This chart shows percentiles of round trip time (RTT) of RDP sessions. The RTT metric
measures how long it took for packets to get an immediate acknowledgment from the
client or server. Therefore, RTT is a good indicator of how your network is
performing.
Learn more about how the ExtraHop system calculates round trip time on the ExtraHop blog.
Metric Description Round Trip Time Round trip time (RTT) is a measurement of total network latency. The ExtraHop system calculates RTT by measuring the time taken to send an RDP packet and receive an immediate acknowledgment (ACK). - Round Trip Time
- This chart displays the 95th percentile for the RDP round trip time, measured in
milliseconds.
Metric Description Round Trip Time Round trip time (RTT) is a measurement of total network latency. The ExtraHop system calculates RTT by measuring the time taken to send an RDP packet and receive an immediate acknowledgment (ACK).
RDP Details
The following charts are available in this region:
- Top Errors
- This chart shows which RDP errors were associated with the application the most by
breaking out the number of responses by error.
Metric Description Errors The number of errors that prevented RDP sessions from opening.
RDP Performance
The following charts are available in this region:
- Round Trip Time Distribution
-
This chart breaks out round trip times in a histogram to show the
most common round trip times, measured in milliseconds.
Metric Description Round Trip Time Round trip time (RTT) is a measurement of total network latency. The ExtraHop system calculates RTT by measuring the time taken to send an RDP packet and receive an immediate acknowledgment (ACK). - Round Trip Time
-
This chart shows the median round trip time for the application,
measured in milliseconds.
Metric Description Round Trip Time Round trip time (RTT) is a measurement of total network latency. The ExtraHop system calculates RTT by measuring the time taken to send an RDP packet and receive an immediate acknowledgment (ACK).
RDP Network Data
This region shows you TCP information that is related to the current protocol. In general, host stalls indicate that there is an issue with either a server or a client, and network stalls indicate that there is an issue with the network.
- Host Stalls
-
This chart shows the number of zero windows that were
associated with an application. Devices control the amount of data they receive by
specifying the number of packets that can be sent to them over a given time period.
When a device is sent more data than it can process, the device advertises a zero
window to ask its peer device to stop sending packets completely until the device
catches up. If you see a large number of zero windows, a server or client might not be
not fast enough to support the amount of data being received.
Metric Definition Client Zero Windows The number of Zero Windows advertisements sent by RDP clients. A device advertises a Zero Window when incoming data is arriving too quickly to be processed. A large number of incoming Zero Windows indicates that a peer device was too slow to process the amount of data received.
Server Zero Windows The number of Zero Windows advertisements sent by RDP servers. A device advertises a Zero Window when incoming data is arriving too quickly to be processed. A large number of outgoing Zero Windows indicates that a client was too slow to process the amount of data received.
- Total Host Stalls
-
This chart shows the median number of zero window
advertisements sent by devices.
Metric Definition Client Zero Windows The number of Zero Windows advertisements sent by RDP clients. A device advertises a Zero Window when incoming data is arriving too quickly to be processed. A large number of incoming Zero Windows indicates that a peer device was too slow to process the amount of data received.
Server Zero Windows The number of Zero Windows advertisements sent by RDP servers. A device advertises a Zero Window when incoming data is arriving too quickly to be processed. A large number of outgoing Zero Windows indicates that a client was too slow to process the amount of data received.
- Network Stalls
-
This chart shows the number of retransmission
timeouts that occurred. Retransmission timeouts (RTOs) occur when a network drops too
many packets, usually due to packet collisions or buffer exhaustion. If a device sends
a request or response and does not receive confirmation within a specified amount of
time, the device retransmits the request. If too many retransmissions are
unacknowledged, an RTO occurs. If you see a large number of RTOs, the network might be
too slow to support the current level of activity.
Metric Definition Client RTOs The number of retransmission timeouts (RTOs) caused by network congestion as clients sent RDP data. An RTO is a 1-5 second stall in the TCP connection flow due to excessive retransmissions. If you see a large number of incoming RTOs, a device did not send an acknowledgment to the server quickly enough, or the network might be too slow to support the current level of activity. Depending on the timeout value configured in the operating system, this delay can be anywhere from 1 to 8 seconds.
Server RTOs The number of retransmission timeouts (RTOs) caused by network congestion as servers sent RDP data. An RTO is a 1-5 second stall in the TCP connection flow due to excessive retransmissions. If you see a large number of outgoing RTOs, a device did not receive an acknowledgment from the server quickly enough, or the network might be too slow to support the current level of activity. Depending on the timeout value configured in the operating system, this delay can be anywhere from 1 to 8 seconds.
- Total Network Stalls
-
This chart shows the median number of
retransmission timeouts caused by congestion when clients and servers were sending
requests.
Metric Definition Client RTOs The number of retransmission timeouts (RTOs) caused by network congestion as clients sent RDP data. An RTO is a 1-5 second stall in the TCP connection flow due to excessive retransmissions. If you see a large number of incoming RTOs, a device did not send an acknowledgment to the server quickly enough, or the network might be too slow to support the current level of activity. Depending on the timeout value configured in the operating system, this delay can be anywhere from 1 to 8 seconds.
Server RTOs The number of retransmission timeouts (RTOs) caused by network congestion as servers sent RDP data. An RTO is a 1-5 second stall in the TCP connection flow due to excessive retransmissions. If you see a large number of outgoing RTOs, a device did not receive an acknowledgment from the server quickly enough, or the network might be too slow to support the current level of activity. Depending on the timeout value configured in the operating system, this delay can be anywhere from 1 to 8 seconds.
RDP Metric Totals
The following charts are available in this region:
- Total Sessions
- This chart displays the total numbers of RDP client connections, encrypted
connections, and errors that were associated with the application.
Metric Description Client Opens The number of RDP sessions that were opened by clients. Encrypted Opens The number of encrypted RDP sessions that were opened. Errors The number of errors that prevented RDP sessions from opening. - RDP Network Metrics
-
Metric Description Client Zero Windows The number of Zero Windows advertisements sent by RDP clients. A device advertises a Zero Window when incoming data is arriving too quickly to be processed. Server Zero Windows The number of Zero Windows advertisements sent by RDP servers. A device advertises a Zero Window when incoming data is arriving too quickly to be processed. Client RTOs The number of retransmission timeouts (RTOs) caused by network congestion as clients sent RDP data. An RTO is a 1-5 second stall in the TCP connection flow due to excessive retransmissions. Server RTOs The number of retransmission timeouts (RTOs) caused by network congestion as servers sent RDP data. An RTO is a 1-5 second stall in the TCP connection flow due to excessive retransmissions. Client L2 Bytes The number of L2 bytes sent by RDP clients within this application. Server L2 Bytes The number of L2 bytes sent by RDP servers within this application. Client Goodput Bytes The number of goodput bytes sent by RDP clients within this application. Goodput refers to the throughput of the original data transferred and excludes other throughput such as protocol headers or retransmitted packets. Server Goodput Bytes The number of goodput bytes sent by RDP servers within this application. Goodput refers to the throughput of the original data transferred and excludes other throughput such as protocol headers or retransmitted packets. Client Packets The number of packets sent by RDP clients within this application. Server Packets The number of packets sent by RDP servers within this application. Client Nagle Delays The number of RDP connection delays for clients due to bad interactions between the Nagle algorithm and delayed acknowledgments (ACKs). Server Nagle Delays The number of RDP connection delays for servers due to bad interactions between the Nagle algorithm and delayed acknowledgments (ACKs).
RDP client page
This page displays metric charts of RDP traffic associated with a device on your network.
- Learn about charts on this page:
- Learn about RDP security considerations
- Learn about working with metrics.
RDP Summary
The following charts are available in this region:
- Sessions
- This chart shows you when the RDP client opened or participated in sessions,including
encrypted sessions, and when errors occurred. This information can help you see how
active the client was at the time the errors occurred.
Metric Description Sessions The number of currently active sessions associated with this RDP client. Opens The number of times this RDP client attempted to open a session. Encrypted Opens The number of times this RDP client attempted to open an encrypted session. Errors The number of errors that prevented this RDP client from opening a session. - Total Sessions
- This chart shows you the total number of sessions the RDP client opened or
participated in, the number of encrypted sessions, and the number of errors that
occurred.
Metric Description Sessions The number of currently active sessions associated with this RDP client. Opens The number of times this RDP client attempted to open a session. Encrypted Opens The number of times this RDP client attempted to open an encrypted session. Errors The number of errors that prevented this RDP client from opening a session. - Round Trip Time
- This chart shows percentiles of round trip time (RTT). The RTT metric measures how
long it took for packets to get an immediate acknowledgment from the RDP client.
Therefore, RTT is a good indicator of how your network is performing.
Learn more about how the ExtraHop system calculates round trip time on the ExtraHop blog.
Metric Description Round Trip Time The time between when an RDP client sent a packet that required an immediate acknowledgment and when the client received acknowledgment. Round trip time (RTT) is a measurement of network latency. - Round Trip Time
- This chart displays the 95th percentile for the RDP round trip time, measured in
milliseconds.
Metric Description Round Trip Time The time between when an RDP client sent a packet that required an immediate acknowledgment and when the client received acknowledgment. Round trip time (RTT) is a measurement of network latency.
RDP Details
The following charts are available in this region:
- Top Errors
- This chart shows which RDP errors the client received the most by breaking out the number of responses returned to the client by error message.
RDP Performance
The following charts are available in this region:
- Round Trip Time Distribution
-
This chart breaks out round trip times in a histogram to show the
most common round trip times, measured in milliseconds.
Metric Description Round Trip Time The time between when an RDP client sent a packet that required an immediate acknowledgment and when the client received acknowledgment. Round trip time (RTT) is a measurement of network latency. - Round Trip Time
-
This chart shows the median round trip time for the client, measured in
milliseconds.
Metric Description Round Trip Time The time between when an RDP client sent a packet that required an immediate acknowledgment and when the client received acknowledgment. Round trip time (RTT) is a measurement of network latency.
RDP Metric Totals
The following charts are available in this region:
- Total Sessions
- This chart shows you the total number of sessions the RDP client opened or
participated in, the number of encrypted sessions, and the number of errors that
occurred.
Metric Description Sessions The number of currently active sessions associated with this RDP client. Opens The number of times this RDP client attempted to open a session. Encrypted Opens The number of times this RDP client attempted to open an encrypted session. Errors The number of errors that prevented this RDP client from opening a session.
RDP server page
This page displays metric charts of RDP traffic associated with a device on your network.
- Learn about charts on this page:
- Learn about RDP security considerations
- Learn about working with metrics.
The following charts are available in this region:
RDP Summary
- Sessions
- This chart shows you when the RDP server opened or participated in sessions, including
encrypted sessions, and when errors occurred. This information can help you see how
active the RDP server was at the time the errors occurred.
Metric Description Sessions The number of currently active sessions associated with this RDP server. Opens The number of times an RDP client attempted to open a session on this server. Encrypted Opens The number of times an RDP client attempted to open an encrypted session on this server. Errors The number of errors that prevented an RDP client from opening a session on this server. - Total Sessions
- This chart shows you the total number of sessions the RDP server opened or
participated in, the number of encrypted sessions, and the number of errors that
occurred.
Metric Description Sessions The number of currently active sessions associated with this RDP server. Opens The number of times an RDP client attempted to open a session on this server. Encrypted Opens The number of times an RDP client attempted to open an encrypted session on this server. Errors The number of errors that prevented an RDP client from opening a session on this server. - Round Trip Time
- This chart shows percentiles of round trip time (RTT). The RTT metric measures how
long it took for packets to get an immediate acknowledgment from the RDP server.
Therefore, RTT is a good indicator of how your network is performing.
Learn more about how the ExtraHop system calculates round trip time on the ExtraHop blog.
Metric Description Round Trip Time The time between when an RDP server sent a packet that required an immediate acknowledgment and when the server received acknowledgment. Round trip time (RTT) is a measurement of network latency. - Round Trip Time
- This chart displays the 95th percentile for the RDP round trip time, measured in
milliseconds.
Metric Description Round Trip Time The time between when an RDP server sent a packet that required an immediate acknowledgment and when the server received acknowledgment. Round trip time (RTT) is a measurement of network latency.
RDP Details
The following charts are available in this region:
- Top Errors
- This chart shows which RDP errors the server returned the most by breaking out the total number of responses the server sent by error message.
RDP Performance
The following charts are available in this region:
- Round Trip Time Distribution
-
This chart breaks out round trip times in a histogram to show the
most common round trip times, measured in milliseconds.
Metric Description Round Trip Time The time between when an RDP server sent a packet that required an immediate acknowledgment and when the server received acknowledgment. Round trip time (RTT) is a measurement of network latency. - Round Trip Time
-
This chart shows the median round trip time for the server, measured in
milliseconds.
Metric Description Round Trip Time The time between when an RDP server sent a packet that required an immediate acknowledgment and when the server received acknowledgment. Round trip time (RTT) is a measurement of network latency.
RDP Metric Totals
The following charts are available in this region:
- Total Sessions
- This chart shows you the total number of sessions the RDP server opened or
participated in, the number of encrypted sessions, and the number of errors that
occurred.
Metric Description Sessions The number of currently active sessions associated with this RDP server. Opens The number of times an RDP client attempted to open a session on this server. Encrypted Opens The number of times an RDP client attempted to open an encrypted session on this server. Errors The number of errors that prevented an RDP client from opening a session on this server.
RDP client group page
This page displays metric charts of RDP traffic associated with a device group on your network.
- Learn about charts on this page:
- Learn about RDP security considerations
- Learn about working with metrics.
RDP Summary for Group
The following charts are available in this region:
- Sessions
- This chart shows you when RDP clients opened or participated in sessions and when
errors occurred. This information can help you see how active RDP clients were at the
time the errors occurred.
Metric Description Sessions The number of currently active sessions associated with this RDP client. Opens The number of times this RDP client attempted to open a session. Encrypted Opens The number of times this RDP client attempted to open an encrypted session. Errors The number of errors that prevented this RDP client from opening a session. - Total Sessions
- This chart shows you the total number of sessions opened or participated in by RDP
clients and how many errors occurred.
Metric Description Sessions The number of currently active sessions associated with this RDP client. Opens The number of times this RDP client attempted to open a session. Encrypted Opens The number of times this RDP client attempted to open an encrypted session. Errors The number of errors that prevented this RDP client from opening a session.
RDP Details for Group
The following charts are available in this region:
- Top Group Members (RDP Clients)
- This chart shows which RDP clients in the group were most active by breaking out the total number of RDP sessions by client.
RDP Metrics for Group
The following charts are available in this region:
- Total Sessions
- This chart shows you the total number of sessions opened or participated in by RDP
clients, the number of encrypted sessions, and how many errors occurred.
Metric Description Sessions The number of currently active sessions associated with this RDP client. Opens The number of times this RDP client attempted to open a session. Encrypted Opens The number of times this RDP client attempted to open an encrypted session. Errors The number of errors that prevented this RDP client from opening a session.
RDP server group page
This page displays metric charts of RDP traffic associated with a device group on your network.
- Learn about charts on this page:
- Learn about RDP security considerations
- Learn about working with metrics.
RDP Summary for Group
The following charts are available in this region:
- Sessions
- This chart shows you when RDP servers opened or participated in sessions and when
errors occurred. This information can help you see how active RDP servers were at the
time the errors occurred.
Metric Description Sessions The number of currently active sessions associated with this RDP server. Opens The number of times an RDP client attempted to open a session on this server. Encrypted Opens The number of times an RDP client attempted to open an encrypted session on this server. Errors The number of errors that prevented an RDP client from opening a session on this server. - Total Sessions
- This chart shows you the total number of sessions opened or participated in by RDP
servers and how many errors occurred.
Metric Description Sessions The number of currently active sessions associated with this RDP server. Opens The number of times an RDP client attempted to open a session on this server. Encrypted Opens The number of times an RDP client attempted to open an encrypted session on this server. Errors The number of errors that prevented an RDP client from opening a session on this server.
RDP Details for Group
The following charts are available in this region:
- Top Group Members (RDP Servers)
- This chart shows which RDP servers in the group were most active by breaking out the total number of RDP sessions by server.
RDP Metrics for Group
The following charts are available in this region:
- Total Sessions
- This chart shows you the total number of sessions opened or participated in by RDP
servers, the number of encrypted sessions, and how many errors occurred.
Metric Description Sessions The number of currently active sessions associated with this RDP server. Opens The number of times an RDP client attempted to open a session on this server. Encrypted Opens The number of times an RDP client attempted to open an encrypted session on this server. Errors The number of errors that prevented an RDP client from opening a session on this server.
Redis
The ExtraHop system collects metrics about Redis activity. Redis is an open-source, data structure server. Redis clients communicate with Redis servers over REdis Serialization Protocol (RESP).
| Note: | The ExtraHop system does not include built-in Redis metric pages for applications. However, you can add and display Redis application metrics in a custom page or dashboard. |
Redis client page
This page displays metric charts of Redis traffic associated with a device on your network.
- Learn about charts on this page:
- Learn about working with metrics.
Redis Summary
The following charts are available in this region:
- Transactions
- This chart shows you when Redis errors occurred and how many responses the Redis
client received. This information can help you see how active the client was at the time
it received the errors.
In a healthy environment, the number of requests and responses should be roughly equal. For more information, see Requests and Responses.
Metric Description Responses The number of responses that the device received when acting as an Redis client. Errors The number of Redis errors that were returned because of an unknown command or an operation was performed against the wrong data type. - Total Transactions
- This chart displays the total number of Redis responses the client received and how
many of those responses contained errors.
Metric Description Responses The number of responses that the device received when acting as an Redis client. Errors The number of Redis errors that were returned because of an unknown command or an operation was performed against the wrong data type. - Performance Summary (95th Percentile)
-
This chart shows the 95th percentile of timing metrics, measured in
milliseconds. The transfer and processing time metrics show parts of a complete
transaction. The request transfer time shows how long the client took to transmit requests
onto the network; the server processing time shows how long servers took to process the
requests; and the response transfer time shows how long servers took to transmit responses
onto the network.
Transfer and processing times are calculated by measuring the time between when the first and last packets of requests and responses are seen by the ExtraHop system, as shown in the following figure:
It can be difficult to tell whether an issue is caused by a network or a device from looking only at transfer and processing times, because these metrics alone provide an incomplete picture. Therefore the round trip time (RTT) metric is also included in this chart. RTT metrics are a good indicator of how your network is performing. If you see high transfer or processing times, but the RTT is low, the issue is probably at the device-level. However, if the RTT, processing, and transfer times are all high, network latency might be affecting the transfer and processing times, and the issue might be with the network.
The RTT metric can help identify the source of the problem because it only measures how long an immediate acknowledgment takes to be sent from the client or server; it does not wait until all packets are delivered.
The ExtraHop system calculates the RTT value by measuring the time between the first packet of a request and the acknowledgment from the server, as shown in the following figure:
The request transfer time might be high because the client took a long time to transmit the request (possibly because the request was very large); however, the transfer time could also be high because the request took a long time to travel on the network (possibly because of network congestion).
Learn more about how the ExtraHop system calculates round trip time on the ExtraHop blog.
Metric Description Request Transfer Time When the device is acting as a Redis client, the time between the ExtraHop system detecting the first packet and last packet of sent requests. High values might indicate a large request or network delay. Processing Time The number of responses that the device received when acting as an Redis client. Response Transfer Time When the device is acting as a Redis client, the time between the ExtraHop system detecting the first packet and last packet of received responses. High values might indicate a large response or network delay. Round Trip Time The time between when a Redis client sent a packet that required an immediate acknowledgment and when the client received the acknowledgment. Round trip time (RTT) is a measurement of network latency. The Performance (95th percentile) chart shows the highest value for a time period while filtering outliers; the 95th percentile is the highest value that falls below 95% of the values for a sample period. By displaying the 95th value, rather than the true maximum, the chart gives you a more accurate view of the data:
- Performance (95th)
-
This chart shows the 95th percentile of timing
metrics, measured in milliseconds. If a client is acting slow, performance summary
metrics can help you figure out whether the network or servers are causing the issue.
These metrics show the 95th percentile amount of time that servers took to process
requests from the client versus the 95th percentile time that packets from those
requests (and their respective responses) took to be transmitted across the network.
High server processing times indicate that the client is contacting slow servers. High
TCP round trip times indicate that the client is communicating over slow
networks.
Metric Description Processing Time The number of responses that the device received when acting as an Redis client. Round Trip Time The time between when a Redis client sent a packet that required an immediate acknowledgment and when the client received the acknowledgment. Round trip time (RTT) is a measurement of network latency.
Redis Details
The following charts are available in this region:
- Top Methods
- This chart shows which Redis methods the client called the most by breaking out the total number of requests the client sent by method.
- Top Errors
- This chart shows which Redis errors the client received the most by breaking out the number of responses returned to the client by error.
Redis Performance
The following charts are available in this region:
- Server Processing Time Distribution
-
This chart breaks out server processing times in a histogram to
show the most common processing times, measured in milliseconds.
Metric Description Server Processing Time The time between last byte of the request and the first byte of the response. - Server Processing Time
-
This chart shows the median processing time for the client,
measured in milliseconds.
Metric Description Server Processing Time The time between last byte of the request and the first byte of the response. - Round Trip Time Distribution
-
This chart breaks out round trip times in a histogram to show the
most common round trip times, measured in milliseconds.
Metric Description Round Trip Time The time between when a Redis client sent a packet that required an immediate acknowledgment and when the client received the acknowledgment. Round trip time (RTT) is a measurement of network latency. - Round Trip Time
-
This chart shows the median round trip time for the client, measured in
milliseconds.
Metric Description Round Trip Time The time between when a Redis client sent a packet that required an immediate acknowledgment and when the client received the acknowledgment. Round trip time (RTT) is a measurement of network latency.
Network Data
This region shows you TCP information that is related to the current protocol. In general, host stalls indicate that there is an issue with either the server or the client, and network stalls indicate that there is an issue with the network.
- Host Stalls
- This chart shows the number of zero windows that were advertised or received by the
device. Devices control the amount of data they receive by specifying the number of
packets that can be sent to them over a given time period. When a device is sent more
data than it can process, the device advertises a zero window to ask its peer device to
stop sending packets completely until the device catches up. If you see a large number
of zero windows, a server or client might not be not fast enough to support the amount
of data being received.
Metric Definition Zero Windows In The number of zero windows that were sent to the device to stop the flow of data over the connection. A device advertises a Zero Window when incoming data is arriving too quickly to be processed. A large number of zero windows in indicates that a peer device was too slow to process the amount of data received.
Zero Windows Out The number of zero windows that were sent from the device to stop the flow of data. A device advertises a Zero Window when incoming data is arriving too quickly to be processed. A large number of zero windows out indicates that the client was too slow to process the amount of data received.
- Network Stalls
-
This chart shows the number of retransmission timeouts that occurred. Retransmission timeouts (RTOs) occur when a network drops too many packets, usually due to packet collisions or buffer exhaustion. If a device sends a request or response and does not receive confirmation within a specified amount of time, the device retransmits the request. If too many retransmissions are unacknowledged, an RTO occurs. If you see a large number of RTOs, the network might be too slow to support the current level of activity.
Metric Definition RTOs In The number of retransmission timeouts (RTOs) caused by network congestion as peers were sending data to the current device. An RTO is a 1-5 second stall in the TCP connection flow due to excessive retransmissions. If you see a large number of RTOs in, the device did not send an acknowledgment to the server quickly enough, or the network might be too slow to support the current level of activity. Depending on the timeout value configured in the operating system, this delay can be anywhere from 1 to 8 seconds.
RTOs Out The number of retransmission timeouts (RTOs) caused by network congestion as the device was sending data to its peers. An RTO is a 1-5 second stall in the TCP connection flow due to excessive retransmissions. If you see a large number of RTOs out, the device did not receive an acknowledgment from the server quickly enough, or the network might be too slow to support the current level of activity. Depending on the timeout value configured in the operating system, this delay can be anywhere from 1 to 8 seconds.
Redis Metric Totals
The following charts are available in this region:
- Total Requests and Responses
- Requests and responses represent the conversation taking place between clients and
servers. If there are more requests than responses, the client might be sending more
requests than the servers can handle or the network might be too slow. To identify
whether the issue is with the network or the server, check RTOs and zero windows in the
Network Data
section.
Note: It is unlikely that the total number of Redis requests and responses will be exactly equal, even in a healthy environment. For example, you might be viewing a time period that captures a response to a request that was sent before the start of the time period. In general, the greater the difference between responses and errors, the greater the chance that there is an issue with those transactions. Metric Description Requests The number of requests that the device sent when acting as an Redis client. Responses The number of responses that the device received when acting as an Redis client. Aborted Requests The number of requests that were not completely transmitted because the connection timed out or the connection was closed with a TCP reset (RST) or FIN. Aborted Responses The number of responses that were not completely transmitted because the connection timed out or the connection was closed with a TCP reset (RST) or FIN. Errors The number of Redis errors that were returned because of an unknown command or an operation was performed against the wrong data type. - Request and Response Sizes
- This chart shows the average size of requests and responses.
Metric Description Request Size The distribution of sizes (in bytes) of requests that the device sent when acting as an Redis client. Response Size The distribution of sizes (in bytes) of responses that the device sent when acting as an Redis client.
Redis server page
This page displays metric charts of Redis traffic associated with a device on your network.
- Learn about charts on this page:
- Learn about working with metrics.
Redis Summary
The following charts are available in this region:
- Transactions
- This chart shows you when Redis errors occurred and how many Redis responses the
server sent. This information can help you see how active the server was at the time it
returned the errors.
In a healthy environment, the number of requests and responses should be roughly equal. For more information, see Requests and Responses.
Metric Description Responses The number of responses that the device sent when acting as an Redis server. Errors The number of errors that the device received when acting as an Redis server. - Total Transactions
- This chart displays the total number of Redis responses the server sent and how many
of those responses contained errors.
Metric Description Responses The number of responses that the device sent when acting as an Redis server. Errors The number of errors that the device received when acting as a Redis server. - Performance Summary (95th Percentile)
-
This chart shows the 95th percentile of timing metrics, measured in
milliseconds. The transfer and processing time metrics show parts of a complete
transaction. The request transfer time shows how long clients took to transmit requests
onto the network; the server processing time shows how long the server took to process
requests; and the response transfer time shows how long the server took to transmit
responses onto the network.
Transfer and processing times are calculated by measuring the time between when the first and last packets of requests and responses are seen by the ExtraHop system, as shown in the following figure:
It can be difficult to tell whether an issue is caused by a network or a device from looking only at transfer and processing times, because these metrics alone provide an incomplete picture. Therefore the round trip time (RTT) metric is also included in this chart. RTT metrics are a good indicator of how your network is performing. If you see high transfer or processing times, but the RTT is low, the issue is probably at the device-level. However, if the RTT, processing, and transfer times are all high, network latency might be affecting the transfer and processing times, and the issue might be with the network.
The RTT metric can help identify the source of the problem because it only measures how long an immediate acknowledgment takes to be sent from the client or server; it does not wait until all packets are delivered.
The ExtraHop system calculates the RTT value by measuring the time between the first packet of a request and the acknowledgment from the server, as shown in the following figure:
The request transfer time might be high because the client took a long time to transmit the request (possibly because the request was very large); however, the transfer time could also be high because the request took a long time to travel on the network (possibly because of network congestion).
Learn more about how the ExtraHop system calculates round trip time on the ExtraHop blog.
Metric Description Request Transfer Time When the device is acting as a Redis server, the time between the ExtraHop system detecting the first packet and last packet of received requests. High values might indicate a large request or network delay. Processing Time The number of responses that the device sent when acting as an Redis server. Response Transfer Time When the device is acting as a Redis server, the time between the ExtraHop system detecting the first packet and last packet of sent responses. High values might indicate a large response or network delay. Round Trip Time The time between when a Redis server sent a packet that required an immediate acknowledgment and when the server received the acknowledgment. Round trip time (RTT) is a measurement of network latency. The Performance (95th percentile) chart shows the highest value for a time period while filtering outliers; the 95th percentile is the highest value that falls below 95% of the values for a sample period. By displaying the 95th value, rather than the true maximum, the chart gives you a more accurate view of the data:
- Performance (95th)
-
This chart shows the 95th percentile of timing
metrics, measured in milliseconds. If a server is acting slow, performance summary
metrics can help you figure out whether the network or the server is causing the
issue. The performance summary metrics show the 95th percentile amount of time the
server took to process requests from clients versus the 95th percentile time that
packets from those requests (and their respective responses) took to be transmitted
across the network. High server processing times indicate that the server is slow.
High RTTs indicate that the server is communicating over slow networks.
Metric Description Processing Time The number of responses that the device sent when acting as an Redis server. Round Trip Time The time between when a Redis server sent a packet that required an immediate acknowledgment and when the server received the acknowledgment. Round trip time (RTT) is a measurement of network latency.
Redis Details
The following charts are available in this region:
- Top Methods
- This chart shows which Redis methods were called on the server the most by breaking out the total number of requests the server received by method.
- Top Error Types
- This chart shows which Redis errors the server returned the most by breaking out the total number of responses the server sent by error.
Redis Performance
The following charts are available in this region:
- Server Processing Time Distribution
-
This chart breaks out server processing times in a histogram to
show the most common processing times, measured in milliseconds.
Metric Description Server Processing Time The time between last byte of the request and the first byte of the response. - Server Processing Time
-
This chart shows the median processing time for the server,
measured in milliseconds.
Metric Description Server Processing Time The time between last byte of the request and the first byte of the response. - Round Trip Time Distribution
-
This chart breaks out round trip times in a histogram to show the
most common round trip times, measured in milliseconds.
Metric Description Round Trip Time The time between when a Redis server sent a packet that required an immediate acknowledgment and when the server received the acknowledgment. Round trip time (RTT) is a measurement of network latency. - Round Trip Time
-
This chart shows the median round trip time for the server, measured in
milliseconds.
Metric Description Round Trip Time The time between when a Redis server sent a packet that required an immediate acknowledgment and when the server received the acknowledgment. Round trip time (RTT) is a measurement of network latency.
Network Data
This region shows you TCP information that is related to the current protocol. In general, host stalls indicate that there is an issue with either the server or the client, and network stalls indicate that there is an issue with the network.
- Host Stalls
- This chart shows the number of zero windows that were advertised or received by the
device. Devices control the amount of data they receive by specifying the number of
packets that can be sent to them over a given time period. When a device is sent more
data than it can process, the device advertises a zero window to ask its peer device to
stop sending packets completely until the device catches up. If you see a large number
of zero windows, a server or client might not be not fast enough to support the amount
of data being received.
Metric Definition Zero Windows In The number of zero windows that were sent to the device to stop the flow of data over the connection. A device advertises a Zero Window when incoming data is arriving too quickly to be processed. A large number of zero windows in indicates that a peer device was too slow to process the amount of data received.
Zero Windows Out The number of zero windows that were sent from the device to stop the flow of data. A device advertises a Zero Window when incoming data is arriving too quickly to be processed. A large number of zero windows out indicates that the client was too slow to process the amount of data received.
- Network Stalls
-
This chart shows the number of retransmission timeouts that occurred. Retransmission timeouts (RTOs) occur when a network drops too many packets, usually due to packet collisions or buffer exhaustion. If a device sends a request or response and does not receive confirmation within a specified amount of time, the device retransmits the request. If too many retransmissions are unacknowledged, an RTO occurs. If you see a large number of RTOs, the network might be too slow to support the current level of activity.
Metric Definition RTOs In The number of retransmission timeouts (RTOs) caused by network congestion as peers were sending data to the current device. An RTO is a 1-5 second stall in the TCP connection flow due to excessive retransmissions. If you see a large number of RTOs in, the device did not send an acknowledgment to the server quickly enough, or the network might be too slow to support the current level of activity. Depending on the timeout value configured in the operating system, this delay can be anywhere from 1 to 8 seconds.
RTOs Out The number of retransmission timeouts (RTOs) caused by network congestion as the device was sending data to its peers. An RTO is a 1-5 second stall in the TCP connection flow due to excessive retransmissions. If you see a large number of RTOs out, the device did not receive an acknowledgment from the server quickly enough, or the network might be too slow to support the current level of activity. Depending on the timeout value configured in the operating system, this delay can be anywhere from 1 to 8 seconds.
Redis Metric Totals
The following charts are available in this region:
- Total Requests and Responses
- Requests and responses represent the conversation taking place between clients and
servers. If there are more requests than responses, clients might be sending more
requests than the server can handle or the network might be too slow. To identify
whether the issue is with the network or the server, check RTOs and zero windows in the
Network Data
section.
Note: It is unlikely that the total number of Redis requests and responses will be exactly equal, even in a healthy environment. For example, you might be viewing a time period that captures a response to a request that was sent before the start of the time period. In general, the greater the difference between responses and errors, the greater the chance that there is an issue with those transactions. Metric Description Requests The number of requests that the device received when acting as an Redis server. Responses The number of responses that the device sent when acting as an Redis server. Aborted Requests The number of requests that were not completely transmitted because the connection timed out or the connection was closed with a TCP reset (RST) or FIN. Aborted Responses The number of responses that were not completely transmitted because the connection timed out or the connection was closed with a TCP reset (RST) or FIN. Errors The number of Redis errors that were returned because of an unknown command or an operation was performed against the wrong data type. - Request and Response Sizes
- This chart shows the average size of requests and responses.
Metric Description Request Size The distribution of sizes (in bytes) of requests that the device sent when acting as an Redis server. Response Size The distribution of sizes (in bytes) of responses that the device sent when acting as an Redis server.
Redis client group page
This page displays metric charts of Redis traffic associated with a device group on your network.
- Learn about charts on this page:
- Learn about working with metrics.
Redis Summary for Group
The following charts are available in this region:
- Transactions
- This chart shows you when Redis errors occurred and how many responses the Redis
clients received. This information can help you see how active the clients were at the
time they received the errors.
In a healthy environment, the number of requests and responses should be roughly equal. For more information, see the Redis Metrics for Group section.
Metric Description Responses The number of responses that the device received when acting as an Redis client. Errors The number of errors that the device received when acting as a Redis client. - Total Transactions
- This chart shows you how many Redis responses the clients received and how many of
those responses contained errors.
Metric Description Responses The number of responses that the device received when acting as an Redis client. Errors The number of errors that the device received when acting as a Redis client.
Redis Details for Group
The following charts are available in this region:
- Top Group Members (Redis Clients)
- This chart shows which Redis clients in the group were most active by breaking out the total number of Redis requests the group sent by client.
- Top Methods
- This chart shows which Redis methods the group called the most by breaking out the total number of requests the group sent by method.
- Top Errors
- This chart shows which Redis errors the group received the most by breaking out the number of responses returned to the group by error.
Redis Metrics for Group
The following charts are available in this region:
- Total Requests and Responses
-
Requests
and responses represent the conversation taking place between clients and servers. If there
are more requests than responses, the clients might be sending more requests than servers
can handle or the network might be too slow.
Note: It is unlikely that the total number of requests and responses will be exactly equal, even in a healthy environment. For example, you might be viewing a time period that captures a response to a request that was sent before the start of the time period. In general, the greater the difference between responses and errors, the greater the chance that there is an issue with those transactions. Metric Description Requests The number of requests that the device sent when acting as an Redis client. Responses The number of responses that the device received when acting as an Redis client. Aborted Requests The number of requests that were not completely transmitted because the connection timed out or the connection was closed with a TCP reset (RST) or FIN. Aborted Responses The number of responses that were not completely transmitted because the connection timed out or the connection was closed with a TCP reset (RST) or FIN. Response Errors The number of Redis errors that were returned because of an unknown command or an operation was performed against the wrong data type. - Server Processing Time
-
If a client group is acting slow, the server processing time
can help you figure out whether the issue is with the servers. The Server Processing Time
chart shows the median amount of time servers took to process requests from the clients,
measured in milliseconds. High server processing times indicate that the clients are
contacting slow servers.
Metric Description Server Processing Time The number of responses that the device received when acting as an Redis client.
Redis server group page
This page displays metric charts of Redis traffic associated with a device group on your network.
- Learn about charts on this page:
- Learn about working with metrics.
Redis Summary for Group
The following charts are available in this region:
- Transactions
- This chart shows you when Redis errors occurred and how many Redis responses the
servers sent. This information can help you see how active the servers were at the time
they returned the errors.
In a healthy environment, the number of requests and responses should be roughly equal. For more information, see the Redis Metrics for Group section.
Metric Description Responses The number of responses that the device sent when acting as an Redis server. Errors The number of errors that the device received when acting as a Redis server. - Total Transactions
- This chart shows you how many Redis responses servers in the group sent and how many
of those responses contained errors.
Metric Description Responses The number of responses that the device sent when acting as an Redis server. Errors The number of errors that the device received when acting as a Redis server.
Redis Details for Group
The following charts are available in this region:
- Top Group Members (Redis Servers)
- This chart shows which Redis servers in the group were most active by breaking out the total number of Redis responses the group sent by server.
- Top Methods
- This chart shows which Redis methods were called on servers in the group the most by breaking out the total number of requests the group received by method.
- Top Errors
- This chart shows which Redis errors the groups returned the most by breaking out the total number of responses the group sent by error.
Redis Metrics for Group
The following charts are available in this region:
- Total Requests and Responses
-
Requests
and responses represent the conversation taking place between clients and servers. If there
are more requests than responses, clients might be sending more requests than the servers
can handle or the network might be too slow.
Note: It is unlikely that the total number of requests and responses will be exactly equal, even in a healthy environment. For example, you might be viewing a time period that captures a response to a request that was sent before the start of the time period. In general, the greater the difference between responses and errors, the greater the chance that there is an issue with those transactions. Metric Description Requests The number of requests that the device received when acting as an Redis server. Responses The number of responses that the device sent when acting as an Redis server. Aborted Requests The number of requests that were not completely transmitted because the connection timed out or the connection was closed with a TCP reset (RST) or FIN. Aborted Responses The number of responses that were not completely transmitted because the connection timed out or the connection was closed with a TCP reset (RST) or FIN. Response Errors The number of Redis errors that were returned because of an unknown command or an operation was performed against the wrong data type. - Server Processing Time
-
The Server Processing Time chart shows the median amount of
time the servers took to process requests from clients, measured in milliseconds. High
server processing times indicate that the servers in a group are slow.
Metric Description Server Processing Time The number of responses that the device sent when acting as an Redis server.
RFB
The ExtraHop system collects metrics about remote framebuffer (RFB) activity. RFB is a protocol for remote access to a graphical user interface that allows a client to view and control a system on another computer.
RFB client page
This page displays metric charts of RFB traffic associated with a device on your network.
- Learn about charts on this page:
- Learn about working with metrics.
RFB Summary
The following charts are available in this region:
- Sessions
- This chart displays when RFB sessions occurred on the client, including sessions with
unknown authorization and sessions with errors.
Metric Description Sessions The number of sessions with successful authentication that this RFB client participated in. Opens The number of times this RFB client attempted to open a session. Unknown Authentication The number of sessions with an unknown authorization status that were opened by this RFB client. The ExtraHop system did not recognize the authorization type when the session was opened. Errors The number of errors that prevented this RFB client from opening a session with successful authentication. - Total Sessions
- This chart displays the total number of RFB sessions on the client, including sessions
with unknown authorization and sessions with errors.
Metric Description Sessions The number of sessions with successful authentication that this RFB client participated in. Opens The number of times this RFB client attempted to open a session. Unknown Authentication The number of sessions with an unknown authorization status that were opened by this RFB client. The ExtraHop system did not recognize the authorization type when the session was opened. Errors The number of errors that prevented this RFB client from opening a session with successful authentication.
RFB Details
The following charts are available in this region:
- Top Errors
- This chart displays the top RFB error messages that occurred on the client.
Metric Description Errors The number of errors that prevented this RFB client from opening a session with successful authentication.
RFB Session Durations
The following charts are available in this region:
- Session Duration Distribution
- This chart displays the length of time an RFB session was open on the client, measured
in milliseconds. You can filter the duration by percentile or minimum - maximum
values.
Metric Description Session Duration The time between when this RFB client opened and closed a session with successful authentication. - Session Duration
- This chart displays the median duration time for RFB sessions on the client.
Metric Description Session Duration The time between when this RFB client opened and closed a session with successful authentication.
RFB Metric Totals
The following charts are available in this region:
- Total Sessions
- This chart displays the total number of RFB sessions on the client, including sessions
with unknown authorization and sessions with errors.
Metric Description Sessions The number of sessions with successful authentication that this RFB client participated in. Opens The number of times this RFB client attempted to open a session. Unknown Authentication The number of sessions with an unknown authorization status that were opened by this RFB client. The ExtraHop system did not recognize the authorization type when the session was opened. Errors The number of errors that prevented this RFB client from opening a session with successful authentication.
RFB server page
This page displays metric charts of RFB traffic associated with a device on your network.
- Learn about charts on this page:
- Learn about working with metrics.
RFB Summary
The following charts are available in this region:
- Sessions
- This chart displays when RFB sessions occurred on the server, including sessions with
unknown authorization and sessions with errors.
Metric Description Sessions The number of sessions with successful authentication that this RFB server participated in. Opens The number of times this RFB server attempted to open a session. Unknown Authentication The number of sessions with an unknown authorization status that were opened by this RFB server. The ExtraHop system did not recognize the authorization type when the session was opened. Errors The number of errors that prevented this RFB server from opening a session with successful authentication. - Total Sessions
- This chart displays the total number of RFB sessions on the server, including sessions
with unknown authorization and sessions with errors.
Metric Description Sessions The number of sessions with successful authentication that this RFB server participated in. Opens The number of times this RFB server attempted to open a session. Unknown Authentication The number of sessions with an unknown authorization status that were opened by this RFB server. The ExtraHop system did not recognize the authorization type when the session was opened. Errors The number of errors that prevented this RFB server from opening a session with successful authentication.
RFB Details
The following charts are available in this region:
- Top Errors
- This chart displays the top RFB error messages that occurred on the server.
Metric Description Errors The number of errors that prevented this RFB server from opening a session with successful authentication.
RFB Session Durations
The following charts are available in this region:
- Session Duration Distribution
- This chart displays the length of time an RFB session was open on the server, measured
in milliseconds. You can filter the duration by percentile or minimum - maximum
values.
Metric Description Session Duration The time between when this RFB server opened and closed a session with successful authentication. - Session Duration
- This chart displays the median duration time for RFB sessions on the server, measured
in milliseconds.
Metric Description Session Duration The time between when this RFB server opened and closed a session with successful authentication.
RFB Metric Totals
The following charts are available in this region:
- Total Sessions
- This chart displays the total number of RFB sessions on the server, including sessions
with unknown authorization and sessions with errors.
Metric Description Sessions The number of sessions with successful authentication that this RFB server participated in. Opens The number of times this RFB server attempted to open a session. Unknown Authentication The number of sessions with an unknown authorization status that were opened by this RFB server. The ExtraHop system did not recognize the authorization type when the session was opened. Errors The number of errors that prevented this RFB server from opening a session with successful authentication.
RFB client group page
This page displays metric charts of RFB traffic associated with a device group on your network.
- Learn about charts on this page:
- Learn about working with metrics.
RFB Summary for Group
The following charts are available in this region:
- Sessions
- This chart displays when RFB sessions occurred on clients in the group, including
sessions with unknown authorization and sessions with errors.
Metric Description Sessions The number of sessions with successful authentication that this RFB client participated in. Opens The number of times this RFB client attempted to open a session. Unknown Authentication The number of sessions with an unknown authorization status that were opened by this RFB client. The ExtraHop system did not recognize the authorization type when the session was opened. Errors The number of errors that prevented this RFB client from opening a session with successful authentication. - Total Sessions
- This chart displays the total number of RFB sessions on clients in the group,
including sessions with unknown authorization and sessions with errors.
Metric Description Sessions The number of sessions with successful authentication that this RFB client participated in. Opens The number of times this RFB client attempted to open a session. Unknown Authentication The number of sessions with an unknown authorization status that were opened by this RFB client. The ExtraHop system did not recognize the authorization type when the session was opened. Errors The number of errors that prevented this RFB client from opening a session with successful authentication.
RFB Details for Group
The following charts are available in this region:
- Top Group Members (RFB Clients)
- This chart displays the clients in the group that completed the most RFB
sessions.
Metric Description Sessions The number of sessions with successful authentication that this RFB client participated in.
RFB Metrics for Group
The following charts are available in this region:
- Total Sessions
- This chart displays the total number of RFB sessions on clients in the group,
including sessions with unknown authorization and sessions with errors.
Metric Description Sessions The number of sessions with successful authentication that this RFB client participated in. Opens The number of times this RFB client attempted to open a session. Unknown Authentication The number of sessions with an unknown authorization status that were opened by this RFB client. The ExtraHop system did not recognize the authorization type when the session was opened. Errors The number of errors that prevented this RFB client from opening a session with successful authentication.
RFB server group page
This page displays metric charts of RFB traffic associated with a device group on your network.
- Learn about charts on this page:
- Learn about working with metrics.
RFB Summary for Group
The following charts are available in this region:
- Sessions
- This chart displays when RFB sessions occurred on servers in the group, including
sessions with unknown authorization and sessions with errors.
Metric Description Sessions The number of sessions with successful authentication that this RFB server participated in. Opens The number of times this RFB server attempted to open a session. Unknown Authentication The number of sessions with an unknown authorization status that were opened by this RFB server. The ExtraHop system did not recognize the authorization type when the session was opened. Errors The number of errors that prevented this RFB server from opening a session with successful authentication. - Total Sessions
- This chart displays the total number of RFB sessions on servers in the group,
including sessions with unknown authorization and sessions with errors.
Metric Description Sessions The number of sessions with successful authentication that this RFB server participated in. Opens The number of times this RFB server attempted to open a session. Unknown Authentication The number of sessions with an unknown authorization status that were opened by this RFB server. The ExtraHop system did not recognize the authorization type when the session was opened. Errors The number of errors that prevented this RFB server from opening a session with successful authentication.
RFB Details for Group
The following charts are available in this region:
- Top Group Members (RFB Clients)
- This chart displays the servers in the group that completed the most RFB
sessions.
Metric Description Sessions The number of sessions with successful authentication that this RFB server participated in.
RFB Metrics for Group
The following charts are available in this region:
- Total Sessions
- This chart displays the total number of RFB sessions on servers in the group,
including sessions with unknown authorization and sessions with errors.
Metric Description Sessions The number of sessions with successful authentication that this RFB server participated in. Opens The number of times this RFB server attempted to open a session. Unknown Authentication The number of sessions with an unknown authorization status that were opened by this RFB server. The ExtraHop system did not recognize the authorization type when the session was opened. Errors The number of errors that prevented this RFB server from opening a session with successful authentication.
RTCP
The ExtraHop system collects metrics about Real-Time Transport Control Protocol (RTCP) activity. RTCP is a protocol that monitors statistics for streaming audio and video data transferred by the RTP protocol
RTCP application page
This page displays metric charts of RTCP traffic associated with an application container on your network.
- Learn about charts on this page:
- Learn about working with metrics.
RTCP Summary
The following charts are available in this region:
- Total Sender Messages
-
Metric Description Sender Messages The number of packets transmitted by the sender from the beginning of the transmission to the time this sender report packet was generated. Sender Drops The number of packets that were lost by the sender since the beginning of reception. Drops can be caused by network congestion or transmission timeouts. - Total Receiver Messages
-
Metric Description Receiver Messages The number of packets transmitted by the receiver from the beginning of the transmission to the time this receiver report packet was generated. Receiver Drops The number of packets that were lost since the beginning of reception. Drops can be caused by network congestion or transmission timeouts. - Sender Messages
-
Metric Description Sender Messages The number of packets transmitted by the sender from the beginning of the transmission to the time this sender report packet was generated. Sender Drops The number of packets that were lost by the sender since the beginning of reception. Drops can be caused by network congestion or transmission timeouts. - Receiver Messages
-
Metric Description Receiver Messages The number of packets transmitted by the receiver from the beginning of the transmission to the time this receiver report packet was generated. Receiver Drops The number of packets that were lost since the beginning of reception. Drops can be caused by network congestion or transmission timeouts.
RTCP Jitter
The following charts are available in this region:
- Sender Jitter
-
Metric Description Sender Report Jitter An estimate of the statistical variance of the RTP packets' interarrival time, measured in timestamp units and expressed as an unsigned integer. - Receiver Jitter
-
Metric Description Receiver Report Jitter An estimate of the statistical variance of the RTCP packets' interarrival time, measured in timestamp units and expressed as an unsigned integer.
RTCP Message Types
The following charts are available in this region:
- Message Types
-
Metric Description Messages by Type The number of RTCP records broken down by message type.
RTCP Metric Totals
The following charts are available in this region:
- Total Messages
-
Metric Description Sender Report Messages The number of packets transmitted by the sender from the beginning of the transmission to the time this sender report packet was generated. Sender Report Drops The number of packets that were lost by the sender since the beginning of reception. Drops can be caused by network congestion or transmission timeouts. Receiver Report Messages The number of packets transmitted by the receiver from the beginning of the transmission to the time this receiver report packet was generated. Receiver Report Drops The number of packets that were lost since the beginning of reception. Drops can be caused by network congestion or transmission timeouts. - RTCP Network Metrics
-
Metric Description Bytes The number of goodput bytes associated with RTCP transmissions. L2 Bytes The number of L2 bytes associated with RTCP transmissions. Packets The number of packets associated with RTCP transmissions.
RTCP device page
This page displays metric charts of RTCP traffic associated with a device on your network.
- Learn about charts on this page:
- Learn about working with metrics.
RTCP Summary
The following charts are available in this region:
- Summary In
- This chart displays the total number of incoming sender and receiver messages.
Metric Description Sender Messages The number of incoming packets transmitted by the sender from the beginning of the transmission to the time this sender report packet was generated. Sender Drops The number of incoming packets that were lost by the sender since the beginning of reception. Receiver Messages The number of incoming packets transmitted by the receiver from the beginning of the transmission to the time this receiver report packet was generated. Receiver Drops The number of incoming packets that were lost by the receiver since the beginning of reception. - Summary Out
- This chart displays the total number of outgoing sender and receiver messages.
Metric Description Sender Messages The number of outgoing packets transmitted by the sender from the beginning of the transmission to the time this sender report packet was generated. Sender Drops The number of outgoing packets that were lost by the sender since the beginning of reception. Receiver Messages The number of outgoing packets transmitted by the receiver from the beginning of the transmission to the time this receiver report packet was generated. Receiver Drops The number of outgoing packets that were lost by the receiver since the beginning of reception. - Messages In
- This chart shows you when incoming sender and receiver messages were
transmitted.
Metric Description Sender Messages The number of incoming packets transmitted by the sender from the beginning of the transmission to the time this sender report packet was generated. Sender Drops The number of incoming packets that were lost by the sender since the beginning of reception. Receiver Messages The number of incoming packets transmitted by the receiver from the beginning of the transmission to the time this receiver report packet was generated. Receiver Drops The number of incoming packets that were lost by the receiver since the beginning of reception. - Messages Out
- This chart shows you when outgoing sender and receiver messages were
transmitted.
Metric Description Sender Messages The number of outgoing packets transmitted by the sender from the beginning of the transmission to the time this sender report packet was generated. Sender Drops The number of outgoing packets that were lost by the sender since the beginning of reception. Receiver Messages The number of outgoing packets transmitted by the receiver from the beginning of the transmission to the time this receiver report packet was generated. Receiver Drops The number of outgoing packets that were lost by the receiver since the beginning of reception.
RTCP Jitter
The following charts are available in this region:
- Jitter In
- Displays estimates of the statistical variance of the incoming packets' interarrival
time.
Metric Description Sender Report Jitter In An estimate of the statistical variance of the incoming packets' interarrival time, measured in timestamp units and expressed as an unsigned integer. Receiver Report Jitter In An estimate of the statistical variance of the incoming packets' interarrival time, measured in timestamp units and expressed as an unsigned integer. - Jitter Out
- Displays estimates of the statistical variance of the outgoing packets' interarrival
time.
Metric Description Sender Report Jitter Out An estimate of the statistical variance of the outgoing packets' interarrival time, measured in timestamp units and expressed as an unsigned integer. Receiver Report Jitter Out An estimate of the statistical variance of the outgoing packets' interarrival time, measured in timestamp units and expressed as an unsigned integer.
Message Types
The following charts are available in this region:
- Message Types In
- The top message types received by the device. The ExtraHop system calculates these
values by looking at the total number of RTCP messages received by the client and
breaking those messages out by type.
Metric Description Message Types In The number of RTCP records broken down by message type. - Message Types Out
- The top message types sent by the device. The ExtraHop system calculates these values by looking at the total number of RTCP messages sent by the client and breaking those messages out by type.
RTCP device group page
This page displays metric charts of RTCP traffic associated with a device group on your network.
- Learn about charts on this page:
- Learn about working with metrics.
RTCP Summary for Group
The following charts are available in this region:
- Summary In
- Displays the total number of incoming sender and receiver messages for the
group.
Metric Description Sender Messages The number of incoming packets transmitted by the sender from the beginning of the transmission to the time this sender report packet was generated. Sender Drops The number of incoming packets that were lost by the sender since the beginning of reception. Receiver Messages The number of incoming packets transmitted by the receiver from the beginning of the transmission to the time this receiver report packet was generated. Receiver Drops The number of incoming packets that were lost by the receiver since the beginning of reception. - Summary Out
- Displays the total number of outoing sender and receiver messages for the group.
Metric Description Sender Messages The number of outgoing packets transmitted by the sender from the beginning of the transmission to the time this sender report packet was generated. Sender Drops The number of outgoing packets that were lost by the sender since the beginning of reception. Receiver Messages The number of outgoing packets transmitted by the receiver from the beginning of the transmission to the time this receiver report packet was generated. Receiver Drops The number of outgoing packets that were lost by the receiver since the beginning of reception.
RTP
The ExtraHop system collects metrics about Real-Time Transport Protocol (RTP) activity. RTP is a protocol that defines the standardized packet format for the real-time transfer of streaming audio and video.
RTP application page
This page displays metric charts of RTP traffic associated with an application container on your network.
- Learn about charts on this page:
- Learn about working with metrics.
RTP Summary
The following charts are available in this region:
- Messages
-
Metric Description Messages The number of messages associated with RTP transmissions. Duplicates The number of duplicate messages associated with RTP transmissions. Out of Order Number of packets associated with RTP transmissions where the sequence number did not match the sequence number that the ExtraHop system was expecting. The reordering might have been introduced at the point of origin or an intermediary. This might result in decreased call quality. Drops The number of packets associated with RTP transmissions which were lost in transit. Drops can be caused by network congestion or transmission timeouts. - Total Messages
-
Metric Description Messages The number of messages associated with RTP transmissions. - Mean Opinion Score (MOS)
-
Metric Description Mean Opinion Score (MOS) The mean opinion score calculated for packets associated with RTP transmissions. The MOS is an estimation of RTP stream performance and VoIP call quality. MOS values range from 1-5, where 5 is the highest perceived call quality. The ExtraHop system calculates the MOS based on delay, loss, discard, jitter, and codec. The MOS is only calculated for the following codecs: ITU-T G.711 PCMU Audio, ITU-T G.711 PCMA Audio, ITU-T G.729 Audio, and GSM 6.10 Audio.
RTP Jitter
The following charts are available in this region:
- Jitter
-
Metric Description Jitter An estimate of the statistical variance of the RTP packets' interarrival time, measured in timestamp units and expressed as an unsigned integer.
RTP Codecs
The following charts are available in this region:
- Top Codecs
- This chart shows the number of messages send and received by the application, broken out by codec.
- Codecs with Most Drops
- This chart shows the number of packets associated with RTP transmissions which were lost in transit, broken out by codec.
- Codecs with Most Jitter
- This chart shows the codecs with the most statistical variance of RTP packets' interarrival time.
RTP Metric Totals
The following charts are available in this region:
- Total Messages
-
Metric Description Messages The number of messages associated with RTP transmissions. Duplicates The number of duplicate messages associated with RTP transmissions. Out of Order Number of packets associated with RTP transmissions where the sequence number did not match the sequence number that the ExtraHop system was expecting. The reordering might have been introduced at the point of origin or an intermediary. This might result in decreased call quality. Drops The number of packets associated with RTP transmissions which were lost in transit. Drops can be caused by network congestion or transmission timeouts. - RTP Network Metrics
-
Metric Description L2 Bytes The number of L2 bytes associated with RTP transmissions. Goodput Bytes The number of goodput bytes associated with RTP transmissions. Packets The number of packets associated with RTP transmissions.
RTP device page
This page displays metric charts of RTP traffic associated with a device on your network.
- Learn about charts on this page:
- Learn about working with metrics.
Region
The following charts are available in this region:
- Summary In
-
Metric Description Mean Opinion Score The mean opinion score (MOS) calculated for packets received by the RTP device. The MOS is an estimation of RTP stream performance and VoIP call quality. MOS values range from 1-5, where 5 is the highest perceived call quality. The ExtraHop system calculates the MOS based on delay, loss, discard, jitter, and codec. The MOS is only calculated for the following codecs: ITU-T G.711 PCMU Audio, ITU-T G.711 PCMA Audio, ITU-T G.729 Audio, and GSM 6.10 Audio. Messages The number of messages received by the RTP device. - Summary Out
-
Metric Description Mean Opinion Score The mean opinion score (MOS) calculated for packets sent by the RTP device. The MOS is an estimation of RTP stream performance and VoIP call quality. MOS values range from 1-5, where 5 is the highest perceived call quality. The ExtraHop system calculates the MOS based on delay, loss, discard, jitter, and codec. The MOS is only calculated for the following codecs: ITU-T G.711 PCMU Audio, ITU-T G.711 PCMA Audio, ITU-T G.729 Audio, and GSM 6.10 Audio. Messages The number of messages sent by the RTP device.
- MOS In
-
Metric Description Mean Opinion Score The mean opinion score (MOS) calculated for packets received by the RTP device. The MOS is an estimation of RTP stream performance and VoIP call quality. MOS values range from 1-5, where 5 is the highest perceived call quality. The ExtraHop system calculates the MOS based on delay, loss, discard, jitter, and codec. The MOS is only calculated for the following codecs: ITU-T G.711 PCMU Audio, ITU-T G.711 PCMA Audio, ITU-T G.729 Audio, and GSM 6.10 Audio. - MOS Out
-
Metric Description Mean Opinion Score The mean opinion score (MOS) calculated for packets sent by the RTP device. The MOS is an estimation of RTP stream performance and VoIP call quality. MOS values range from 1-5, where 5 is the highest perceived call quality. The ExtraHop system calculates the MOS based on delay, loss, discard, jitter, and codec. The MOS is only calculated for the following codecs: ITU-T G.711 PCMU Audio, ITU-T G.711 PCMA Audio, ITU-T G.729 Audio, and GSM 6.10 Audio. - Messages In
-
Metric Description Messages The number of messages received by the RTP device. Duplicates The number of duplicate messages received by the RTP device. Out of Order Number of packets received by the device where the RTP sequence number did not match the sequence number that the ExtraHop system was expecting. The reordering might have been introduced at the device itself or by an intermediate device. This might result in decreased call quality. Drops The number of packets lost in transit prior to receipt by the RTP device. - Messages Out
-
Metric Description Messages The number of messages sent by the RTP device. Duplicates The number of duplicate messages sent by the RTP device. Out of Order Number of packets sent by the device where the RTP sequence number did not match the sequence number that the ExtraHop system was expecting. The reordering might have been introduced at the device itself or by an intermediate device. This might result in decreased call quality. Drops The number of packets sent by the RTP device which were lost in transit.
Jitter
The following charts are available in this region:
- Jitter In
-
Metric Description Sender Report Jitter In An estimate of the statistical variance of the incoming packets' interarrival time, measured in timestamp units and expressed as an unsigned integer. Receiver Report Jitter In An estimate of the statistical variance of the incoming packets' interarrival time, measured in timestamp units and expressed as an unsigned integer. - Jitter Out
-
Metric Description Sender Report Jitter Out An estimate of the statistical variance of the outgoing packets' interarrival time, measured in timestamp units and expressed as an unsigned integer. Receiver Report Jitter Out An estimate of the statistical variance of the outgoing packets' interarrival time, measured in timestamp units and expressed as an unsigned integer.
RTP Metrics
The following charts are available in this region:
- RTP In
-
Metric Description Messages The number of messages received by the RTP device. Duplicates The number of duplicate messages received by the RTP device. Out of Order Number of packets received by the device where the RTP sequence number did not match the sequence number that the ExtraHop system was expecting. The reordering might have been introduced at the device itself or by an intermediate device. This might result in decreased call quality. Drops The number of packets lost in transit prior to receipt by the RTP device. - RTP Out
-
Metric Description Messages The number of messages sent by the RTP device. Duplicates The number of duplicate messages sent by the RTP device. Out of Order Number of packets sent by the device where the RTP sequence number did not match the sequence number that the ExtraHop system was expecting. The reordering might have been introduced at the device itself or by an intermediate device. This might result in decreased call quality. Drops The number of packets sent by the RTP device which were lost in transit.
RTP device groups page
This page displays metric charts of RTP traffic associated with a device group on your network.
- Learn about charts on this page:
- Learn about working with metrics.
RTP Summary for Group
The following charts are available in this region:
- Summary In
-
Metric Description Mean Opinion Score The mean opinion score (MOS) calculated for packets received by the RTP device. The MOS is an estimation of RTP stream performance and VoIP call quality. MOS values range from 1-5, where 5 is the highest perceived call quality. The ExtraHop system calculates the MOS based on delay, loss, discard, jitter, and codec. The MOS is only calculated for the following codecs: ITU-T G.711 PCMU Audio, ITU-T G.711 PCMA Audio, ITU-T G.729 Audio, and GSM 6.10 Audio. Messages The number of messages received by the RTP device. - Summary Out
-
Metric Description Mean Opinion Score The mean opinion score (MOS) calculated for packets sent by the RTP device. The MOS is an estimation of RTP stream performance and VoIP call quality. MOS values range from 1-5, where 5 is the highest perceived call quality. The ExtraHop system calculates the MOS based on delay, loss, discard, jitter, and codec. The MOS is only calculated for the following codecs: ITU-T G.711 PCMU Audio, ITU-T G.711 PCMA Audio, ITU-T G.729 Audio, and GSM 6.10 Audio. Messages The number of messages sent by the RTP device. - RTP In
-
Metric Description Messages The number of messages received by the RTP device. Duplicates The number of duplicate messages received by the RTP device. Out of Order Number of packets received by the device where the RTP sequence number did not match the sequence number that the ExtraHop system was expecting. The reordering might have been introduced at the device itself or by an intermediate device. This might result in decreased call quality. Drops The number of packets lost in transit prior to receipt by the RTP device. - RTP Out
-
Metric Description Messages The number of messages sent by the RTP device. Duplicates The number of duplicate messages sent by the RTP device. Out of Order Number of packets sent by the device where the RTP sequence number did not match the sequence number that the ExtraHop system was expecting. The reordering might have been introduced at the device itself or by an intermediate device. This might result in decreased call quality. Drops The number of packets sent by the RTP device which were lost in transit.
SCCP
The ExtraHop system collects metrics about Skinny Client Control Protocol (SCCP) activity. SCCP is an IP-based protocol for session signaling with Cisco Unified Communications Manager, and often deployed in voice over Internet Protocol (VoIP) environments.
SCCP application page
This page displays metric charts of SCCP traffic associated with an application container on your network.
- Learn about charts on this page:
- Learn about working with metrics.
SCCP Summary
The following charts are available in this region:
- Calls and Messages
- This chart displays when the total number of SCCP calls and messages associated with
the application occurred.
Metric Description Calls The number of SCCP calls for this application. Messages The number of messages associated with SCCP calls for this application. SCCP messages, which can include many message types, are exchanged between call managers and phones. - Total Calls and Messages
- This chart displays the total number of SCCP calls and messages associated with the
application.
Metric Description Calls The number of SCCP calls for this application. Messages The number of messages associated with SCCP calls for this application. SCCP messages, which can include many message types, are exchanged between call managers and phones. - Call Duration
- This chart displays the length of SCCP calls associated with the application, broken
out by percentile.
Metric Description Call Duration The length of calls associated with this SCCP application. This metric is calculated and reported by SCCP devices within this application. - Call Duration
- This chart displays the 95th percentile of SCCP call lengths.
Metric Description Call Duration The length of calls associated with this SCCP application. This metric is calculated and reported by SCCP devices within this application. - Round Trip Time
- This chart displays the length of round trip time associated with the application,
broken out by percentile.
Metric Description Round Trip Time Round trip time (RTT) is a measurement of total network latency. The ExtraHop system calculates RTT by measuring the time taken took to send an SCCP message and receive an immediate acknowledgment (ACK). - Round Trip Time
- This chart displays the 95th percentile of round trip time associated with the
application.
Metric Description Round Trip Time Round trip time (RTT) is a measurement of total network latency. The ExtraHop system calculates RTT by measuring the time taken took to send an SCCP message and receive an immediate acknowledgment (ACK).
SCCP Messages
The following charts are available in this region:
- Top Messages Type
- This chart displays the SCCP message types that were most associated with the
application.
Metric Description Messages The number of messages associated with SCCP calls for this application. SCCP messages, which can include many message types, are exchanged between call managers and phones. - Top Senders
- This chart displays the IP addresses associated with the application that sent the
most SCCP messages.
Metric Description Messages The number of messages associated with SCCP calls for this application. SCCP messages, which can include many message types, are exchanged between call managers and phones. - Top Receivers
- This chart displays the IP addresses associated with the application that received the
most SCCP messages.
Metric Description Messages The number of messages associated with SCCP calls for this application. SCCP messages, which can include many message types, are exchanged between call managers and phones.
SCCP Network Data
The following charts are available in this region:
- Host Stalls
-
This chart shows the number of zero windows that were
associated with an application. Devices control the amount of data they receive by
specifying the number of packets that can be sent to them over a given time period.
When a device is sent more data than it can process, the device advertises a zero
window to ask its peer device to stop sending packets completely until the device
catches up. If you see a large number of zero windows, a server or client might not be
not fast enough to support the amount of data being received.
Metric Description Zero Windows The number of Zero Windows for SCCP calls associated with this application. A device advertises a Zero Window when incoming data is arriving too quickly to be processed. - Total Host Stalls
-
This chart shows the median number of zero window
advertisements sent by devices.
Metric Description Zero Windows The number of Zero Windows for SCCP calls associated with this application. A device advertises a Zero Window when incoming data is arriving too quickly to be processed. - Network Stalls
-
This chart shows the number of retransmission
timeouts that occurred. Retransmission timeouts (RTOs) occur when a network drops too
many packets, usually due to packet collisions or buffer exhaustion. If a device sends
a request or response and does not receive confirmation within a specified amount of
time, the device retransmits the request. If too many retransmissions are
unacknowledged, an RTO occurs. If you see a large number of RTOs, the network might be
too slow to support the current level of activity.
Metric Definition RTO The number of retransmission timeouts (RTOs) for SCCP calls associated with this application. An RTO is a 1-5 second stall in the TCP connection flow due to excessive retransmissions. - Total Network Stalls
-
This chart shows the median number of
retransmission timeouts caused by congestion when clients and servers were sending
requests.
Metric Definition RTO The number of retransmission timeouts (RTOs) for SCCP calls associated with this application. An RTO is a 1-5 second stall in the TCP connection flow due to excessive retransmissions.
SCCP Metric Totals
The following charts are available in this region:
- Total Calls and Messages
- This chart displays the total number of SCCP calls and messages associated with the
application and the length of delay in receiving packets.
Metric Description Calls The number of SCCP calls for this application. Messages The number of messages associated with SCCP calls for this application. SCCP messages, which can include many message types, are exchanged between call managers and phones. Reported Jitter The length of delay in receiving call packets for this SCCP application due to jitter. (Jitter is a measurement of the variation in network latency over time.) This metric is calculated and reported by SCCP devices within this application. - SCCP Network Metrics
- This chart displays totals for network metrics associated with the application.
Metric Description Zero Windows The number of Zero Windows for SCCP calls associated with this application. A device advertises a Zero Window when incoming data is arriving too quickly to be processed. RTO The number of retransmission timeouts (RTOs) for SCCP calls associated with this application. An RTO is a 1-5 second stall in the TCP connection flow due to excessive retransmissions. Bytes The number of goodput bytes associated with SCCP calls for this application. Goodput refers to the throughput of the original data transferred and excludes other throughput such as protocol headers or retransmitted packets. L2 Bytes The number of L2 bytes associated with SCCP calls for this application. Packets The number of packets associated with SCCP calls for this application. Reported Packets Lost The number of packets lost during a call that are associated with this SCCP application. This metric is calculated and reported by SCCP devices within this application.
SCCP device page
This page displays metric charts of SCCP traffic associated with a device on your network.
- Learn about charts on this page:
- Learn about working with metrics.
SCCP Summary
The following charts are available in this region:
- Summary In
- This chart displays the total number of incoming SCCP calls and messages received by
the device.
Metric Description Device Calls In The number of incoming calls received by this SCCP device. Device Messages In The number of messages received by this SCCP device. SCCP messages, which can include many message types, are exchanged between call managers and phones. - Summary Out
- This chart displays the total number of outgoing SCCP calls and messages sent by the
device.
Metric Description Device Calls Out The number of outgoing calls sent by this SCCP device. Device Messages Out The number of messages sent by this SCCP device. SCCP messages, which can include many message types, are exchanged between call managers and phones. - Calls and Messages In
- This chart displays when the total number of incoming SCCP calls and messages were
received by the device.
Metric Description Device Calls In The number of incoming calls received by this SCCP device. Device Messages In The number of messages received by this SCCP device. SCCP messages, which can include many message types, are exchanged between call managers and phones. - Calls and Messages Out
- This chart displays when the total number of outgoing SCCP calls and messages were
sent by the device.
Metric Description Device Calls Out The number of outgoing calls sent by this SCCP device. Device Messages Out The number of messages sent by this SCCP device. SCCP messages, which can include many message types, are exchanged between call managers and phones.
SCCP Call Duration
The following charts are available in this region:
- Call Duration
- This chart displays the length of SCCP calls broken out by percentile.
Metric Description Device Call Duration The length of the call for this SCCP device. - Call Duration
- This chart displays the 95th percentile of SCCP call lengths.
Metric Description Device Call Duration The length of the call for this SCCP device.
SCCP Message Types
The following charts are available in this region:
- Top Messages In
- This chart displays which SCCP message types were received the most by the
device.
Metric Description Device Messages In The number of messages received by this SCCP device. SCCP messages, which can include many message types, are exchanged between call managers and phones. - Top Messages Out
- This chart displays which SCCP message types were sent the most by the device.
Metric Description Device Messages Out The number of messages sent by this SCCP device. SCCP messages, which can include many message types, are exchanged between call managers and phones.
SCCP Metric Totals
The following charts are available in this region:
- SCCP In
- This chart displays the total number of SCCP calls, messages, bytes, and packets
received by the device and the length of delay in receiving packets.
Metric Description Device Calls In The number of incoming calls received by this SCCP device. Device Messages In The number of messages received by this SCCP device. SCCP messages, which can include many message types, are exchanged between call managers and phones. Device Reported Jitter The length of delay in sending or receiving packets for this SCCP device due to jitter. (Jitter is a measurement of the variation in network latency during the time interval.) This metric is calculated and reported by the device. Device Reported Bytes In The number of goodput call bytes received by this SCCP device, as calculated and reported by the device. Goodput refers to the throughput of the original data transferred and excludes other throughput such as protocol headers or retransmitted packets. Device Reported Packets In The number of call packets received by this SCCP device, as calculated and reported by the device. - SCCP Out
- This chart displays the total number of SCCP calls, messages, bytes, and packets sent
by the device and the length of delay in sending packets.
Metric Description Device Calls Out The number of outgoing calls sent by this SCCP device. Device Messages Out The number of messages sent by this SCCP device. SCCP messages, which can include many message types, are exchanged between call managers and phones. Device Reported Jitter The length of delay in sending or receiving packets for this SCCP device due to jitter. (Jitter is a measurement of the variation in network latency during the time interval.) This metric is calculated and reported by the device. Device Reported Bytes Out The number of goodput call bytes sent by this SCCP device, as calculated and reported by the device. Goodput refers to the throughput of the original data transferred and excludes other throughput such as protocol headers or retransmitted packets. Device Reported Packets Out The number of call packets sent by this SCCP device, as calculated and reported by the device.
SCCP device group page
This page displays metric charts of SCCP traffic associated with a device group on your network.
- Learn about charts on this page:
- Learn about working with metrics.
SCCP Summary for Group
The following charts are available in this region:
- Summary In
- This chart displays the total number of incoming SCCP calls and messages received by
the devices in the group.
Metric Description Device Calls In The number of incoming calls received by this SCCP device. Device Messages In The number of messages received by this SCCP device. SCCP messages, which can include many message types, are exchanged between call managers and phones. - Summary Out
- This chart displays the total number of outgoing SCCP calls and messages sent by the
devices in the group.
Metric Description Device Calls Out The number of outgoing calls sent by this SCCP device. Device Messages Out The number of messages sent by this SCCP device. SCCP messages, which can include many message types, are exchanged between call managers and phones. - SCCP In
- This chart displays the total number of SCCP calls, messages, bytes, and packets
received by devices in the group and the length of delay in receiving packets.
Metric Description Device Calls In The number of incoming calls received by this SCCP device. Device Messages In The number of messages received by this SCCP device. SCCP messages, which can include many message types, are exchanged between call managers and phones. Device Reported Jitter The length of delay in sending or receiving packets for this SCCP device due to jitter. (Jitter is a measurement of the variation in network latency during the time interval.) This metric is calculated and reported by the device. Device Reported Bytes In The number of goodput call bytes received by this SCCP device, as calculated and reported by the device. Goodput refers to the throughput of the original data transferred and excludes other throughput such as protocol headers or retransmitted packets. Device Reported Packets In The number of call packets received by this SCCP device, as calculated and reported by the device. - SCCP Out
- This chart displays the total number of SCCP calls, messages, bytes, and packets sent
by devices in the group and the length of delay in sending packets.
Metric Description Device Calls Out The number of outgoing calls sent by this SCCP device. Device Messages Out The number of messages sent by this SCCP device. SCCP messages, which can include many message types, are exchanged between call managers and phones. Device Reported Jitter The length of delay in sending or receiving packets for this SCCP device due to jitter. (Jitter is a measurement of the variation in network latency during the time interval.) This metric is calculated and reported by the device. Device Reported Bytes Out The number of goodput call bytes sent by this SCCP device, as calculated and reported by the device. Goodput refers to the throughput of the original data transferred and excludes other throughput such as protocol headers or retransmitted packets. Device Reported Packets Out The number of call packets sent by this SCCP device, as calculated and reported by the device.
SCCP Devices in Group
The following charts are available in this region:
- Top Devices In
- This chart displays the devices in the group that received the most SCCP calls.
Metric Description Device Calls In The number of incoming calls received by this SCCP device. - Top Devices Out
- This chart displays the devices in the group that sent the most SCCP calls.
Metric Description Device Calls Out The number of outgoing calls sent by this SCCP device.
SIP
The ExtraHop system collects metrics about Session Initiation Protocol (SIP) activity. SIP is a signaling protocol that controls communication sessions, such as voice calls for IP-based telephony applications.
SIP application page
SIP Summary
- Transactions
- This chart shows you when SIP errors and responses were associated with the
application. This information can help you see how active the application was at the
time the errors occurred.
In a healthy environment, the number of requests and responses should be roughly equal. For more information, see Requests and Responses.
Metric Description Responses The number of SIP responses. Errors The number of SIP response errors. - Total Transactions
- This chart displays the total number of SIP responses that were associated with the
application and how many of those responses contained errors.
Metric Description Responses The number of SIP responses. Errors The number of SIP response errors. - Performance (95th Percentile)
-
This chart shows the 95th percentile of timing metrics,
measured in milliseconds. The transfer and processing time metrics show parts of a
complete transaction. The request transfer time shows how long clients took to transmit
requests onto the network; the server processing time shows how long the servers took to
process requests; and the response transfer time shows how long the servers took to
transmit responses onto the network.
Transfer and processing times are calculated by measuring the time between when the first and last packets of requests and responses are seen by the ExtraHop system, as shown in the following figure:
It can be difficult to tell whether an issue is caused by a network or a device from looking only at transfer and processing times, because these metrics alone provide an incomplete picture. Therefore the round trip time (RTT) metric is also included in this chart. RTT metrics are a good indicator of how your network is performing. If you see high transfer or processing times, but the RTT is low, the issue is probably at the device-level. However, if the RTT, processing, and transfer times are all high, network latency might be affecting the transfer and processing times, and the issue might be with the network.
The RTT metric can help identify the source of the problem because it only measures how long an immediate acknowledgment takes to be sent from the client or server; it does not wait until all packets are delivered.
The ExtraHop system calculates the RTT value by measuring the time between the first packet of a request and the acknowledgment from the server, as shown in the following figure:
The request transfer time might be high because the client took a long time to transmit the request (possibly because the request was very large); however, the transfer time could also be high because the request took a long time to travel on the network (possibly because of network congestion).
Learn more about how the ExtraHop system calculates round trip time on the ExtraHop blog.
Metric Description Request Transfer Time The time between the ExtraHop system detecting the first packet and last packet of SIP requests. A high number might indicate a large request or network delay. Processing Time The time between the ExtraHop system detecting the last packet of SIP requests and the first packet of their corresponding responses. Response Transfer Time The time between the ExtraHop system detecting the first packet and last packet of SIP responses. A high number might indicate a large response or network delay. Round Trip Time The time between when a SIP client or server sent a packet requiring immediate acknowledgment and when the acknowledgment was received. The Performance (95th percentile) chart shows the highest value for a time period while filtering outliers; the 95th percentile is the highest value that falls below 95% of the values for a sample period. By displaying the 95th value, rather than the true maximum, the chart gives you a more accurate view of the data:
- Performance (95th)
-
This chart shows the 95th percentile of timing
metrics, measured in milliseconds. If an application is acting slow, performance
summary metrics can help you figure out whether the network or servers are causing the
issue. These metrics show the 95th percentile of time that servers took to process
requests from clients versus the 95th percentile time that packets from those requests
(and their respective responses) took to be transmitted across the network. High
server processing times indicate that clients are contacting slow servers. High TCP
round trip times indicate that clients are communicating over slow networks.
Metric Description Processing Time The time between the ExtraHop system detecting the last packet of SIP requests and the first packet of their corresponding responses. Round Trip Time The time between when a SIP client or server sent a packet requiring immediate acknowledgment and when the acknowledgment was received.
SIP Details
- Top Methods
- This chart shows which SIP methods were associated with the application by breaking out the total number of SIP requests by method.
- Top Status Codes
- This chart shows which SIP status codes the server returned the most by breaking out the total number of responses the application sent by status code.
- Top URIs
- This chart shows which URIs the application accessed the most by breaking out the total number of responses the application received by URI.
SIP Performance
- Server Processing Time Distribution
-
This chart breaks out server processing times in a histogram to
show the most common processing times, measured in milliseconds.
Metric Description Server Processing Time The time between the ExtraHop system detecting the last packet of SIP requests and the first packet of their corresponding responses. - Server Processing Time
-
This chart shows the median processing time for the
application, measured in milliseconds.
Metric Description Server Processing Time The time between the ExtraHop system detecting the last packet of SIP requests and the first packet of their corresponding responses. - Round Trip Time Distribution
-
This chart breaks out round trip times in a histogram to show the
most common round trip times, measured in milliseconds.
Metric Description Round Trip Time The time between when a SIP client or server sent a packet requiring immediate acknowledgment and when the acknowledgment was received. - Round Trip Time
-
This chart shows the median round trip time for the application,
measured in milliseconds.
Metric Description Round Trip Time The time between when a SIP client or server sent a packet requiring immediate acknowledgment and when the acknowledgment was received.
Network Data
This region shows you TCP information that is related to the current protocol. In general, host stalls indicate that there is an issue with either a server or a client, and network stalls indicate that there is an issue with the network.
- Host Stalls
-
This chart shows the number of zero windows that were
associated with an application. Devices control the amount of data they receive by
specifying the number of packets that can be sent to them over a given time period.
When a device is sent more data than it can process, the device advertises a zero
window to ask its peer device to stop sending packets completely until the device
catches up. If you see a large number of zero windows, a server or client might not be
not fast enough to support the amount of data being received.
Metric Definition Request Zero Windows The number of zero window advertisements sent by POP3 clients. A device advertises a Zero Window when incoming data is arriving too quickly to be processed. A large number of incoming Zero Windows indicates that a peer device was too slow to process the amount of data received.
Response Zero Windows The number of zero window advertisements sent by servers while receiving POP3 requests. A device advertises a Zero Window when incoming data is arriving too quickly to be processed. A large number of outgoing Zero Windows indicates that a client was too slow to process the amount of data received.
- Total Host Stalls
- This chart shows the median number of zero window advertisements sent by devices.
- Network Stalls
-
This chart shows the number of retransmission
timeouts that occurred. Retransmission timeouts (RTOs) occur when a network drops too
many packets, usually due to packet collisions or buffer exhaustion. If a device sends
a request or response and does not receive confirmation within a specified amount of
time, the device retransmits the request. If too many retransmissions are
unacknowledged, an RTO occurs. If you see a large number of RTOs, the network might be
too slow to support the current level of activity.
Metric Definition RTOs In The number of retransmission timeouts caused by congestion when clients were sending POP3 requests. An RTO is a 1-5 second stall in the TCP connection flow due to excessive retransmissions. If you see a large number of incoming RTOs, a device did not send an acknowledgment to the server quickly enough, or the network might be too slow to support the current level of activity. Depending on the timeout value configured in the operating system, this delay can be anywhere from 1 to 8 seconds.
RTOs Out The number of retransmission timeouts caused by congestion when servers were sending POP3 responses. An RTO is a 1-5 second stall in the TCP connection flow due to excessive retransmissions. If you see a large number of outgoing RTOs, a device did not receive an acknowledgment from the server quickly enough, or the network might be too slow to support the current level of activity. Depending on the timeout value configured in the operating system, this delay can be anywhere from 1 to 8 seconds.
- Total Network Stalls
-
This chart shows the median number of
retransmission timeouts caused by congestion when clients and servers were sending
requests.
Metric Definition RTOs In The number of retransmission timeouts caused by congestion when clients were sending POP3 requests. An RTO is a 1-5 second stall in the TCP connection flow due to excessive retransmissions. If you see a large number of incoming RTOs, a device did not send an acknowledgment to the server quickly enough, or the network might be too slow to support the current level of activity. Depending on the timeout value configured in the operating system, this delay can be anywhere from 1 to 8 seconds.
RTOs Out The number of retransmission timeouts caused by congestion when servers were sending POP3 responses. An RTO is a 1-5 second stall in the TCP connection flow due to excessive retransmissions. If you see a large number of outgoing RTOs, a device did not receive an acknowledgment from the server quickly enough, or the network might be too slow to support the current level of activity. Depending on the timeout value configured in the operating system, this delay can be anywhere from 1 to 8 seconds.
SIP Metric Totals
- Total Requests and Responses
-
Requests and responses represent the conversation taking place between clients and servers. If there are more requests than responses, clients might be sending more requests than servers can handle or the network might be too slow. To identify whether the issue is with the network or a server, check RTOs and zero windows in the Network Data section.
Note: It is unlikely that the total number of SIP requests and responses will be exactly equal, even in a healthy environment. For example, you might be viewing a time period that captures a response to a request that was sent before the start of the time period. In general, the greater the difference between responses and errors, the greater the chance that there is an issue with those transactions. Metric Description Requests The number of SIP requests. Responses The number of SIP responses. Errors The number of SIP response errors. - SIP Network Metrics
-
Metric Description Request L2 Bytes The number of L2 bytes associated with SIP requests. Response L2 Bytes The number of L2 bytes associated with SIP responses. Request Goodput Bytes The number of goodput bytes associated with SIP requests. Goodput refers to the throughput of the original data transferred and excludes other throughput such as protocol headers or retransmitted packets. Response Goodput Bytes The number of goodput bytes associated with SIP responses.Goodput refers to the throughput of the original data transferred and excludes other throughput such as protocol headers or retransmitted packets. Request Packets The number of packets associated with SIP requests. Response Packets The number of packets associated with SIP responses.
Where to look next
Drill down on a metric: You can get more information about a metric by clicking the metric value or name and selecting an option from the Drill down by menu. For example, if you are looking at the total number of errors, click the number and select Servers to see which servers returned the errors.
Search the Metric Explorer: Built-in protocol pages include the most commonly referenced metrics for a protocol, but you can see additional metrics in the Metric Explorer. Click any chart title on a protocol page and select Create chart from.... When the Metric Explorer opens, click Add Metric in the left pane to display a drop-down menu of comprehensive metrics for the device. If you find an interesting metric, click Add to Dashboard to add the metric to a new or existing dashboard.
Create a custom metric: If you want to view a metric that is not included in the Metric Explorer, you can create a custom metric through a trigger. For more information, see the following resources:
SIP client page
This page displays metric charts of SIP traffic associated with a device on your network.
- Learn about charts on this page:
- Learn about working with metrics.
SIP Summary
The following charts are available in this region:
- Transactions
- This chart shows you when SIP errors occurred and how many responses the SIP client
received. This information can help you see how active the client was at the time it
received the errors.
In a healthy environment, the number of requests and responses should be roughly equal. For more information, see Requests and Responses.
Metric Description Responses The number of responses that the device sent when acting as a SIP client. Response Errors The number of responses received that have a SIP status code >= 500. - Total Transactions
- This chart displays the total number of SIP responses the client received and how many
of those responses contained errors.
Metric Description Responses The number of responses that the device sent when acting as a SIP client. Response Errors The number of responses received that have a SIP status code >= 500. - Server Processing Time
- This chart shows SIP server processing times broken out by percentile. Server
processing time shows how long servers took to process requests from the client,
measured in milliseconds. Server processing time is calculated by measuring the time
between when the last packet of a request and the first packet of a response is seen by
the ExtraHop system.
Metric Description Server Processing Time When the device is acting as an SMPP client (ESME), the time between the ExtraHop system detecting the last packet of the sent request and the first packet of the received response. - Server Processing Time (95th)
- Shows the 95th percentile for server processing time, measured in milliseconds.
Metric Description Server Processing Time When the device is acting as an SMPP client (ESME), the time between the ExtraHop system detecting the last packet of the sent request and the first packet of the received response. The Server Processing Time Summary chart focuses on the 95th percentile to show the highest value for a time period while filtering outliers; the 95th percentile is the highest value that falls below 95% of the values for a sample period. The following chart shows how displaying the 95th value, rather than the true maximum, can give a more accurate view of the data:
SIP Details
The following charts are available in this region:
- Top Methods
- This chart shows which SIP methods the client called the most by breaking out the total number of requests the client sent by method.
- Top Status Codes
- This chart shows which SIP status codes the client received the most by breaking out the number of responses returned to the client by status code.
- Top URIs
- This chart shows which URIs the client accessed the most by breaking out the total number of responses the client received by URI.
SIP Performance
The following charts are available in this region:
- Server Processing Time Distribution
-
This chart breaks out server processing times in a histogram to
show the most common processing times, measured in milliseconds.
Metric Description Server Processing Time When the device is acting as a SIP client, the time between the ExtraHop system detecting the last packet of the received request and first packet of the sent response. - Server Processing Time
-
This chart shows the median processing time for the client,
measured in milliseconds.
Metric Description Server Processing Time When the device is acting as a SIP client, the time between the ExtraHop system detecting the last packet of the received request and first packet of the sent response.
SIP Metric Totals
The following charts are available in this region:
- Total Requests and Responses
- Requests and responses represent the conversation taking place between clients and
servers. If there are more requests than responses, the client might be sending more
requests than the servers can handle or the network might be too slow.
Note: It is unlikely that the total number of SIP requests and responses will be exactly equal, even in a healthy environment. For example, you might be viewing a time period that captures a response to a request that was sent before the start of the time period. In general, the greater the difference between responses and errors, the greater the chance that there is an issue with those transactions. Metric Description Requests The number of requests that the device sent when acting as a SIP client. Responses The number of responses that the device sent when acting as a SIP client. Response Errors The number of responses received that have a SIP status code >= 500. - Request and Response Size
- This chart shows the average size of requests and responses.
Metric Description Request Size The distribution of sizes (in bytes) of requests that the device sent when acting as a SIP client. Size measurements include SIP payload, but not headers. Response Size The distribution of sizes (in bytes) of responses that the device sent when acting as a SIP client. Size measurements include SIP payload, but not headers.
SIP server page
This page displays metric charts of SIP traffic associated with a device on your network.
- Learn about charts on this page:
- Learn about working with metrics.
SIP Summary
The following charts are available in this region:
- Transactions
- This chart shows you when SIP errors occurred and how many SIP responses the server
sent. This information can help you see how active the server was at the time it
returned the errors.
In a healthy environment, the number of requests and responses should be roughly equal. For more information, see Requests and Responses.
Metric Description Responses The number of responses that the device sent when acting as a SIP server. Response Errors The number of responses sent that have a SIP status code >= 500. - Total Transactions
- This chart displays the total number of SIP responses the server sent and how many of
those responses contained errors.
Metric Description Responses The number of responses that the device sent when acting as a SIP server. Response Errors The number of responses sent that have a SIP status code >= 500. - Server Processing Times
- This chart shows SIP server processing times broken out by percentile. Server
processing time shows how long the server took to process requests from clients,
measured in milliseconds. Server processing time is calculated by measuring the time
between when the last packet of a request and the first packet of a response is seen by
the ExtraHop system.
Metric Description Server Processing Time When the device is acting as an SMPP server (SMSC), the time between the ExtraHop system detecting the last packet of the received request and first packet of the sent response. - Server Processing Time (95th)
- Shows the 95th percentile for server processing time, measured in milliseconds.
Metric Description Server Processing Time When the device is acting as an SMPP server (SMSC), the time between the ExtraHop system detecting the last packet of the received request and first packet of the sent response. The Server Processing Time Summary chart focuses on the 95th percentile to show the highest value for a time period while filtering outliers; the 95th percentile is the highest value that falls below 95% of the values for a sample period. The following chart shows how displaying the 95th value, rather than the true maximum, can give a more accurate view of the data:
SIP Details
The following charts are available in this region:
- Top Methods
- This chart shows which SIP methods were called on the server the most by breaking out the total number of requests the server received by method.
- Top Status Codes
- This chart shows which SIP status codes the server returned the most by breaking out the total number of responses the server sent by status code.
- Top URIs
- This chart shows which URIs on the server were accessed the most by breaking out the total number of responses the server sent by URI.
SIP Performance
The following charts are available in this region:
- Server Processing Time Distribution
-
This chart breaks out server processing times in a histogram to
show the most common processing times, measured in milliseconds.
Metric Description Server Processing Time When the device is acting as an SMPP server (SMSC), the time between the ExtraHop system detecting the last packet of the received request and first packet of the sent response. - Server Processing Time
-
This chart shows the median processing time for the server,
measured in milliseconds.
Metric Description Server Processing Time When the device is acting as an SMPP server (SMSC), the time between the ExtraHop system detecting the last packet of the received request and first packet of the sent response.
SIP Metric Totals
The following charts are available in this region:
- Total Requests and Responses
- Requests and responses represent the conversation taking place between clients and
servers. If there are more requests than responses, clients might be sending more
requests than the server can handle or the network might be too slow.
Note: It is unlikely that the total number of SIP requests and responses will be exactly equal, even in a healthy environment. For example, you might be viewing a time period that captures a response to a request that was sent before the start of the time period. In general, the greater the difference between responses and errors, the greater the chance that there is an issue with those transactions. Metric Description Requests The number of requests that the device sent when acting as a SIP server. Responses The number of responses that the device sent when acting as a SIP server. Response Errors The number of responses sent that have a SIP status code >= 500. - Request and Response Size
- This chart shows the average size of requests and responses.
Metric Description Request Size The distribution of sizes (in bytes) of requests that the device sent when acting as a SIP server. Size measurements include SIP payload, but not headers. Response Size The distribution of sizes (in bytes) of responses that the device sent when acting as a SIP server. Size measurements include SIP payload, but not headers.
SIP client group page
This page displays metric charts of SIP traffic associated with a device group on your network.
- Learn about charts on this page:
- Learn about working with metrics.
SIP Summary for Group
The following charts are available in this region:
- Transactions
- This chart shows you when SIP errors occurred and how many responses the SIP clients
received. This information can help you see how active the clients were at the time they
received the errors.
In a healthy environment, the number of requests and responses should be roughly equal. For more information, see the SIP Metrics for Group section.
Metric Description Responses The number of responses that the device sent when acting as a SIP client. Response Errors The number of responses received that have a SIP status code >= 500. - Total Transactions
- This chart shows you how many SIP responses the clients received and how many of those
responses contained errors.
Metric Description Responses The number of responses that the device sent when acting as a SIP client. Response Errors The number of responses received that have a SIP status code >= 500.
SIP Details for Group
The following charts are available in this region:
- Top Group Members (SIP Clients)
- This chart shows which SIP clients in the group were most active by breaking out the total number of SIP requests the group sent by client.
- Top Methods
- This chart shows which SIP methods the group called the most by breaking out the total number of requests the group sent by method.
- Top Status Codes
- This chart shows which SIP status codes the group received the most by breaking out the number of responses returned to the group by status code.
SIP Metrics for Group
The following charts are available in this region:
- Total Requests and Responses
-
Requests
and responses represent the conversation taking place between clients and servers. If there
are more requests than responses, the clients might be sending more requests than servers
can handle or the network might be too slow.
Note: It is unlikely that the total number of requests and responses will be exactly equal, even in a healthy environment. For example, you might be viewing a time period that captures a response to a request that was sent before the start of the time period. In general, the greater the difference between responses and errors, the greater the chance that there is an issue with those transactions. Metric Description Requests The number of requests that the device sent when acting as a SIP client. Responses The number of responses that the device sent when acting as a SIP client. Errors The number of responses received that have a SIP status code >= 500. - Server Processing Time
-
If a client group is acting slow, the server processing time
can help you figure out whether the issue is with the servers. The Server Processing Time
chart shows the median amount of time servers took to process requests from the clients,
measured in milliseconds. High server processing times indicate that the clients are
contacting slow servers.
Metric Description Server Processing Time When the device is acting as an SMPP client (ESME), the time between the ExtraHop system detecting the last packet of the sent request and the first packet of the received response.
SIP server group page
This page displays metric charts of SIP traffic associated with a device group on your network.
- Learn about charts on this page:
- Learn about working with metrics.
SIP Summary for Group
The following charts are available in this region:
- Transactions
- This chart shows you when SIP errors occurred and how many SIP responses the servers
sent. This information can help you see how active the servers were at the time they
returned the errors.
In a healthy environment, the number of requests and responses should be roughly equal. For more information, see the SIP Metrics for Group section.
Metric Description Responses The number of responses that the device sent when acting as a SIP server. Response Errors The number of responses sent that have a SIP status code >= 500. - Total Transactions
- This chart shows you how many SIP responses servers in the group sent and how many of
those responses contained errors.
Metric Description Responses The number of responses that the device sent when acting as a SIP server. Response Errors The number of responses sent that have a SIP status code >= 500.
SIP Details for Group
The following charts are available in this region:
- Top Group Members (SIP Servers)
- This chart shows which SIP servers in the group were most active by breaking out the total number of SIP responses the group sent by server.
- Top Methods
- This chart shows which SIP methods were called on servers in the group the most by breaking out the total number of requests the group received by method.
- Top Status Code
- This chart shows which SIP status codes the groups returned the most by breaking out the total number of responses the group sent by status code.
SIP Metrics for Group
The following charts are available in this region:
- Total Requests and Responses
-
Requests
and responses represent the conversation taking place between clients and servers. If there
are more requests than responses, clients might be sending more requests than the servers
can handle or the network might be too slow.
Note: It is unlikely that the total number of requests and responses will be exactly equal, even in a healthy environment. For example, you might be viewing a time period that captures a response to a request that was sent before the start of the time period. In general, the greater the difference between responses and errors, the greater the chance that there is an issue with those transactions. Metric Description Requests The number of requests that the device sent when acting as a SIP server. Responses The number of responses that the device sent when acting as a SIP server. Response Errors The number of responses sent that have a SIP status code >= 500. - Server Processing Time
-
The Server Processing Time chart shows the median amount of
time the servers took to process requests from clients, measured in milliseconds. High
server processing times indicate that the servers in a group are slow.
Metric Description Server Processing Time When the device is acting as an SMPP server (SMSC), the time between the ExtraHop system detecting the last packet of the received request and first packet of the sent response.
SMB
The ExtraHop system collects metrics about Server Message Block (SMB) activity. SMB is an application-level protocol that provides client access to files on a network attached storage (NAS) repository, typically in a Windows environment. The ExtraHop system supports SMB, SMB2 and SMB3.
| Important: | Access time is the time it takes for a SMB server to receive a requested
block. There is no access time for operations that do not access actual block data within a
file. Processing time is the time it takes for a SMB server to respond to the operation
requested by the client, such as a metadata retrieval request. There are no access times for SMB2_CREATE. SMB2_CREATE creates a file that is referenced in the response by an SMB2_FILEID. The referenced file blocks are then read from or written to the NAS-storage device. These file read and write operations are calculated as access times. |
Security considerations
- SMB authentication can be vulnerable to brute force, which is a method for guessing credentials by submitting numerous authentication requests with different username and password combinations.
- Deprecated SMB dialects, such asSMBv1, have known vulnerabilities. Well-known ransomware malware, such as WannaCry, exploited SMBv1 vulnerabilities.
- SMB can be vulnerable to ransomware malware, which performs thousands of reads and writes over SMB to encrypt files that are stored on file servers across the network.
- SMB is a remote service protocol that an attacker can leverage to interact with remote devices and laterally move across the network.
SMB client page
This page displays metric charts of SMB client traffic associated with a device on your network.
- Learn about charts on this page:
- Learn about SMB security considerations
- Learn about working with metrics.
SMB Summary
The following charts are available in this region:
- Transactions
- This chart shows you when SMB errors occurred and how many responses the SMB client
received. This information can help you see how active the client was at the time it
received the errors.
If you see a large number of errors, you can view details about each error, including the error code. However, if the number of errors is low, the issue might be more complex, and you should examine the ratio of requests to responses. In a healthy environment, the number of requests and responses should be roughly equal. For more information, see Requests and Responses.
Tip: To drill down by error code, click Errors and select Error from the menu. Metric Description Responses The number of responses received by this SMB client. Errors The number of responses received by this SMB client that have an SMB status code other than SUCCESS or that have a warning. A high number of SMB errors might indicate a corrupt profile. - Total Transactions
- This chart displays the total number of SMB responses the client received and how many
of those responses contained errors.
Metric Description Responses The number of responses received by this SMB client. Errors The number of responses received by this SMB client that have an SMB status code other than SUCCESS or that have a warning. A high number of SMB errors might indicate a corrupt profile. - Operations
- This chart shows you when the SMB client performed read, write, and file system
information request operations.
Metric Description Reads The number of read operation requests sent by this SMB client. Writes The number of write operation requests sent by this SMB client. Creates The number of create operation requests sent by this SMB client. Deletes The number of delete operation requests sent by this SMB client. - Total Operations
- This chart shows you how many read and write operations the SMB client
performed.
Metric Description Reads The number of read operation requests sent by this SMB client. Writes The number of write operation requests sent by this SMB client. Creates The number of create operation requests sent by this SMB client. Deletes The number of delete operation requests sent by this SMB client. - Performance (95th Percentile)
- This chart shows the 95th percentile of timing metrics, measured in milliseconds.. The
access time shows how long servers took to process read or write operations that
accessed block data within a file. Access times are calculated by measuring the time
between when the first and last packets of requests and responses are seen by the
ExtraHop system, as shown in the following figure:
It can be difficult to tell whether an issue is caused by a network or a device from looking only at the access time, because this metric alone provides an incomplete picture. Therefore the round trip time (RTT) metric is also included in this chart. RTT metrics are a good indicator of how your network is performing. If you see high access times, but the RTT is low, the issue is probably at the device-level. However, if the RTT and access times are both high, network latency might be affecting the transfer and access times, and the issue might be with the network.
RTT only measures how long an immediate acknowledgment takes to be sent; it does not wait until all packets are delivered. Therefore, RTT is a good indicator of how your network is performing. If you see high access times, but the TCP RTT is low, the issue is probably at the device-level. Check the network for latency issues if the TCP RTT and access times are all both.
The RTT metric can help identify the source of the problem because it only measures how long an immediate acknowledgment takes to be sent from the client or server; it does not wait until all packets are delivered.
The access time might be high because the server took a long time to transmit the response (possibly because the response was very large); however, the access time could also be high because the response took a long time to travel on the network (possibly because of network congestion).
Learn more about how the ExtraHop system calculates round trip time on the ExtraHop blog.
Metric Description Access Time The time between the ExtraHop system detecting the last packet of the request sent by this SMB client and first packet of the received response. Access time is measured only for the first READ or WRITE operation on every flow in order to minimize the influence of pre-fetching and caching on timing metrics. Round Trip Time The time between when an SMB client sent a packet that required an immediate acknowledgment and when the client received the acknowledgment. Round trip time (RTT) is a measurement of network latency. The Performance (95th percentile) chart shows the highest value for a time period while filtering outliers; the 95th percentile is the highest value that falls below 95% of the values for a sample period. By displaying the 95th value, rather than the true maximum, the chart gives you a more accurate view of the data:
- Performance (95th Percentile)
- This chart shows the 95th percentile of timing metrics, measured in milliseconds. If a
client is acting slow, performance summary metrics can help you figure out whether the
network or servers are causing the issue. The performance summary metrics show the
median amount of time servers took to process requests from the client versus the median
time that packets from those requests (and their respective responses) took to be
transmitted across the network. High server access times indicate that the client is
contacting slow servers. High TCP round trip times indicate that the client is
communicating over slow networks.
Metric Description Access Time The time between the ExtraHop system detecting the last packet of the request sent by this SMB client and first packet of the received response. Access time is measured only for the first READ or WRITE operation on every flow in order to minimize the influence of pre-fetching and caching on timing metrics. Round Trip Time The time between when an SMB client sent a packet that required an immediate acknowledgment and when the client received the acknowledgment. Round trip time (RTT) is a measurement of network latency.
SMB Details
The following charts are available in this region:
- Top Methods
- This chart shows which SMB methods the client called the most by breaking out the total number of requests the client sent by method.
- Versions
- This chart shows which SMB versions had the most responses received by the client by breaking out the total number of responses the client received, listed by version.
- Top Users
- This chart shows which users were most active on the client by breaking out the total number of SMB requests sent by the client by user.
- Top Files
- This chart shows which files the client accessed the most by breaking out the total number of responses the client received by file path.
SMB Performance
The following charts are available in this region:
- Access Time Distribution
- This chart breaks out access times in a histogram to show the most common access
times, measured in milliseconds..
Metric Description Access Time The time between the ExtraHop system detecting the last packet of the request sent by this SMB client and first packet of the received response. Access time is measured only for the first READ or WRITE operation on every flow in order to minimize the influence of pre-fetching and caching on timing metrics. - Access Time
- This chart shows the median access time for the client, measured in
milliseconds..
Metric Description Access Time The time between the ExtraHop system detecting the last packet of the request sent by this SMB client and first packet of the received response. Access time is measured only for the first READ or WRITE operation on every flow in order to minimize the influence of pre-fetching and caching on timing metrics.
Network Data
This region shows you TCP information that is related to the current protocol. In general, host stalls indicate that there is an issue with either the server or the client, and network stalls indicate that there is an issue with the network.
- Host Stalls
- This chart shows the number of zero windows that were advertised or received by the
device. Devices control the amount of data they receive by specifying the number of
packets that can be sent to them over a given time period. When a device is sent more
data than it can process, the device advertises a zero window to ask its peer device to
stop sending packets completely until the device catches up. If you see a large number
of zero windows, a server or client might not be not fast enough to support the amount
of data being received.
Metric Definition Zero Windows In The number of zero windows that were sent to the device to stop the flow of data over the connection. A device advertises a Zero Window when incoming data is arriving too quickly to be processed. A large number of zero windows in indicates that a peer device was too slow to process the amount of data received.
Zero Windows Out The number of zero windows that were sent from the device to stop the flow of data. A device advertises a Zero Window when incoming data is arriving too quickly to be processed. A large number of zero windows out indicates that the client was too slow to process the amount of data received.
- Network Stalls
-
This chart shows the number of retransmission timeouts that occurred. Retransmission timeouts (RTOs) occur when a network drops too many packets, usually due to packet collisions or buffer exhaustion. If a device sends a request or response and does not receive confirmation within a specified amount of time, the device retransmits the request. If too many retransmissions are unacknowledged, an RTO occurs. If you see a large number of RTOs, the network might be too slow to support the current level of activity.
Metric Definition RTOs In The number of retransmission timeouts (RTOs) caused by network congestion as peers were sending data to the current device. An RTO is a 1-5 second stall in the TCP connection flow due to excessive retransmissions. If you see a large number of RTOs in, the device did not send an acknowledgment to the server quickly enough, or the network might be too slow to support the current level of activity. Depending on the timeout value configured in the operating system, this delay can be anywhere from 1 to 8 seconds.
RTOs Out The number of retransmission timeouts (RTOs) caused by network congestion as the device was sending data to its peers. An RTO is a 1-5 second stall in the TCP connection flow due to excessive retransmissions. If you see a large number of RTOs out, the device did not receive an acknowledgment from the server quickly enough, or the network might be too slow to support the current level of activity. Depending on the timeout value configured in the operating system, this delay can be anywhere from 1 to 8 seconds.
SMB Metric Totals
The following charts are available in this region:
- Total Requests and Responses
- This chart shows you how many operations the SMB client performed.
Metric Description Requests The number of requests sent by this SMB client. Responses The number of responses received by this SMB client. File System Info Requests The number of file system metadata queries sent by this SMB client. Warnings The number of responses received by this SMB client with an SMB status code that indicates a warning, such as STATUS_BUFFER_TOO_SMALL and STATUS_NO_MORE_FILES. Creates The number of create operation requests sent by this SMB client. Errors The number of responses received by this SMB client that have an SMB status code other than SUCCESS or that have a warning. A high number of SMB errors might indicate a corrupt profile. Reads The number of read operation requests sent by this SMB client. Writes The number of write operation requests sent by this SMB client. Renames The number of rename operation requests sent by this SMB client Deletes The number of delete operation requests sent by this SMB client. Locks The number of lock operation requests produced by this SMB client. - Request and Response Size
- This chart shows the average size of requests and responses.
Metric Description Request Size The distribution of sizes (in bytes) of requests sent by this SMB client. Response Size The distribution of sizes (in bytes) of responses received when the device is acting as an SMB client.
SMB server page
This page displays metric charts of SMB server traffic associated with a device on your network.
- Learn about charts on this page:
- Learn about SMB security considerations
- Learn about working with metrics.
SMB Summary
The following charts are available in this region:
- Transactions
- This chart shows you when SMB errors occurred and how many SMB responses the server
sent. This information can help you see how active the server was at the time it
returned the errors.
If you see a large number of errors, you can view details about each error, including the error code. However, if the number of errors is low, the issue might be more complex, and you should examine the ratio of requests to responses. In a healthy environment, the number of requests and responses should be roughly equal. For more information, see Requests and Responses.
Tip: To drill down by error code, click Errors and select Error from the menu. Metric Description Responses The number of responses sent by this SMB server. Errors The number of responses sent by this SMB server that have an SMB status code other than SUCCESS or that have a warning. A high number of SMB errors might indicate a corrupt profile. - Total Transactions
-
This chart displays the total number of SMB responses the server sent and how many of those responses contained errors.
Metric Description Responses The number of responses sent by this SMB server. Errors The number of responses sent by this SMB server that have an SMB status code other than SUCCESS or that have a warning. A high number of SMB errors might indicate a corrupt profile. - Operations
- This chart shows you when the read, write, and file system information request
operations were performed on the server.
Metric Description Reads The number of read operation requests received by this SMB server. Writes The number of write operation requests received by this SMB server. Creates The number of create operation requests received by this SMB server. Deletes The number of delete operation requests sent by this SMB server. - Total Operations
- This chart shows you how many read and write operations were performed on the
server.
Metric Description Reads The number of read operation requests received by this SMB server. Writes The number of write operation requests received by this SMB server. Creates The number of create operation requests received by this SMB server. Deletes The number of delete operation requests sent by this SMB server. - Performance (95th Percentile)
- This chart shows the 95th percentile of timing metrics, measured in milliseconds. The
access time shows how long servers took to process read or write operations that
accessed block data within a file. Access times are calculated by measuring the time
between when the first and last packets of requests and responses are seen by the
ExtraHop system, as shown in the following figure:
It can be difficult to tell whether an issue is caused by a network or a device from looking only at the access time, because this metric alone provides an incomplete picture. Therefore the round trip time (RTT) metric is also included in this chart. RTT metrics are a good indicator of how your network is performing. If you see high access times, but the RTT is low, the issue is probably at the device-level. However, if the RTT and access times are both high, network latency might be affecting the transfer and access times, and the issue might be with the network.
RTT only measures how long an immediate acknowledgment takes to be sent; it does not wait until all packets are delivered. Therefore, RTT is a good indicator of how your network is performing. If you see high access times, but the TCP RTT is low, the issue is probably at the device-level. Check the network for latency issues if the TCP RTT and access times are all both.
The RTT metric can help identify the source of the problem because it only measures how long an immediate acknowledgment takes to be sent from the client or server; it does not wait until all packets are delivered.
The access time might be high because the server took a long time to transmit the response (possibly because the response was very large); however, the access time could also be high because the response took a long time to travel on the network (possibly because of network congestion).
Learn more about how the ExtraHop system calculates round trip time on the ExtraHop blog.
Metric Description Server Access Time The time between the ExtraHop system detecting the last packet of the received request by this SMB server and first packet of the response. Access time is measured only for the first READ or WRITE operation on every flow in order to minimize the influence of pre-fetching and caching on timing metrics. Server Round Trip Time The time between when an SMB server sent a packet that required an immediate acknowledgment and when the server received the acknowledgment. Round trip time (RTT) is a measurement of network latency. The Performance (95th percentile) chart shows the highest value for a time period while filtering outliers; the 95th percentile is the highest value that falls below 95% of the values for a sample period. By displaying the 95th value, rather than the true maximum, the chart gives you a more accurate view of the data:
- Performance (95th)
- This chart shows a summary of the 95th percentile of timing metrics, measured in
milliseconds. If a server is acting slow, performance summary metrics can help you
figure out whether the network or the server is causing the issue. The performance
summary metrics show the median amount of time the server took to process requests from
clients versus the median time that packets from those requests (and their respective
responses) took to be transmitted across the network. High server access times indicate
that the server is slow. High RTTs indicate that the server is communicating over slow
networks.
Metric Description SMB / CIFS Server Access Time The time between the ExtraHop system detecting the last packet of the received request by this SMB server and first packet of the response. Access time is measured only for the first READ or WRITE operation on every flow in order to minimize the influence of pre-fetching and caching on timing metrics. SMB / CIFS Server Round Trip Time The time between when an SMB server sent a packet that required an immediate acknowledgment and when the server received the acknowledgment. Round trip time (RTT) is a measurement of network latency.
SMB Details
The following charts are available in this region:
- Top Methods
- This chart shows which SMB methods were called on the server the most by breaking out the total number of requests the server received by method.
- Versions
- This chart shows which SMB versions had the most responses sent by the server by breaking out the total number of responses the server sent, listed by version.
- Top Users
- This chart shows which users were most active on the server by breaking out the total number of SMB requests sent to the server by user.
- Top Files
- This chart shows which files on the server were accessed the most by breaking out the total number of responses the server sent by file path.
SMB Performance
The following charts are available in this region:
- Access Time Distribution
- This chart breaks out access times in a histogram to show the most common access
times, measured in milliseconds..
Metric Description Access Time The time between the ExtraHop system detecting the last packet of the received request by this SMB server and first packet of the response. Access time is measured only for the first READ or WRITE operation on every flow in order to minimize the influence of pre-fetching and caching on timing metrics. - Access Time
- This chart shows the median access time for the client.
Metric Description Access Time The time between the ExtraHop system detecting the last packet of the received request by this SMB server and first packet of the response. Access time is measured only for the first READ or WRITE operation on every flow in order to minimize the influence of pre-fetching and caching on timing metrics.
Network Data
This region shows you TCP information that is related to the current protocol. In general, host stalls indicate that there is an issue with either the server or the client, and network stalls indicate that there is an issue with the network.
- Host Stalls
- This chart shows the number of zero windows that were advertised or received by the
device. Devices control the amount of data they receive by specifying the number of
packets that can be sent to them over a given time period. When a device is sent more
data than it can process, the device advertises a zero window to ask its peer device to
stop sending packets completely until the device catches up. If you see a large number
of zero windows, a server or client might not be not fast enough to support the amount
of data being received.
Metric Definition Zero Windows In The number of zero windows that were sent to the device to stop the flow of data over the connection. A device advertises a Zero Window when incoming data is arriving too quickly to be processed. A large number of zero windows in indicates that a peer device was too slow to process the amount of data received.
Zero Windows Out The number of zero windows that were sent from the device to stop the flow of data. A device advertises a Zero Window when incoming data is arriving too quickly to be processed. A large number of zero windows out indicates that the client was too slow to process the amount of data received.
- Network Stalls
-
This chart shows the number of retransmission timeouts that occurred. Retransmission timeouts (RTOs) occur when a network drops too many packets, usually due to packet collisions or buffer exhaustion. If a device sends a request or response and does not receive confirmation within a specified amount of time, the device retransmits the request. If too many retransmissions are unacknowledged, an RTO occurs. If you see a large number of RTOs, the network might be too slow to support the current level of activity.
Metric Definition RTOs In The number of retransmission timeouts (RTOs) caused by network congestion as peers were sending data to the current device. An RTO is a 1-5 second stall in the TCP connection flow due to excessive retransmissions. If you see a large number of RTOs in, the device did not send an acknowledgment to the server quickly enough, or the network might be too slow to support the current level of activity. Depending on the timeout value configured in the operating system, this delay can be anywhere from 1 to 8 seconds.
RTOs Out The number of retransmission timeouts (RTOs) caused by network congestion as the device was sending data to its peers. An RTO is a 1-5 second stall in the TCP connection flow due to excessive retransmissions. If you see a large number of RTOs out, the device did not receive an acknowledgment from the server quickly enough, or the network might be too slow to support the current level of activity. Depending on the timeout value configured in the operating system, this delay can be anywhere from 1 to 8 seconds.
SMB Metric Totals
The following charts are available in this region:
- Total Requests and Responses
- This chart shows you how many operations were performed on the SMB server.
Metric Description Requests The number of requests received by this SMB server. Responses The number of responses sent by this SMB server. File System Info Requests The number of file system metadata queries received by this SMB server. Warnings The number of responses sent by this SMB server with an SMB status code that indicates a warning, such as STATUS_BUFFER_TOO_SMALL and STATUS_NO_MORE_FILES. Creates The number of create operation requests received by this SMB server. Errors The number of responses sent by this SMB server that have an SMB status code other than SUCCESS or that have a warning. A high number of SMB errors might indicate a corrupt profile. Reads The number of read operation requests received by this SMB server. Writes The number of write operation requests received by this SMB server. Renames The number of rename operation requests received by this SMB server. Deletes The number of delete operation requests sent by this SMB server. Locks The number of lock operation requests received by this SMB server. - Request and Response Size
- This chart shows the average size of requests and responses.
Metric Description SMB / CIFS Server Request Size The distribution of sizes (in bytes) of requests received by this SMB server. SMB / CIFS Server Response Size The distribution of sizes (in bytes) of responses sent by this SMB server.
SMB client group page
This page displays metric charts of SMB client traffic associated with a device group on your network.
- Learn about charts on this page:
- Learn about SMB security considerations
- Learn about working with metrics.
SMB Summary for Group
The following charts are available in this region:
- Transactions
- This chart shows you when SMB errors occurred and how many responses the SMB clients
received. This information can help you see how active the clients were at the time they
received the errors.
In a healthy environment, the number of requests and responses should be roughly equal. For more information, see the Metrics for Group section below.
Metric Description Responses The number of responses received by this SMB client. Errors The number of responses received by this SMB client that have an SMB status code other than SUCCESS or that have a warning. A high number of SMB errors might indicate a corrupt profile. - Total Transactions
- This chart shows you how many SMB responses the clients received and how many of those
responses contained errors.
Metric Description Responses The number of responses received by this SMB client. Errors The number of responses received by this SMB client that have an SMB status code other than SUCCESS or that have a warning. A high number of SMB errors might indicate a corrupt profile.
SMB Details for Group
The following charts are available in this region:
- Top Group Members (SMB Clients)
- This chart shows which SMB clients in the group were most active by breaking out the total number of SMB requests the group sent by client.
- Top Methods
- This chart shows which SMB methods the group called the most by breaking out the total number of requests the group sent by method.
- Versions
- This chart shows which SMB versions had the most responses received by clients in the group by breaking out the total number of responses the group received, listed by version.
- Top Users
- This chart shows which SMB users were most active in the group by breaking out the total number of SMB / CIFS responses the group received by user.
SMB Metrics for Group
The following charts are available in this region:
- Total Requests and Responses
-
Requests
and responses represent the conversation taking place between clients and servers. If there
are more requests than responses, the clients might be sending more requests than servers
can handle or the network might be too slow.
Note: It is unlikely that the total number of requests and responses will be exactly equal, even in a healthy environment. For example, you might be viewing a time period that captures a response to a request that was sent before the start of the time period. In general, the greater the difference between responses and errors, the greater the chance that there is an issue with those transactions. Metric Description Requests The number of requests sent by this SMB client. Responses The number of responses received by this SMB client. File System Info Requests The number of file system metadata queries sent by this SMB client. Warnings The number of responses received by this SMB client with an SMB status code that indicates a warning, such as STATUS_BUFFER_TOO_SMALL and STATUS_NO_MORE_FILES. Creates The number of create operation requests sent by this SMB client. Errors The number of responses received by this SMB client that have an SMB status code other than SUCCESS or that have a warning. A high number of SMB errors might indicate a corrupt profile. Reads The number of read operation requests sent by this SMB client. Writes The number of write operation requests sent by this SMB client. Renames The number of rename operation requests sent by this SMB client Deletes The number of delete operation requests sent by this SMB client. Locks The number of lock operation requests produced by this SMB client. - Access Time
- If a client group is acting slow, the access time can help you figure out whether the
issue is with the servers. The Server Processing Time chart shows the median amount of
time servers took to process requests from the clients, measured in milliseconds. High
access times indicate that the clients are contacting slow servers.
Metric Description Server Access Time The time between the ExtraHop system detecting the last packet of the request sent by this SMB client and first packet of the received response. Access time is measured only for the first READ or WRITE operation on every flow in order to minimize the influence of pre-fetching and caching on timing metrics.
SMB server group page
This page displays metric charts of SMB server traffic associated with a device group on your network.
- Learn about charts on this page:
- Learn about SMB security considerations
- Learn about working with metrics.
SMB Summary for Group
The following charts are available in this region:
- Transactions
- This chart shows you when SMB errors occurred and how many SMB responses the servers
sent. This information can help you see how active the servers were at the time they
returned the errors.
In a healthy environment, the number of requests and responses should be roughly equal. For more information, see the Metrics for Group section below.
Metric Description Responses The number of responses sent by this SMB server. Errors The number of responses sent by this SMB server that have an SMB status code other than SUCCESS or that have a warning. A high number of SMB errors might indicate a corrupt profile. - Total Transactions
- This chart shows you how many SMB responses servers in the group sent and how many of
those responses contained errors.
Metric Description Responses The number of responses sent by this SMB server. Errors The number of responses sent by this SMB server that have an SMB status code other than SUCCESS or that have a warning. A high number of SMB errors might indicate a corrupt profile.
SMB Details for Group
The following charts are available in this region:
- Top Group Members (SMB Servers)
- This chart shows which SMB servers in the group were most active by breaking out the total number of CIFS responses the group sent by server.
- Top Methods
- This chart shows which SMB methods were called on servers in the group the most by breaking out the total number of requests the group received by method.
- Versions
- This chart shows which SMB versions had the most responses sent by servers in the group by breaking out the total number of responses the group sent, listed by version.
- Top Users
- This chart shows which SMB users were most active in the group by breaking out the total number of SMB responses the group sent by user.
SMB Metrics in Group
The following charts are available in this region:
- Total Requests and Responses
-
Requests
and responses represent the conversation taking place between clients and servers. If there
are more requests than responses, clients might be sending more requests than the servers
can handle or the network might be too slow.
Note: It is unlikely that the total number of requests and responses will be exactly equal, even in a healthy environment. For example, you might be viewing a time period that captures a response to a request that was sent before the start of the time period. In general, the greater the difference between responses and errors, the greater the chance that there is an issue with those transactions. Metric Description Requests The number of requests received by this SMB server. Responses The number of responses sent by this SMB server. File System Info Requests The number of file system metadata queries received by this SMB server. Warnings The number of responses sent by this SMB server with an SMB status code that indicates a warning, such as STATUS_BUFFER_TOO_SMALL and STATUS_NO_MORE_FILES. Creates The number of create operation requests received by this SMB server. Errors The number of responses sent by this SMB server that have an SMB status code other than SUCCESS or that have a warning. A high number of SMB errors might indicate a corrupt profile. Reads The number of read operation requests received by this SMB server. Writes The number of write operation requests received by this SMB server. Renames The number of rename operation requests received by this SMB server. Deletes The number of delete operation requests sent by this SMB server. Locks The number of lock operation requests received by this SMB server. - Access Time
- If a server group is acting slow, the Access Time chart can help you figure out
whether the issue is with the servers. The Access Time chart shows the median amount of
time the servers took to process requests from clients. measured in milliseconds. High
server access times indicate that the servers are slow.
Metric Description Server Access Time The time between the ExtraHop system detecting the last packet of the received request by this SMB server and first packet of the response. Access time is measured only for the first READ or WRITE operation on every flow in order to minimize the influence of pre-fetching and caching on timing metrics.
SMPP
The ExtraHop system collects metrics about Short Message Peer-to-Peer (SMPP) activity. SMPP is an application-level protocol that transfers Short Message Service (SMS) data between External Short Messaging Entities (ESME) and Short Message Service Centers (SMSC).
SMPP client page
This page displays metric charts of SMPP traffic associated with a device on your network.
- Learn about charts on this page:
- Learn about working with metrics.
SMPP Summary
The following charts are available in this region:
- Transactions
- This chart shows you when SMPP errors occurred and how many responses the SMPP client
received. This information can help you see how active the client was at the time it
received the errors.
If you see a large number of errors, you can view details about each error. However, if the number of errors is low, the issue might be more complex, and you should examine the ratio of requests to responses. In a healthy environment, the number of requests and responses should be roughly equal. For more information, see Requests and Responses.
Tip: To view each error that was returned to the client, click Errors and then select Error from the menu. Metric Description Responses The number of responses that the device received when acting as an SMPP client (ESME). Errors The number of errors that the device received when acting as an SMPP client. - Total Transactions
- This chart displays the total number of SMPP responses the client received and how
many of those responses contained errors.
Metric Description Responses The number of responses that the device received when acting as an SMPP client (ESME). Errors The number of errors that the device received when acting as an SMPP client. - Performance Summary (95th Percentile)
-
This chart shows the 95th percentile of timing metrics, measured in
milliseconds. The transfer and processing time metrics show parts of a complete
transaction. The request transfer time shows how long the client took to transmit requests
onto the network; the server processing time shows how long servers took to process the
requests; and the response transfer time shows how long servers took to transmit responses
onto the network.
Transfer and processing times are calculated by measuring the time between when the first and last packets of requests and responses are seen by the ExtraHop system, as shown in the following figure:
It can be difficult to tell whether an issue is caused by a network or a device from looking only at transfer and processing times, because these metrics alone provide an incomplete picture. Therefore the round trip time (RTT) metric is also included in this chart. RTT metrics are a good indicator of how your network is performing. If you see high transfer or processing times, but the RTT is low, the issue is probably at the device-level. However, if the RTT, processing, and transfer times are all high, network latency might be affecting the transfer and processing times, and the issue might be with the network.
The RTT metric can help identify the source of the problem because it only measures how long an immediate acknowledgment takes to be sent from the client or server; it does not wait until all packets are delivered.
The ExtraHop system calculates the RTT value by measuring the time between the first packet of a request and the acknowledgment from the server, as shown in the following figure:
The request transfer time might be high because the client took a long time to transmit the request (possibly because the request was very large); however, the transfer time could also be high because the request took a long time to travel on the network (possibly because of network congestion).
Learn more about how the ExtraHop system calculates round trip time on the ExtraHop blog.
Metric Description Request Transfer Time When the device is acting as an SMPP client (ESME), the time between the ExtraHop system detecting the first packet and last packet of sent requests. A high number might indicate a large request or network delay. Server Processing Time When the device is acting as an SMPP client (ESME), the time between the ExtraHop system detecting the last packet of the sent request and the first packet of the received response. Response Transfer Time When the device is acting as an SMPP client (ESME), the time between the ExtraHop system detecting the first packet and last packet of received responses. A high number might indicate a large response or network delay. TCP Round Trip Tim The time between when a SMPP client sent a packet that required an immediate acknowledgment and when the client received the acknowledgment. Round trip time (RTT) is a measurement of network latency. The Performance (95th percentile) chart shows the highest value for a time period while filtering outliers; the 95th percentile is the highest value that falls below 95% of the values for a sample period. By displaying the 95th value, rather than the true maximum, the chart gives you a more accurate view of the data:
- Performance (95th)
-
This chart shows the 95th percentile of timing
metrics, measured in milliseconds. If a client is acting slow, performance summary
metrics can help you figure out whether the network or servers are causing the issue.
These metrics show the 95th percentile amount of time that servers took to process
requests from the client versus the 95th percentile time that packets from those
requests (and their respective responses) took to be transmitted across the network.
High server processing times indicate that the client is contacting slow servers. High
TCP round trip times indicate that the client is communicating over slow
networks.
Metric Description Server Processing Time When the device is acting as an SMPP client (ESME), the time between the ExtraHop system detecting the last packet of the sent request and the first packet of the received response. Round Trip Time The time between when a SMPP client sent a packet that required an immediate acknowledgment and when the client received the acknowledgment. Round trip time (RTT) is a measurement of network latency.
SMPP Details
The following charts are available in this region:
- Top Status Codes
- This chart shows which SMPP status codes the client received the most by breaking out the number of responses returned to the client by status code.
- Top Commands
- This chart shows which commands the client ran the most by breaking out the total number of responses the client received by command.
SMPP Performance
The following charts are available in this region:
- Server Processing Time Distribution
-
This chart breaks out server processing times in a histogram to
show the most common processing times, measured in milliseconds.
Metric Description Server Processing Time When the device is acting as an SMPP client (ESME), the time between the ExtraHop system detecting the last packet of the sent request and the first packet of the received response. - Server Processing Time
-
This chart shows the median processing time for the client,
measured in milliseconds.
Metric Description Server Processing Time When the device is acting as an SMPP client (ESME), the time between the ExtraHop system detecting the last packet of the sent request and the first packet of the received response.
Network Data
This region shows you TCP information that is related to the current protocol. In general, host stalls indicate that there is an issue with either the server or the client, and network stalls indicate that there is an issue with the network.
- Host Stalls
- This chart shows the number of zero windows that were advertised or received by the
device. Devices control the amount of data they receive by specifying the number of
packets that can be sent to them over a given time period. When a device is sent more
data than it can process, the device advertises a zero window to ask its peer device to
stop sending packets completely until the device catches up. If you see a large number
of zero windows, a server or client might not be not fast enough to support the amount
of data being received.
Metric Definition Zero Windows In The number of zero windows that were sent to the device to stop the flow of data over the connection. A device advertises a Zero Window when incoming data is arriving too quickly to be processed. A large number of zero windows in indicates that a peer device was too slow to process the amount of data received.
Zero Windows Out The number of zero windows that were sent from the device to stop the flow of data. A device advertises a Zero Window when incoming data is arriving too quickly to be processed. A large number of zero windows out indicates that the client was too slow to process the amount of data received.
- Network Stalls
-
This chart shows the number of retransmission timeouts that occurred. Retransmission timeouts (RTOs) occur when a network drops too many packets, usually due to packet collisions or buffer exhaustion. If a device sends a request or response and does not receive confirmation within a specified amount of time, the device retransmits the request. If too many retransmissions are unacknowledged, an RTO occurs. If you see a large number of RTOs, the network might be too slow to support the current level of activity.
Metric Definition RTOs In The number of retransmission timeouts (RTOs) caused by network congestion as peers were sending data to the current device. An RTO is a 1-5 second stall in the TCP connection flow due to excessive retransmissions. If you see a large number of RTOs in, the device did not send an acknowledgment to the server quickly enough, or the network might be too slow to support the current level of activity. Depending on the timeout value configured in the operating system, this delay can be anywhere from 1 to 8 seconds.
RTOs Out The number of retransmission timeouts (RTOs) caused by network congestion as the device was sending data to its peers. An RTO is a 1-5 second stall in the TCP connection flow due to excessive retransmissions. If you see a large number of RTOs out, the device did not receive an acknowledgment from the server quickly enough, or the network might be too slow to support the current level of activity. Depending on the timeout value configured in the operating system, this delay can be anywhere from 1 to 8 seconds.
SMPP Metric Totals
The following charts are available in this region:
- Total Requests and Responses
- Requests and responses represent the conversation taking place between clients and
servers. If there are more requests than responses, the client might be sending more
requests than the servers can handle or the network might be too slow. To identify
whether the issue is with the network or the server, check RTOs and zero windows in the
Network Data
section.
Note: It is unlikely that the total number of SMPP requests and responses will be exactly equal, even in a healthy environment. For example, you might be viewing a time period that captures a response to a request that was sent before the start of the time period. In general, the greater the difference between responses and errors, the greater the chance that there is an issue with those transactions. Metric Description Requests The number of requests that the device sent when acting as an SMPP client (ESME). Responses The number of responses that the device received when acting as an SMPP client (ESME). Errors The number of errors that the device received when acting as an SMPP client. - Request and Response Size
- This chart shows the average size of requests and responses.
Metric Description Request Size The distribution of sizes (in bytes) of requests that the device sent when acting as an SMPP client (ESME). Response Size The distribution of sizes (in bytes) of responses that the device received when acting as an SMPP client (ESME).
SMPP server page
This page displays metric charts of SMPP traffic associated with a device on your network.
- Learn about charts on this page:
- Learn about working with metrics.
SMPP Summary
The following charts are available in this region:
- Transactions
- This chart shows you when SMPP errors occurred and how many SMPP responses the server
sent. This information can help you see how active the server was at the time it
returned the errors.
If you see a large number of errors, you can view details about each error. However, if the number of errors is low, the issue might be more complex, and you should examine the ratio of requests to responses. In a healthy environment, the number of requests and responses should be roughly equal. For more information, see Requests and Responses.
Tip: To view each error that was returned by the server, click Errors and then select Error from the menu. Metric Description Responses The number of responses that the device sent when acting as an SMPP server (SMSC). Errors The number of errors that the device sent when acting as an SMPP server (SMSC). - Total Transactions
- This chart displays the total number of SMPP responses the server sent and how many of
those responses contained errors.
Metric Description Responses The number of responses that the device sent when acting as an SMPP server (SMSC). Errors The number of errors that the device sent when acting as an SMPP server (SMSC). - Performance Summary (95th Percentile)
-
This chart shows the 95th percentile of timing metrics, measured in
milliseconds. The transfer and processing time metrics show parts of a complete
transaction. The request transfer time shows how long clients took to transmit requests
onto the network; the server processing time shows how long the server took to process
requests; and the response transfer time shows how long the server took to transmit
responses onto the network.
Transfer and processing times are calculated by measuring the time between when the first and last packets of requests and responses are seen by the ExtraHop system, as shown in the following figure:
It can be difficult to tell whether an issue is caused by a network or a device from looking only at transfer and processing times, because these metrics alone provide an incomplete picture. Therefore the round trip time (RTT) metric is also included in this chart. RTT metrics are a good indicator of how your network is performing. If you see high transfer or processing times, but the RTT is low, the issue is probably at the device-level. However, if the RTT, processing, and transfer times are all high, network latency might be affecting the transfer and processing times, and the issue might be with the network.
The RTT metric can help identify the source of the problem because it only measures how long an immediate acknowledgment takes to be sent from the client or server; it does not wait until all packets are delivered.
The ExtraHop system calculates the RTT value by measuring the time between the first packet of a request and the acknowledgment from the server, as shown in the following figure:
The request transfer time might be high because the client took a long time to transmit the request (possibly because the request was very large); however, the transfer time could also be high because the request took a long time to travel on the network (possibly because of network congestion).
Learn more about how the ExtraHop system calculates round trip time on the ExtraHop blog.
Metric Description Request Transfer Time When the device is acting as an SMPP server (SMSC), the time between the ExtraHop system detecting the first packet and last packet of received requests. A high number might indicate a large request or network delay. Server Processing Time When the device is acting as an SMPP server (SMSC), the time between the ExtraHop system detecting the last packet of the received request and first packet of the sent response. Response Transfer Time When the device is acting as an SMPP server (SMSC), the time between the ExtraHop system detecting the first packet and last packet of sent responses. A high number might indicate a large response or network delay. TCP Round Trip Time The time between when a SMPP server sent a packet that required an immediate acknowledgment and when the server received the acknowledgment. Round trip time (RTT) is a measurement of network latency. The Performance (95th percentile) chart shows the highest value for a time period while filtering outliers; the 95th percentile is the highest value that falls below 95% of the values for a sample period. By displaying the 95th value, rather than the true maximum, the chart gives you a more accurate view of the data:
- Performance (95th)
-
This chart shows the 95th percentile of timing
metrics, measured in milliseconds. If a server is acting slow, performance summary
metrics can help you figure out whether the network or the server is causing the
issue. The performance summary metrics show the 95th percentile amount of time the
server took to process requests from clients versus the 95th percentile time that
packets from those requests (and their respective responses) took to be transmitted
across the network. High server processing times indicate that the server is slow.
High RTTs indicate that the server is communicating over slow networks.
Metric Description Server Processing Time When the device is acting as an SMPP server (SMSC), the time between the ExtraHop system detecting the last packet of the received request and first packet of the sent response. Round Trip Time The time between when a SMPP server sent a packet that required an immediate acknowledgment and when the server received the acknowledgment. Round trip time (RTT) is a measurement of network latency.
SMPP Details
The following charts are available in this region:
- Top Status Codes
- This chart shows which SMPP status codes the server returned the most by breaking out the total number of responses the server sent by status code.
- Top Commands
- This chart shows which commands were run on the server by breaking out the total number of responses the server sent by command.
SMPP Performance
The following charts are available in this region:
- Server Processing Time Distribution
-
This chart breaks out server processing times in a histogram to
show the most common processing times, measured in milliseconds.
Metric Description Server Processing Time When the device is acting as an SMPP server (SMSC), the time between the ExtraHop system detecting the last packet of the received request and first packet of the sent response. - Server Processing Time
-
This chart shows the median processing time for the server,
measured in milliseconds.
Metric Description Server Processing Time When the device is acting as an SMPP server (SMSC), the time between the ExtraHop system detecting the last packet of the received request and first packet of the sent response.
Network Data
This region shows you TCP information that is related to the current protocol. In general, host stalls indicate that there is an issue with either the server or the client, and network stalls indicate that there is an issue with the network.
- Host Stalls
- This chart shows the number of zero windows that were advertised or received by the
device. Devices control the amount of data they receive by specifying the number of
packets that can be sent to them over a given time period. When a device is sent more
data than it can process, the device advertises a zero window to ask its peer device to
stop sending packets completely until the device catches up. If you see a large number
of zero windows, a server or client might not be not fast enough to support the amount
of data being received.
Metric Definition Zero Windows In The number of zero windows that were sent to the device to stop the flow of data over the connection. A device advertises a Zero Window when incoming data is arriving too quickly to be processed. A large number of zero windows in indicates that a peer device was too slow to process the amount of data received.
Zero Windows Out The number of zero windows that were sent from the device to stop the flow of data. A device advertises a Zero Window when incoming data is arriving too quickly to be processed. A large number of zero windows out indicates that the client was too slow to process the amount of data received.
- Network Stalls
-
This chart shows the number of retransmission timeouts that occurred. Retransmission timeouts (RTOs) occur when a network drops too many packets, usually due to packet collisions or buffer exhaustion. If a device sends a request or response and does not receive confirmation within a specified amount of time, the device retransmits the request. If too many retransmissions are unacknowledged, an RTO occurs. If you see a large number of RTOs, the network might be too slow to support the current level of activity.
Metric Definition RTOs In The number of retransmission timeouts (RTOs) caused by network congestion as peers were sending data to the current device. An RTO is a 1-5 second stall in the TCP connection flow due to excessive retransmissions. If you see a large number of RTOs in, the device did not send an acknowledgment to the server quickly enough, or the network might be too slow to support the current level of activity. Depending on the timeout value configured in the operating system, this delay can be anywhere from 1 to 8 seconds.
RTOs Out The number of retransmission timeouts (RTOs) caused by network congestion as the device was sending data to its peers. An RTO is a 1-5 second stall in the TCP connection flow due to excessive retransmissions. If you see a large number of RTOs out, the device did not receive an acknowledgment from the server quickly enough, or the network might be too slow to support the current level of activity. Depending on the timeout value configured in the operating system, this delay can be anywhere from 1 to 8 seconds.
SMPP Metric Totals
The following charts are available in this region:
- Total Requests and Responses
- Requests and responses represent the conversation taking place between clients and
servers. If there are more requests than responses, clients might be sending more
requests than the server can handle or the network might be too slow. To identify
whether the issue is with the network or the server, check RTOs and zero windows in the
Network Data
section.
Note: It is unlikely that the total number of SMPP requests and responses will be exactly equal, even in a healthy environment. For example, you might be viewing a time period that captures a response to a request that was sent before the start of the time period. In general, the greater the difference between responses and errors, the greater the chance that there is an issue with those transactions. Metric Description Requests The number of requests that the device received when acting as an SMPP server (SMSC). Responses The number of responses that the device sent when acting as an SMPP server (SMSC). Errors The number of errors that the device sent when acting as an SMPP server (SMSC). - Request and Response Size
- This chart shows the average size of requests and responses.
Metric Description Request Size The distribution of sizes (in bytes) of requests that the device received when acting as an SMPP server (SMSC). Response Size The distribution of sizes (in bytes) of responses that the device sent when acting as an SMPP server (SMSC).
SMPP client group page
This page displays metric charts of SMPP traffic associated with a device group on your network.
- Learn about charts on this page:
- Learn about working with metrics.
SMPP Summary for Group
The following charts are available in this region:
- Transactions
- This chart shows you when SMPP errors occurred and how many responses the SMPP clients
received. This information can help you see how active the clients were at the time they
received the errors.
If you see a large number of errors, you can view details about each error. However, if the number of errors is low, the issue might be more complex, and you should examine the ratio of SMPP requests to SMPP responses. In a healthy environment, the number of requests and responses should be roughly equal. For more information, see the SMPP Metrics for Group chart.
Tip: To view each error that was returned to the client, click Errors and then select Error from the menu. Metric Description Responses The number of responses that the device received when acting as an SMPP client (ESME). Errors The number of errors that the device received when acting as an SMPP client. - Total Transactions
- This chart shows you how many SMPP responses the clients received and how many of
those responses contained errors.
Metric Description Responses The number of responses that the device received when acting as an SMPP client (ESME). Errors The number of errors that the device received when acting as an SMPP client.
SMPP Details for Group
The following charts are available in this region:
- Top Group Members (SMPP Clients)
- This chart shows which SMPP clients in the group were most active by breaking out the total number of SMPP requests the group sent by client.
- Top Status Codes
- This chart shows which SMPP status codes the group received the most by breaking out the number of responses returned to the group by status code.
- Top Commands
- This chart shows which commands the group ran the most by breaking out the total number of responses the group received by command.
SMPP Metrics for Group
The following charts are available in this region:
- Total Requests and Responses
-
Requests
and responses represent the conversation taking place between clients and servers. If there
are more requests than responses, the clients might be sending more requests than servers
can handle or the network might be too slow.
Note: It is unlikely that the total number of requests and responses will be exactly equal, even in a healthy environment. For example, you might be viewing a time period that captures a response to a request that was sent before the start of the time period. In general, the greater the difference between responses and errors, the greater the chance that there is an issue with those transactions. Metric Description Requests The number of requests that the device sent when acting as an SMPP client (ESME). Responses The number of responses that the device received when acting as an SMPP client (ESME). Errors The number of errors that the device received when acting as an SMPP client. - Server Processing Time
-
If a client group is acting slow, the server processing time
can help you figure out whether the issue is with the servers. The Server Processing Time
chart shows the median amount of time servers took to process requests from the clients,
measured in milliseconds. High server processing times indicate that the clients are
contacting slow servers.
Metric Description Server Processing Time When the device is acting as an SMPP client (ESME), the time between the ExtraHop system detecting the last packet of the sent request and the first packet of the received response.
SMPP server group page
This page displays metric charts of SMPP traffic associated with a device group on your network.
- Learn about charts on this page:
- Learn about working with metrics.
SMPP Summary for Group
The following charts are available in this region:
- Total Transactions
- This chart shows you when SMPP errors occurred and how many SMPP responses the servers
sent. This information can help you see how active the servers were at the time they
returned the errors.
If you see a large number of errors, you can view details about each error. However, if the number of errors is low, the issue might be more complex, and you should examine the ratio of SMPP requests to SMPP responses. In a healthy environment, the number of requests and responses should be roughly equal. For more information, see the SMPP Metrics for Group chart.
Tip: To view each error that was returned by the server, click Errors and then select Error from the menu. Metric Description Responses The number of responses that the device sent when acting as an SMPP server (SMSC). Errors The number of errors that the device sent when acting as an SMPP server (SMSC). - Total Transactions
- This chart shows you how many SMPP responses servers in the group sent and how many of
those responses contained errors.
Metric Description Responses The number of responses that the device sent when acting as an SMPP server (SMSC). Errors The number of errors that the device sent when acting as an SMPP server (SMSC).
SMPP Details for Group
The following charts are available in this region:
- Top Group Members (SMPP Servers)
- This chart shows which SMPP servers in the group were most active by breaking out the total number of SMPP responses the group sent by server.
- Top Status Code
- This chart shows which SMPP status codes the groups returned the most by breaking out the total number of responses the group sent by status code.
- Top Commands
- This chart shows which commands were run on servers in the group by breaking out the total number of responses the group sent by command.
SMPP Metrics for Group
The following charts are available in this region:
- Total Requests and Responses
-
Requests
and responses represent the conversation taking place between clients and servers. If there
are more requests than responses, clients might be sending more requests than the servers
can handle or the network might be too slow.
Note: It is unlikely that the total number of requests and responses will be exactly equal, even in a healthy environment. For example, you might be viewing a time period that captures a response to a request that was sent before the start of the time period. In general, the greater the difference between responses and errors, the greater the chance that there is an issue with those transactions. Metric Description Requests The number of requests that the device received when acting as an SMPP server (SMSC). Responses The number of responses that the device sent when acting as an SMPP server (SMSC). Errors The number of errors that the device sent when acting as an SMPP server (SMSC). - Server Processing Time
-
The Server Processing Time chart shows the median amount of
time the servers took to process requests from clients, measured in milliseconds. High
server processing times indicate that the servers in a group are slow.
Metric Description Server Processing Time When the device is acting as an SMPP server (SMSC), the time between the ExtraHop system detecting the last packet of the received request and first packet of the sent response.
SMTP
The ExtraHop system collects metrics about Simple Mail Transfer Protocol (SMTP) activity. SMTP is a standard protocol that sends, receives, and relays email messages between servers, email transfer agents, and client applications.
SMTP application page
This page displays metric charts of SMTP traffic associated with an application container on your network.
- Learn about charts on this page:
- Learn about working with metrics.
SMTP Summary
The following charts are available in this region:
- Transactions
- This chart shows you when SMTP errors and responses were associated with the
application. This information can help you see how active the application was at the
time the errors occurred.
In a healthy environment, the number of requests and responses should be roughly equal. For more information, see Requests and Responses.
Metric Description Responses The number of SMTP responses. Errors The number of SMTP response errors. - Total Transactions
- This chart displays the total number of SMTP responses that were associated with the
application and how many of those responses contained errors.
Metric Description Responses The number of SMTP responses. Errors The number of SMTP response errors. - Performance (95th Percentile)
-
This chart shows the 95th percentile of timing metrics,
measured in milliseconds. The transfer and processing time metrics show parts of a
complete transaction. The request transfer time shows how long clients took to transmit
requests onto the network; the server processing time shows how long the servers took to
process requests; and the response transfer time shows how long the servers took to
transmit responses onto the network.
Transfer and processing times are calculated by measuring the time between when the first and last packets of requests and responses are seen by the ExtraHop system, as shown in the following figure:
It can be difficult to tell whether an issue is caused by a network or a device from looking only at transfer and processing times, because these metrics alone provide an incomplete picture. Therefore the round trip time (RTT) metric is also included in this chart. RTT metrics are a good indicator of how your network is performing. If you see high transfer or processing times, but the RTT is low, the issue is probably at the device-level. However, if the RTT, processing, and transfer times are all high, network latency might be affecting the transfer and processing times, and the issue might be with the network.
The RTT metric can help identify the source of the problem because it only measures how long an immediate acknowledgment takes to be sent from the client or server; it does not wait until all packets are delivered.
The ExtraHop system calculates the RTT value by measuring the time between the first packet of a request and the acknowledgment from the server, as shown in the following figure:
The request transfer time might be high because the client took a long time to transmit the request (possibly because the request was very large); however, the transfer time could also be high because the request took a long time to travel on the network (possibly because of network congestion).
Learn more about how the ExtraHop system calculates round trip time on the ExtraHop blog.
Metric Description Request Transfer Time The time between the ExtraHop system detecting the first packet and last packet of SMTP requests. A high number might indicate a large request or network delay. Server Processing Time The time between the ExtraHop system detecting the last packet of SMTP requests and the first packet of their corresponding responses. Response Transfer Time The time between the ExtraHop system detecting the first packet and last packet of SMTP responses. A high number might indicate a large response or network delay. Round Trip Time The time between when an SMTP client or server sent a packet requiring immediate acknowledgment and when the acknowledgment was received. The Performance (95th percentile) chart shows the highest value for a time period while filtering outliers; the 95th percentile is the highest value that falls below 95% of the values for a sample period. By displaying the 95th value, rather than the true maximum, the chart gives you a more accurate view of the data:
- Performance (95th)
-
This chart shows the 95th percentile of timing
metrics, measured in milliseconds. If an application is acting slow, performance
summary metrics can help you figure out whether the network or servers are causing the
issue. These metrics show the 95th percentile of time that servers took to process
requests from clients versus the 95th percentile time that packets from those requests
(and their respective responses) took to be transmitted across the network. High
server processing times indicate that clients are contacting slow servers. High TCP
round trip times indicate that clients are communicating over slow networks.
Metric Description Server Processing Time The time between the ExtraHop system detecting the last packet of SMTP requests and the first packet of their corresponding responses. Round Trip Time The time between when an SMTP client or server sent a packet requiring immediate acknowledgment and when the acknowledgment was received.
SMTP Details
The following charts are available in this region:
- Top Methods
- This chart shows which SMTP methods were associated with the application by breaking out the total number of SMTP requests by method.
- Top Status Codes
- This chart shows which SMTP status codes the server returned the most by breaking out the total number of responses the application sent by status code.
- Top Errors
- This chart shows which SMTP errors were associated with the application the most by breaking out the number of responses by error.
SMTP Performance
The following charts are available in this region:
- Server Processing Time Distribution
-
This chart breaks out server processing times in a histogram to
show the most common processing times, measured in milliseconds.
Metric Description Server Processing Time The time between the ExtraHop system detecting the last packet of SMTP requests and the first packet of their corresponding responses. - Server Processing Time
-
This chart shows the median processing time for the
application, measured in milliseconds.
Metric Description Server Processing Time The time between the ExtraHop system detecting the last packet of SMTP requests and the first packet of their corresponding responses. - Round Trip Time Distribution
-
This chart breaks out round trip times in a histogram to show the
most common round trip times, measured in milliseconds.
Metric Description Round Trip Time The time between when an SMTP client or server sent a packet requiring immediate acknowledgment and when the acknowledgment was received. - Round Trip Time
-
This chart shows the median round trip time for the application,
measured in milliseconds.
Metric Description Round Trip Time The time between when an SMTP client or server sent a packet requiring immediate acknowledgment and when the acknowledgment was received.
Network Data
This region shows you TCP information that is related to the current protocol. In general, host stalls indicate that there is an issue with either a server or a client, and network stalls indicate that there is an issue with the network.
- Host Stalls
-
This chart shows the number of zero windows that were
associated with an application. Devices control the amount of data they receive by
specifying the number of packets that can be sent to them over a given time period.
When a device is sent more data than it can process, the device advertises a zero
window to ask its peer device to stop sending packets completely until the device
catches up. If you see a large number of zero windows, a server or client might not be
not fast enough to support the amount of data being received.
Metric Definition Request Zero Windows The number of zero window advertisements sent by SMTP clients. A device advertises a Zero Window when incoming data is arriving too quickly to be processed. A large number of incoming Zero Windows indicates that a peer device was too slow to process the amount of data received.
Response Zero Windows The number of zero window advertisements sent by servers while receiving SMTP requests. A device advertises a Zero Window when incoming data is arriving too quickly to be processed. A large number of outgoing Zero Windows indicates that a client was too slow to process the amount of data received.
- Total Host Stalls
- This chart shows the median number of zero window advertisements sent by devices.
- Network Stalls
-
This chart shows the number of retransmission
timeouts that occurred. Retransmission timeouts (RTOs) occur when a network drops too
many packets, usually due to packet collisions or buffer exhaustion. If a device sends
a request or response and does not receive confirmation within a specified amount of
time, the device retransmits the request. If too many retransmissions are
unacknowledged, an RTO occurs. If you see a large number of RTOs, the network might be
too slow to support the current level of activity.
Metric Definition RTOs In The number of retransmission timeouts caused by congestion when clients were sending SMTP requests. An RTO is a 1-5 second stall in the TCP connection flow due to excessive retransmissions. If you see a large number of incoming RTOs, a device did not send an acknowledgment to the server quickly enough, or the network might be too slow to support the current level of activity. Depending on the timeout value configured in the operating system, this delay can be anywhere from 1 to 8 seconds.
RTOs Out The number of retransmission timeouts caused by congestion when servers were sending SMTP responses. An RTO is a 1-5 second stall in the TCP connection flow due to excessive retransmissions. If you see a large number of outgoing RTOs, a device did not receive an acknowledgment from the server quickly enough, or the network might be too slow to support the current level of activity. Depending on the timeout value configured in the operating system, this delay can be anywhere from 1 to 8 seconds.
- Total Network Stalls
-
This chart shows the median number of
retransmission timeouts caused by congestion when clients and servers were sending
requests.
Metric Definition RTOs In The number of retransmission timeouts caused by congestion when clients were sending SMTP requests. An RTO is a 1-5 second stall in the TCP connection flow due to excessive retransmissions. If you see a large number of incoming RTOs, a device did not send an acknowledgment to the server quickly enough, or the network might be too slow to support the current level of activity. Depending on the timeout value configured in the operating system, this delay can be anywhere from 1 to 8 seconds.
RTOs Out The number of retransmission timeouts caused by congestion when servers were sending SMTP responses. An RTO is a 1-5 second stall in the TCP connection flow due to excessive retransmissions. If you see a large number of outgoing RTOs, a device did not receive an acknowledgment from the server quickly enough, or the network might be too slow to support the current level of activity. Depending on the timeout value configured in the operating system, this delay can be anywhere from 1 to 8 seconds.
SMTP Metric Totals
The following charts are available in this region:
- Total Requests and Responses
-
Requests and responses represent the conversation taking place between clients and servers. If there are more requests than responses, clients might be sending more requests than servers can handle or the network might be too slow. To identify whether the issue is with the network or a server, check RTOs and zero windows in the Network Data section.
Note: It is unlikely that the total number of SMTP requests and responses will be exactly equal, even in a healthy environment. For example, you might be viewing a time period that captures a response to a request that was sent before the start of the time period. In general, the greater the difference between responses and errors, the greater the chance that there is an issue with those transactions. Metric Description Requests The number of SMTP requests. Responses The number of SMTP responses. Response Errors The number of SMTP response errors. Sessions The number of SMTP sessions. Encrypted Sessions The number of encrypted SMTP sessions. - SMTP Network Metrics
-
Metric Description Request Zero Windows The number of zero window advertisements sent by SMTP clients. A device advertises a Zero Window when incoming data is arriving too quickly to be processed. Response Zero Windows The number of zero window advertisements sent by servers while receiving SMTP requests. A device advertises a Zero Window when incoming data is arriving too quickly to be processed. Request RTOs The number of retransmission timeouts caused by congestion when clients were sending SMTP requests. An RTO is a 1-5 second stall in the TCP connection flow due to excessive retransmissions. Response RTOs The number of retransmission timeouts caused by congestion when servers were sending SMTP responses. An RTO is a 1-5 second stall in the TCP connection flow due to excessive retransmissions. Request L2 Bytes The number of L2 bytes associated with SMTP requests. Response L2 Bytes The number of L2 bytes associated with SMTP responses. Request Goodput Bytes The number of goodput bytes associated with SMTP requests. Goodput refers to the throughput of the original data transferred and excludes other throughput such as protocol headers or retransmitted packets. Response Goodput Bytes The number of goodput bytes associated with SMTP responses. Goodput refers to the throughput of the original data transferred and excludes other throughput such as protocol headers or retransmitted packets. Request Packets The number of packets associated with SMTP requests. Response Packets The number of packets associated with SMTP responses.
SMTP client page
This page displays metric charts of SMTP traffic associated with a device on your network.
- Learn about charts on this page:
- Learn about working with metrics.
SMTP Summary
The following charts are available in this region:
- Transactions
- This chart shows you when SMTP errors occurred and how many responses the SMTP client
received. This information can help you see how active the client was at the time it
received the errors.
If you see a large number of errors, you can view details about each error. However, if the number of errors is low, the issue might be more complex, and you should examine the ratio of requests to responses. In a healthy environment, the number of requests and responses should be roughly equal. For more information, see Requests and Responses.
Tip: To view each error that was returned to the client, click Responses and then select Error from the menu. Metric Description Responses The number of responses that the device received when acting as an SMTP client. Errors When the device is acting as an SMTP client, the number of command responses received that have a reply code >= 400. - Total Transactions
- This chart displays the total number of SMTP responses the client received and how
many of those responses contained errors.
Metric Description Responses The number of responses that the device received when acting as an SMTP client. Sessions The number of sessions that the device participated in when acting as an SMTP client. Errors When the device is acting as an SMTP client, the number of command responses received that have a reply code >= 400. - Performance Summary (95th Percentile)
-
This chart shows the 95th percentile of timing metrics, measured in
milliseconds. The transfer and processing time metrics show parts of a complete
transaction. The request transfer time shows how long the client took to transmit requests
onto the network; the server processing time shows how long servers took to process the
requests; and the response transfer time shows how long servers took to transmit responses
onto the network.
Transfer and processing times are calculated by measuring the time between when the first and last packets of requests and responses are seen by the ExtraHop system, as shown in the following figure:
It can be difficult to tell whether an issue is caused by a network or a device from looking only at transfer and processing times, because these metrics alone provide an incomplete picture. Therefore the round trip time (RTT) metric is also included in this chart. RTT metrics are a good indicator of how your network is performing. If you see high transfer or processing times, but the RTT is low, the issue is probably at the device-level. However, if the RTT, processing, and transfer times are all high, network latency might be affecting the transfer and processing times, and the issue might be with the network.
The RTT metric can help identify the source of the problem because it only measures how long an immediate acknowledgment takes to be sent from the client or server; it does not wait until all packets are delivered.
The ExtraHop system calculates the RTT value by measuring the time between the first packet of a request and the acknowledgment from the server, as shown in the following figure:
The request transfer time might be high because the client took a long time to transmit the request (possibly because the request was very large); however, the transfer time could also be high because the request took a long time to travel on the network (possibly because of network congestion).
Learn more about how the ExtraHop system calculates round trip time on the ExtraHop blog.
Metric Description Request Transfer Time When the device is acting as an SMTP client, the time between the ExtraHop system detecting the first packet and last packet of sent requests. A high number might indicate a large request or network delay. Server Processing Time When the device is acting as an SMTP client, the time between the ExtraHop system detecting the last packet of the sent request and the first packet of the received response. Response Transfer Time When the device is acting as an SMTP client, the time between the ExtraHop system detecting the first packet and last packet of received responses. A high number might indicate a large response or network delay. Round Trip Time The time between when a SMTP client sent a packet that required an immediate acknowledgment and when the client received the acknowledgment. Round trip time (RTT) is a measurement of network latency. The Performance (95th percentile) chart shows the highest value for a time period while filtering outliers; the 95th percentile is the highest value that falls below 95% of the values for a sample period. By displaying the 95th value, rather than the true maximum, the chart gives you a more accurate view of the data:
- Performance (95th)
-
This chart shows the 95th percentile of timing
metrics, measured in milliseconds. If a client is acting slow, performance summary
metrics can help you figure out whether the network or servers are causing the issue.
These metrics show the 95th percentile amount of time that servers took to process
requests from the client versus the 95th percentile time that packets from those
requests (and their respective responses) took to be transmitted across the network.
High server processing times indicate that the client is contacting slow servers. High
TCP round trip times indicate that the client is communicating over slow
networks.
Metric Description Server Processing Time When the device is acting as an SMTP client, the time between the ExtraHop system detecting the last packet of the sent request and the first packet of the received response. Round Trip Time The time between when a SMTP client sent a packet that required an immediate acknowledgment and when the client received the acknowledgment. Round trip time (RTT) is a measurement of network latency.
SMTP Details
The following charts are available in this region:
- Top Methods
- This chart shows which SMTP methods the client called the most by breaking out the total number of requests the client sent by method.
- Top Errors
- This chart shows which SMTP errors the client received the most by breaking out the number of responses returned to the client by error.
SMTP Performance
The following charts are available in this region:
- Server Processing Time Distribution
-
This chart breaks out server processing times in a histogram to
show the most common processing times, measured in milliseconds.
Metric Description Server Processing Time When the device is acting as an SMTP client, the time between the ExtraHop system detecting the last packet of the sent request and the first packet of the received response. - Server Processing Time
-
This chart shows the median processing time for the client,
measured in milliseconds.
Metric Description Server Processing Time When the device is acting as an SMTP client, the time between the ExtraHop system detecting the last packet of the sent request and the first packet of the received response. - Round Trip Time Distribution
-
This chart breaks out round trip times in a histogram to show the
most common round trip times, measured in milliseconds.
Metric Description Round Trip Time The time between when a SMTP client sent a packet that required an immediate acknowledgment and when the client received the acknowledgment. Round trip time (RTT) is a measurement of network latency. - Round Trip Time
-
This chart shows the median round trip time for the client, measured in
milliseconds.
Metric Description Round Trip Time The time between when a SMTP client sent a packet that required an immediate acknowledgment and when the client received the acknowledgment. Round trip time (RTT) is a measurement of network latency.
Network Data
This region shows you TCP information that is related to the current protocol. In general, host stalls indicate that there is an issue with either the server or the client, and network stalls indicate that there is an issue with the network.
- Host Stalls
- This chart shows the number of zero windows that were advertised or received by the
device. Devices control the amount of data they receive by specifying the number of
packets that can be sent to them over a given time period. When a device is sent more
data than it can process, the device advertises a zero window to ask its peer device to
stop sending packets completely until the device catches up. If you see a large number
of zero windows, a server or client might not be not fast enough to support the amount
of data being received.
Metric Definition Zero Windows In The number of zero windows that were sent to the device to stop the flow of data over the connection. A device advertises a Zero Window when incoming data is arriving too quickly to be processed. A large number of zero windows in indicates that a peer device was too slow to process the amount of data received.
Zero Windows Out The number of zero windows that were sent from the device to stop the flow of data. A device advertises a Zero Window when incoming data is arriving too quickly to be processed. A large number of zero windows out indicates that the client was too slow to process the amount of data received.
- Network Stalls
-
This chart shows the number of retransmission timeouts that occurred. Retransmission timeouts (RTOs) occur when a network drops too many packets, usually due to packet collisions or buffer exhaustion. If a device sends a request or response and does not receive confirmation within a specified amount of time, the device retransmits the request. If too many retransmissions are unacknowledged, an RTO occurs. If you see a large number of RTOs, the network might be too slow to support the current level of activity.
Metric Definition RTOs In The number of retransmission timeouts (RTOs) caused by network congestion as peers were sending data to the current device. An RTO is a 1-5 second stall in the TCP connection flow due to excessive retransmissions. If you see a large number of RTOs in, the device did not send an acknowledgment to the server quickly enough, or the network might be too slow to support the current level of activity. Depending on the timeout value configured in the operating system, this delay can be anywhere from 1 to 8 seconds.
RTOs Out The number of retransmission timeouts (RTOs) caused by network congestion as the device was sending data to its peers. An RTO is a 1-5 second stall in the TCP connection flow due to excessive retransmissions. If you see a large number of RTOs out, the device did not receive an acknowledgment from the server quickly enough, or the network might be too slow to support the current level of activity. Depending on the timeout value configured in the operating system, this delay can be anywhere from 1 to 8 seconds.
SMTP Metric Totals
The following charts are available in this region:
- Total Requests and Responses
- Requests and responses represent the conversation taking place between clients and
servers. If there are more requests than responses, the client might be sending more
requests than the servers can handle or the network might be too slow. To identify
whether the issue is with the network or the server, check RTOs and zero windows in the
Network Data
section.
Note: It is unlikely that the total number of SMTP requests and responses will be exactly equal, even in a healthy environment. For example, you might be viewing a time period that captures a response to a request that was sent before the start of the time period. In general, the greater the difference between responses and errors, the greater the chance that there is an issue with those transactions. Metric Description Requests The number of requests that the device sent when acting as an SMTP client. Responses The number of responses that the device received when acting as an SMTP client. Aborted Requests The number of requests that this SMTP client began to send but did not send completely because the connection abruptly closed. Aborted Responses The number of requests that this SMTP client began to send but did not send completely because the connection abruptly closed. Sessions The number of sessions that the device participated in when acting as an SMTP client. Encrypted Sessions The number of encrypted sessions that the device participated in when acting as an SMTP client. Errors When the device is acting as an SMTP client, the number of command responses received that have a reply code >= 400. - Request and Response Size
- This chart shows the average size of requests and responses.
Metric Description Request Size The distribution of sizes (in bytes) of requests that the device sent when acting as an SMTP client. Response Size The distribution of sizes (in bytes) of responses that the device received when acting as an SMTP client.
SMTP server page
This page displays metric charts of SMTP traffic associated with a device on your network.
- Learn about charts on this page:
- Learn about working with metrics.
SMTP Summary
The following charts are available in this region:
- Transactions
- This chart shows you when SMTP errors occurred and how many SMTP responses the server
sent. This information can help you see how active the server was at the time it
returned the errors.
If you see a large number of errors, you can view details about each error. However, if the number of errors is low, the issue might be more complex, and you should examine the ratio of requests to responses. In a healthy environment, the number of requests and responses should be roughly equal. For more information, see Requests and Responses.
Tip: To view each error that was returned to the server, click Responses and then select Error from the menu. Metric Description Responses The number of responses that the device sent when acting as an SMTP server. Errors When the device is acting as an SMTP server, the number of command responses sent that have a reply code >= 400. - Total Transactions
- This chart displays the total number of SMTP responses the server sent and how many of
those responses contained errors.
Metric Description Responses The number of responses that the device sent when acting as an SMTP server. Sessions The number of sessions that the device participated in when acting as an SMTP server. Errors When the device is acting as an SMTP server, the number of command responses sent that have a reply code >= 400. - Performance Summary (95th Percentile)
-
This chart shows the 95th percentile of timing metrics, measured in
milliseconds. The transfer and processing time metrics show parts of a complete
transaction. The request transfer time shows how long clients took to transmit requests
onto the network; the server processing time shows how long the server took to process
requests; and the response transfer time shows how long the server took to transmit
responses onto the network.
Transfer and processing times are calculated by measuring the time between when the first and last packets of requests and responses are seen by the ExtraHop system, as shown in the following figure:
It can be difficult to tell whether an issue is caused by a network or a device from looking only at transfer and processing times, because these metrics alone provide an incomplete picture. Therefore the round trip time (RTT) metric is also included in this chart. RTT metrics are a good indicator of how your network is performing. If you see high transfer or processing times, but the RTT is low, the issue is probably at the device-level. However, if the RTT, processing, and transfer times are all high, network latency might be affecting the transfer and processing times, and the issue might be with the network.
The RTT metric can help identify the source of the problem because it only measures how long an immediate acknowledgment takes to be sent from the client or server; it does not wait until all packets are delivered.
The ExtraHop system calculates the RTT value by measuring the time between the first packet of a request and the acknowledgment from the server, as shown in the following figure:
The request transfer time might be high because the client took a long time to transmit the request (possibly because the request was very large); however, the transfer time could also be high because the request took a long time to travel on the network (possibly because of network congestion).
Learn more about how the ExtraHop system calculates round trip time on the ExtraHop blog.
Metric DescriptioN Request Transfer Time When the device is acting as an SMTP server, the time between the ExtraHop system detecting the first packet and last packet of received requests. A high number might indicate a large request or network delay. Server Processing Time When the device is acting as an SMTP server, the time between the ExtraHop system detecting the last packet of the received request and first packet of the sent response. Response Transfer Time When the device is acting as an SMTP server, the time between the ExtraHop system detecting the first packet and last packet of sent responses. A high number might indicate a large response or network delay. Round Trip Time The time between when a SMTP server sent a packet that required an immediate acknowledgment and when the server received the acknowledgment. Round trip time (RTT) is a measurement of network latency. The Performance (95th percentile) chart shows the highest value for a time period while filtering outliers; the 95th percentile is the highest value that falls below 95% of the values for a sample period. By displaying the 95th value, rather than the true maximum, the chart gives you a more accurate view of the data:
- Performance (95th)
-
This chart shows the 95th percentile of timing
metrics, measured in milliseconds. If a server is acting slow, performance summary
metrics can help you figure out whether the network or the server is causing the
issue. The performance summary metrics show the 95th percentile amount of time the
server took to process requests from clients versus the 95th percentile time that
packets from those requests (and their respective responses) took to be transmitted
across the network. High server processing times indicate that the server is slow.
High RTTs indicate that the server is communicating over slow networks.
Metric Description Server Processing Time When the device is acting as an SMTP server, the time between the ExtraHop system detecting the last packet of the received request and first packet of the sent response. Round Trip Time The time between when a SMTP server sent a packet that required an immediate acknowledgment and when the server received the acknowledgment. Round trip time (RTT) is a measurement of network latency.
Transaction Details
The following charts are available in this region:
- Top Methods
- This chart shows which SMTP methods were called on the server the most by breaking out the total number of requests the server received by method.
- Top Errors
- This chart shows which SMTP errors the server returned the most by breaking out the total number of responses the server sent by error.
SMTP Performance
The following charts are available in this region:
- Server Processing Time Distribution
-
This chart breaks out server processing times in a histogram to
show the most common processing times, measured in milliseconds.
Metric Description Server Processing Time When the device is acting as an SMTP server, the time between the ExtraHop system detecting the last packet of the received request and first packet of the sent response. - Server Processing Time
-
This chart shows the median processing time for the server,
measured in milliseconds.
Metric Description Server Processing Time When the device is acting as an SMTP server, the time between the ExtraHop system detecting the last packet of the received request and first packet of the sent response. - Round Trip Time Distribution
-
This chart breaks out round trip times in a histogram to show the
most common round trip times, measured in milliseconds.
Metric Description Round Trip Time The time between when a SMTP server sent a packet that required an immediate acknowledgment and when the server received the acknowledgment. Round trip time (RTT) is a measurement of network latency. - Round Trip Time
-
This chart shows the median round trip time for the server, measured in
milliseconds.
Metric Description Round Trip Time The time between when a SMTP server sent a packet that required an immediate acknowledgment and when the server received the acknowledgment. Round trip time (RTT) is a measurement of network latency.
Network Data
This region shows you TCP information that is related to the current protocol. In general, host stalls indicate that there is an issue with either the server or the client, and network stalls indicate that there is an issue with the network.
- Host Stalls
- This chart shows the number of zero windows that were advertised or received by the
device. Devices control the amount of data they receive by specifying the number of
packets that can be sent to them over a given time period. When a device is sent more
data than it can process, the device advertises a zero window to ask its peer device to
stop sending packets completely until the device catches up. If you see a large number
of zero windows, a server or client might not be not fast enough to support the amount
of data being received.
Metric Definition Zero Windows In The number of zero windows that were sent to the device to stop the flow of data over the connection. A device advertises a Zero Window when incoming data is arriving too quickly to be processed. A large number of zero windows in indicates that a peer device was too slow to process the amount of data received.
Zero Windows Out The number of zero windows that were sent from the device to stop the flow of data. A device advertises a Zero Window when incoming data is arriving too quickly to be processed. A large number of zero windows out indicates that the client was too slow to process the amount of data received.
- Network Stalls
-
This chart shows the number of retransmission timeouts that occurred. Retransmission timeouts (RTOs) occur when a network drops too many packets, usually due to packet collisions or buffer exhaustion. If a device sends a request or response and does not receive confirmation within a specified amount of time, the device retransmits the request. If too many retransmissions are unacknowledged, an RTO occurs. If you see a large number of RTOs, the network might be too slow to support the current level of activity.
Metric Definition RTOs In The number of retransmission timeouts (RTOs) caused by network congestion as peers were sending data to the current device. An RTO is a 1-5 second stall in the TCP connection flow due to excessive retransmissions. If you see a large number of RTOs in, the device did not send an acknowledgment to the server quickly enough, or the network might be too slow to support the current level of activity. Depending on the timeout value configured in the operating system, this delay can be anywhere from 1 to 8 seconds.
RTOs Out The number of retransmission timeouts (RTOs) caused by network congestion as the device was sending data to its peers. An RTO is a 1-5 second stall in the TCP connection flow due to excessive retransmissions. If you see a large number of RTOs out, the device did not receive an acknowledgment from the server quickly enough, or the network might be too slow to support the current level of activity. Depending on the timeout value configured in the operating system, this delay can be anywhere from 1 to 8 seconds.
SMTP Metric Totals
The following charts are available in this region:
- Total Requests and Responses
- Requests and responses represent the conversation taking place between clients and
servers. If there are more requests than responses, clients might be sending more
requests than the server can handle or the network might be too slow. To identify
whether the issue is with the network or the server, check RTOs and zero windows in the
Network Data
section.
Note: It is unlikely that the total number of SMTP requests and responses will be exactly equal, even in a healthy environment. For example, you might be viewing a time period that captures a response to a request that was sent before the start of the time period. In general, the greater the difference between responses and errors, the greater the chance that there is an issue with those transactions. Metric Description Requests The number of requests that the device received when acting as an SMTP server. Responses The number of responses that the device sent when acting as an SMTP server. Errors When the device is acting as an SMTP server, the number of command responses sent that have a reply code >= 400. Aborted Requests The number of requests that this SMTP server began to receive but did not receive completely because the connection abruptly closed. Aborted Responses The number of requests that this SMTP server began to receive but did not receive completely because the connection abruptly closed. Encrypted Sessions The number of encrypted sessions that the device participated in when acting as an SMTP server. - Request and Response Size
-
Metric Description Request Size The distribution of sizes (in bytes) of requests that the device received when acting as an SMTP server. Response Size The distribution of sizes (in bytes) of responses that the device received when acting as an SMTP server.
SMTP client group page
This page displays metric charts of SMTP traffic associated with a device group on your network.
- Learn about charts on this page:
- Learn about working with metrics.
SMTP Summary for Group
The following charts are available in this region:
- Total Transactions
- This chart shows you when SMTP errors occurred and how many responses the SMTP clients
received. This information can help you see how active the clients were at the time they
received the errors.
If you see a large number of errors, you can view details about each error. However, if the number of errors is low, the issue might be more complex, and you should examine the ratio of SMTP requests to SMTP responses. In a healthy environment, the number of requests and responses should be roughly equal. For more information, see the SMTP Metrics for Group chart.
Tip: To view each error that was returned to the clients, click Responses and then select Error from the menu. Metric Description Responses The number of responses that the device received when acting as an SMTP client. Errors When the device is acting as an SMTP client, the number of command responses received that have a reply code >= 400. - Total Transactions
- This chart shows you how many SMTP responses the clients received and how many of
those responses contained errors.
Metric Description Responses The number of responses that the device received when acting as an SMTP client. Errors When the device is acting as an SMTP client, the number of command responses received that have a reply code >= 400.
SMTP Details for Group
The following charts are available in this region:
- Top Group Members (SMTP Clients)
- This chart shows which SMTP clients in the group were most active by breaking out the total number of SMTP requests the group sent by client.
- Top Methods
- This chart shows which SMTP methods the group called the most by breaking out the total number of requests the group sent by method.
- Top Errors
- This chart shows which SMTP errors the group received the most by breaking out the number of responses returned to the group by error.
SMPP Metrics for Group
The following charts are available in this region:
- Total Requests and Responses
-
Requests
and responses represent the conversation taking place between clients and servers. If there
are more requests than responses, the clients might be sending more requests than servers
can handle or the network might be too slow.
Note: It is unlikely that the total number of requests and responses will be exactly equal, even in a healthy environment. For example, you might be viewing a time period that captures a response to a request that was sent before the start of the time period. In general, the greater the difference between responses and errors, the greater the chance that there is an issue with those transactions. Metric Description Requests The number of requests that the device sent when acting as an SMTP client. Responses The number of responses that the device received when acting as an SMTP client. Aborted Requests The number of requests that this SMTP client began to send but did not send completely because the connection abruptly closed. Aborted Responses The number of requests that this SMTP client began to send but did not send completely because the connection abruptly closed. Sessions The number of sessions that the device participated in when acting as an SMTP client. Encrypted Sessions The number of encrypted sessions that the device participated in when acting as an SMTP client. Errors When the device is acting as an SMTP client, the number of command responses received that have a reply code >= 400. - Server Processing Time
-
If a client group is acting slow, the server processing time
can help you figure out whether the issue is with the servers. The Server Processing Time
chart shows the median amount of time servers took to process requests from the clients,
measured in milliseconds. High server processing times indicate that the clients are
contacting slow servers.
Metric Description Server Processing Time When the device is acting as an SMTP client, the time between the ExtraHop system detecting the last packet of the sent request and the first packet of the received response.
SMTP server group page
This page displays metric charts of SMTP traffic associated with a device group on your network.
- Learn about charts on this page:
- Learn about working with metrics.
SMTP Summary for Group
The following charts are available in this region:
- Transactions
- This chart shows you when SMTP errors occurred and how many SMTP responses the servers
sent. This information can help you see how active the servers were at the time they
returned the errors.
If you see a large number of errors, you can view details about each error. However, if the number of errors is low, the issue might be more complex, and you should examine the ratio of SMTP requests to SMTP responses. In a healthy environment, the number of requests and responses should be roughly equal. For more information, see the SMTP Metrics for Group chart.
Tip: To view each error that was returned to the server, click Responses and then select Error from the menu. Metric Description Responses The number of responses that the device sent when acting as an SMTP server. Errors When the device is acting as an SMTP server, the number of command responses sent that have a reply code >= 400. - Total Transactions
- This chart shows you how many SMTP responses servers in the group sent and how many of
those responses contained errors.
Metric Description Responses The number of responses that the device sent when acting as an SMTP server. Errors When the device is acting as an SMTP server, the number of command responses sent that have a reply code >= 400.
SMTP Details for Group
The following charts are available in this region:
- Top Group Members (SMTP Servers)
- This chart shows which SMTP servers in the group were most active by breaking out the total number of SMTP responses the group sent by server.
- Top Methods
- This chart shows which SMTP methods were called on servers in the group the most by breaking out the total number of requests the group received by method.
- Top Errors
- This chart shows which SMTP errors the groups returned the most by breaking out the total number of responses the group sent by error.
SMPP Metrics for Group
The following charts are available in this region:
- Total Requests and Responses
-
Requests
and responses represent the conversation taking place between clients and servers. If there
are more requests than responses, clients might be sending more requests than the servers
can handle or the network might be too slow.
Note: It is unlikely that the total number of requests and responses will be exactly equal, even in a healthy environment. For example, you might be viewing a time period that captures a response to a request that was sent before the start of the time period. In general, the greater the difference between responses and errors, the greater the chance that there is an issue with those transactions. Metric Description Requests The number of requests that the device received when acting as an SMTP server. Responses The number of responses that the device sent when acting as an SMTP server. Errors When the device is acting as an SMTP server, the number of command responses sent that have a reply code >= 400. Aborted Requests The number of requests that this SMTP server began to receive but did not receive completely because the connection abruptly closed. Aborted Responses The number of requests that this SMTP server began to receive but did not receive completely because the connection abruptly closed. Encrypted Sessions The number of encrypted sessions that the device participated in when acting as an SMTP server. - Server Processing Time
-
The Server Processing Time chart shows the median amount of
time the servers took to process requests from clients, measured in milliseconds. High
server processing times indicate that the servers in a group are slow.
Metric Description Server Processing Time When the device is acting as an SMTP server, the time between the ExtraHop system detecting the last packet of the received request and first packet of the sent response.
SNMP
The ExtraHop system collects metrics about Simple Network Management Protocol (SNMP) activity. SNMP is a layer-7 protocol for collecting, organizing, exchanging, and modifying information about managed devices on IP networks.
| Note: | The ExtraHop system does not include any built-in metric pages for SNMP. However, you can view SNMP metrics by adding them to a custom page or dashboard. |
SSH
The ExtraHop system collects metrics about Secure Shell (SSH) activity. SSH is a protocol that securely transmits information over a network.
Security considerations
- SSH authentication can be vulnerable to brute force, which is a method for guessing credentials by submitting numerous authentication requests with different username and password combinations.
- Malware can disguise command-and-control (C&C) beaconing between a compromised device and an attacker-controlled server as legitimate SSH traffic.
- SSH is a remote service protocol that an attacker can leverage to interact with remote devices and laterally move across the network.
- SSH credentials can be stolen or SSH sessions can be hijacked to compromise remote devices.
SSH application page
This page displays metric charts of SSH traffic associated with an application container on your network.
- Learn about charts on this page:
- Learn about SSH security considerations
- Learn about working with metrics.
SSH Summary
The following charts are available in this region:
- Session Summary
- This chart shows you when the application participated in SSH sessions.
Metric Description SSH Sessions The number of SSH sessions associated with this application. A session is established after an SSH handshake is successfully completed. - Total Sessions
- This chart shows you how many SSH sessions the application participated in.
Metric Description SSH Sessions The number of SSH sessions associated with this application. A session is established after an SSH handshake is successfully completed.
SSH Algorithm Details
The following charts are available in this region:
- Key Exchange Algorithms
- This chart shows which key exchange algorithms the application created SSH keys through the most by breaking out the number of SSH sessions the application participated in by key exchange algorithm.
SSH Server Details
The following charts are available in this region:
- Cipher Algorithms
- This chart shows which cipher algorithms servers in the application encrypted data with the most by breaking out the number of SSH sessions the servers participated in by cipher algorithm.
- Compression Algorithms
- This chart shows which compression algorithms servers in the application compressed data with the most by breaking out the number of SSH sessions the servers participated in by compression algorithm.
- Top Implementations
- This chart shows which SSH implementations were used the most by servers in the application by breaking out the number of SSH sessions the servers participated in by implementation.
- MAC Algorithms
- This chart shows which MAC algorithms servers in the application verified data integrity through the most by breaking out the total number of SSH sessions the servers participated in by MAC algorithms.
SSH Client Details
The following charts are available in this region:
- Cipher Algorithms
- This chart shows which cipher algorithms clients in the application encrypted data with the most by breaking out the number of SSH sessions the clients participated in by cipher algorithm.
- Compression Algorithms
- This chart shows which compression algorithms clients in the application compressed data with the most by breaking out the number of SSH sessions the clients participated in by compression algorithm.
- Top Implementations
- This chart shows which SSH implementations were used the most by clients in the application by breaking out the number of SSH sessions the clients participated in by implementation.
- MAC Algorithms
- This chart shows which MAC algorithms clients in the application verified data integrity through the most by breaking out the total number of SSH sessions the clients participated in by MAC algorithms.
SSH Performance
The following charts are available in this region:
- Round Trip Time Distribution
-
This chart breaks out round trip times in a histogram to show the
most common round trip times, measured in milliseconds.
Metric Description Round Trip Time The time between when an SSH client or server sent a packet requiring immediate acknowledgment and when the acknowledgment was received. - Round Trip Time
-
This chart shows the median round trip time for the application,
measured in milliseconds.
Metric Description Round Trip Time The time between when an SSH client or server sent a packet requiring immediate acknowledgment and when the acknowledgment was received.
Network Data
This region shows you TCP information that is related to the current protocol. In general, host stalls indicate that there is an issue with either a server or a client, and network stalls indicate that there is an issue with the network.
- Host Stalls
-
This chart shows the number of zero windows that were
associated with an application. Devices control the amount of data they receive by
specifying the number of packets that can be sent to them over a given time period.
When a device is sent more data than it can process, the device advertises a zero
window to ask its peer device to stop sending packets completely until the device
catches up. If you see a large number of zero windows, a server or client might not be
not fast enough to support the amount of data being received.
Metric Definition Request Zero Windows The number of zero window advertisements sent by SSH clients. A device advertises a Zero Window when incoming data is arriving too quickly to be processed. A large number of incoming Zero Windows indicates that a peer device was too slow to process the amount of data received.
Response Zero Windows The number of zero window advertisements sent by servers while receiving SSH requests. A device advertises a Zero Window when incoming data is arriving too quickly to be processed. A large number of outgoing Zero Windows indicates that a client was too slow to process the amount of data received.
- Total Host Stalls
- This chart shows the median number of zero window advertisements sent by devices.
- Network Stalls
-
This chart shows the number of retransmission
timeouts that occurred. Retransmission timeouts (RTOs) occur when a network drops too
many packets, usually due to packet collisions or buffer exhaustion. If a device sends
a request or response and does not receive confirmation within a specified amount of
time, the device retransmits the request. If too many retransmissions are
unacknowledged, an RTO occurs. If you see a large number of RTOs, the network might be
too slow to support the current level of activity.
Metric Definition RTOs In The number of retransmission timeouts caused by congestion when clients were sending SSH requests. An RTO is a 1-5 second stall in the TCP connection flow due to excessive retransmissions. If you see a large number of incoming RTOs, a device did not send an acknowledgment to the server quickly enough, or the network might be too slow to support the current level of activity. Depending on the timeout value configured in the operating system, this delay can be anywhere from 1 to 8 seconds.
RTOs Out The number of retransmission timeouts caused by congestion when servers were sending SSH responses. An RTO is a 1-5 second stall in the TCP connection flow due to excessive retransmissions. If you see a large number of outgoing RTOs, a device did not receive an acknowledgment from the server quickly enough, or the network might be too slow to support the current level of activity. Depending on the timeout value configured in the operating system, this delay can be anywhere from 1 to 8 seconds.
- Total Network Stalls
-
This chart shows the median number of
retransmission timeouts caused by congestion when clients and servers were sending
requests.
Metric Definition RTOs In The number of retransmission timeouts caused by congestion when clients were sending SSH requests. An RTO is a 1-5 second stall in the TCP connection flow due to excessive retransmissions. If you see a large number of incoming RTOs, a device did not send an acknowledgment to the server quickly enough, or the network might be too slow to support the current level of activity. Depending on the timeout value configured in the operating system, this delay can be anywhere from 1 to 8 seconds.
RTOs Out The number of retransmission timeouts caused by congestion when servers were sending SSH responses. An RTO is a 1-5 second stall in the TCP connection flow due to excessive retransmissions. If you see a large number of outgoing RTOs, a device did not receive an acknowledgment from the server quickly enough, or the network might be too slow to support the current level of activity. Depending on the timeout value configured in the operating system, this delay can be anywhere from 1 to 8 seconds.
SSH Metric Totals
The following charts are available in this region:
- Total Requests and Responses
-
Requests and responses represent the conversation taking place between clients and servers. If there are more requests than responses, clients might be sending more requests than servers can handle or the network might be too slow. To identify whether the issue is with the network or a server, check RTOs and zero windows in the Network Data section.
Note: It is unlikely that the total number of SSH requests and responses will be exactly equal, even in a healthy environment. For example, you might be viewing a time period that captures a response to a request that was sent before the start of the time period. In general, the greater the difference between responses and errors, the greater the chance that there is an issue with those transactions. Metric Description Sessions The number of SSH sessions associated with this application. A session is established after an SSH handshake is successfully completed. Session Duration Mean The time between opening and closing the session. - SSH Network Metrics
-
Metric Description Request Zero Windows The number of zero window advertisements sent by SSH clients. A device advertises a Zero Window when incoming data is arriving too quickly to be processed. Response Zero Windows The number of zero window advertisements sent by servers while receiving SSH requests. A device advertises a Zero Window when incoming data is arriving too quickly to be processed. Request RTOs The number of retransmission timeouts caused by congestion when clients were sending SSH requests. An RTO is a 1-5 second stall in the TCP connection flow due to excessive retransmissions. Response RTOs The number of retransmission timeouts caused by congestion when servers were sending SSH responses. An RTO is a 1-5 second stall in the TCP connection flow due to excessive retransmissions. Request L2 Bytes The number of L2 bytes associated with SSH requests. Response L2 Bytes The number of L2 bytes associated with SSH responses. Request Goodput Bytes The number of goodput bytes associated with SSH requests. Goodput refers to the throughput of the original data transferred and excludes other throughput such as protocol headers or retransmitted packets. Response Goodput Bytes The number of goodput bytes associated with SSH responses. Goodput refers to the throughput of the original data transferred and excludes other throughput such as protocol headers or retransmitted packets. Request Packets The number of packets associated with SSH requests. Response Packets The number of packets associated with SSH responses.
SSH client page
This page displays metric charts of SSH traffic associated with a device on your network.
- Learn about charts on this page:
- Learn about SSH security considerations
- Learn about working with metrics.
SSH Summary
The following charts are available in this region:
- Sessions
- This chart shows you when the client participated in SSH sessions.
Metric Description SSH Sessions The number of times in which an SSH handshake was successfully completed when the device is acting as an SSH client. - Total Sessions
- This chart shows you how many SSH sessions the client participated in.
Metric Description SSH Sessions The number of times in which an SSH handshake was successfully completed when the device is acting as an SSH client.
SSH Algorithm Details
The following charts are available in this region:
- Top Cipher Algorithms
- This chart shows which cipher algorithms the client encrypted data with the most by breaking out the number of SSH sessions the client participated in by cipher algorithm.
- Top Compression Algorithms
- This chart shows which compression algorithms the client compressed data with the most by breaking out the number of SSH sessions the client participated in by compression algorithm.
- Top Key Exchange Algorithms
- This chart shows which key exchange algorithms the client created SSH keys through the most by breaking out the number of SSH sessions the client participated in by key exchange algorithm.
- Top MAC Algorithms
- This chart shows which MAC algorithms the client verified data integrity through the most by breaking out the total number of SSH sessions the client participated in by MAC algorithms.
SSH Performance
The following charts are available in this region:
- Round Trip Time Distribution
-
This chart breaks out round trip times in a histogram to show the
most common round trip times, measured in milliseconds.
Metric Description Round Trip Time The time between when a SSH client sent a packet that required an immediate acknowledgment and when the client received the acknowledgment. Round trip time (RTT) is a measurement of network latency. - Round Trip Time
-
This chart shows the median round trip time for the client, measured in
milliseconds.
Metric Description Round Trip Time The time between when a SSH client sent a packet that required an immediate acknowledgment and when the client received the acknowledgment. Round trip time (RTT) is a measurement of network latency.
Network Data
This region shows you TCP information that is related to the current protocol. In general, host stalls indicate that there is an issue with either the server or the client, and network stalls indicate that there is an issue with the network.
- Host Stalls
- This chart shows the number of zero windows that were advertised or received by the
device. Devices control the amount of data they receive by specifying the number of
packets that can be sent to them over a given time period. When a device is sent more
data than it can process, the device advertises a zero window to ask its peer device to
stop sending packets completely until the device catches up. If you see a large number
of zero windows, a server or client might not be not fast enough to support the amount
of data being received.
Metric Definition Zero Windows In The number of zero windows that were sent to the device to stop the flow of data over the connection. A device advertises a Zero Window when incoming data is arriving too quickly to be processed. A large number of zero windows in indicates that a peer device was too slow to process the amount of data received.
Zero Windows Out The number of zero windows that were sent from the device to stop the flow of data. A device advertises a Zero Window when incoming data is arriving too quickly to be processed. A large number of zero windows out indicates that the client was too slow to process the amount of data received.
- Network Stalls
-
This chart shows the number of retransmission timeouts that occurred. Retransmission timeouts (RTOs) occur when a network drops too many packets, usually due to packet collisions or buffer exhaustion. If a device sends a request or response and does not receive confirmation within a specified amount of time, the device retransmits the request. If too many retransmissions are unacknowledged, an RTO occurs. If you see a large number of RTOs, the network might be too slow to support the current level of activity.
Metric Definition RTOs In The number of retransmission timeouts (RTOs) caused by network congestion as peers were sending data to the current device. An RTO is a 1-5 second stall in the TCP connection flow due to excessive retransmissions. If you see a large number of RTOs in, the device did not send an acknowledgment to the server quickly enough, or the network might be too slow to support the current level of activity. Depending on the timeout value configured in the operating system, this delay can be anywhere from 1 to 8 seconds.
RTOs Out The number of retransmission timeouts (RTOs) caused by network congestion as the device was sending data to its peers. An RTO is a 1-5 second stall in the TCP connection flow due to excessive retransmissions. If you see a large number of RTOs out, the device did not receive an acknowledgment from the server quickly enough, or the network might be too slow to support the current level of activity. Depending on the timeout value configured in the operating system, this delay can be anywhere from 1 to 8 seconds.
SSH server page
This page displays metric charts of SSH traffic associated with a device on your network.
- Learn about charts on this page:
- Learn about SSH security considerations
- Learn about working with metrics.
SSH Summary
The following charts are available in this region:
- Sessions
- This chart shows you when the server participated in SSH sessions.
Metric Description SSH Sessions The number of times in which an SSH handshake was successfully completed when the device is acting as an SSH server. - Total Sessions
- This chart shows you how many SSH sessions the server participated in.
Metric Description SSH Sessions The number of times in which an SSH handshake was successfully completed when the device is acting as an SSH server.
Algorithm Details
The following charts are available in this region:
- Top Cipher Algorithms
- This chart shows which cipher algorithms the server encrypted data with the most by breaking out the number of SSH sessions the server participated in by cipher algorithm.
- Top Compression Algorithms
- This chart shows which compression algorithms the server compressed data with the most by breaking out the number of SSH sessions the server participated in by compression algorithm.
- Top Key Exchange Algorithms
- This chart shows which key exchange algorithms the server created SSH keys through the most by breaking out the number of SSH sessions the server participated in by key exchange algorithm.
- Top MAC Algorithms
- This chart shows which MAC algorithms the server verified data integrity through the most by breaking out the total number of SSH sessions the server participated in by MAC algorithms.
SSH Performance
The following charts are available in this region:
- Round Trip Time Distribution
-
This chart breaks out round trip times in a histogram to show the
most common round trip times, measured in milliseconds.
Metric Description Round Trip Time The time between when an SSH server sent a packet that required an immediate acknowledgment and when the server received the acknowledgment. Round trip time (RTT) is a measurement of network latency. - Round Trip Time
-
This chart shows the median round trip time for the client, measured in
milliseconds.
Metric Description Round Trip Time The time between when an SSH server sent a packet that required an immediate acknowledgment and when the server received the acknowledgment. Round trip time (RTT) is a measurement of network latency.
Network Data
This region shows you TCP information that is related to the current protocol. In general, host stalls indicate that there is an issue with either the server or the client, and network stalls indicate that there is an issue with the network.
- Host Stalls
- This chart shows the number of zero windows that were advertised or received by the
device. Devices control the amount of data they receive by specifying the number of
packets that can be sent to them over a given time period. When a device is sent more
data than it can process, the device advertises a zero window to ask its peer device to
stop sending packets completely until the device catches up. If you see a large number
of zero windows, a server or client might not be not fast enough to support the amount
of data being received.
Metric Definition Zero Windows In The number of zero windows that were sent to the device to stop the flow of data over the connection. A device advertises a Zero Window when incoming data is arriving too quickly to be processed. A large number of zero windows in indicates that a peer device was too slow to process the amount of data received.
Zero Windows Out The number of zero windows that were sent from the device to stop the flow of data. A device advertises a Zero Window when incoming data is arriving too quickly to be processed. A large number of zero windows out indicates that the client was too slow to process the amount of data received.
- Network Stalls
-
This chart shows the number of retransmission timeouts that occurred. Retransmission timeouts (RTOs) occur when a network drops too many packets, usually due to packet collisions or buffer exhaustion. If a device sends a request or response and does not receive confirmation within a specified amount of time, the device retransmits the request. If too many retransmissions are unacknowledged, an RTO occurs. If you see a large number of RTOs, the network might be too slow to support the current level of activity.
Metric Definition RTOs In The number of retransmission timeouts (RTOs) caused by network congestion as peers were sending data to the current device. An RTO is a 1-5 second stall in the TCP connection flow due to excessive retransmissions. If you see a large number of RTOs in, the device did not send an acknowledgment to the server quickly enough, or the network might be too slow to support the current level of activity. Depending on the timeout value configured in the operating system, this delay can be anywhere from 1 to 8 seconds.
RTOs Out The number of retransmission timeouts (RTOs) caused by network congestion as the device was sending data to its peers. An RTO is a 1-5 second stall in the TCP connection flow due to excessive retransmissions. If you see a large number of RTOs out, the device did not receive an acknowledgment from the server quickly enough, or the network might be too slow to support the current level of activity. Depending on the timeout value configured in the operating system, this delay can be anywhere from 1 to 8 seconds.
SSH client group page
This page displays metric charts of SSH traffic associated with a device group on your network.
- Learn about charts on this page:
- Learn about SSH security considerations
- Learn about working with metrics.
SSH Summary for Group
The following charts are available in this region:
- Sessions
- This chart shows you when the clients in the group participated in SSH sessions.
Metric Description SSH Sessions The number of times in which an SSH handshake was successfully completed when the device is acting as an SSH client. - Total Sessions
- This chart shows you how many SSH sessions the clients in the group participated
in.
Metric Description SSH Sessions The number of times in which an SSH handshake was successfully completed when the device is acting as an SSH client.
SSH Algorithm Details for Group
The following charts are available in this region:
- Top Group Members (SSH Clients)
- This chart shows which SSH clients in the group were most active by breaking out the total number of SSH requests the group sent by client.
- Cipher Algorithms
- This chart shows which cipher algorithms the group encrypted data with the most by breaking out the number of SSH sessions the group participated in by cipher algorithm.
- Key Exchange Algorithms
- This chart shows which key exchange algorithms the group created SSH keys through the most by breaking out the number of SSH sessions the group participated in by key exchange algorithm.
- MAC Algorithms
- This chart shows which MAC algorithms the group verified data integrity through the most by breaking out the total number of SSH sessions the group participated in by MAC algorithms.
SSH server group page
This page displays metric charts of SSH traffic associated with a device group on your network.
- Learn about charts on this page:
- Learn about SSH security considerations
- Learn about working with metrics.
SSH Summary for Group
The following charts are available in this region:
- Sessions
- This chart shows you when the servers in the group participated in SSH sessions.
Metric Description SSH Sessions The number of times in which an SSH handshake was successfully completed when the device is acting as an SSH server. - Total Sessions
- This chart shows you how many SSH sessions the servers in the group participated
in.
Metric Description SSH Sessions The number of times in which an SSH handshake was successfully completed when the device is acting as an SSH server.
SSH Algorithm Details for Group
The following charts are available in this region:
- Top Group Members (SSH Servers)
- This chart shows which SSH servers in the group were most active by breaking out the total number of SSH responses the group sent by server.
- Cipher Algorithms
- This chart shows which cipher algorithms the group encrypted data with the most by breaking out the number of SSH sessions the group participated in by cipher algorithm.
- Key Exchange Algorithms
- This chart shows which key exchange algorithms the group created SSH keys through the most by breaking out the number of SSH sessions the group participated in by key exchange algorithm.
- MAC Algorithms
- This chart shows which MAC algorithms the group verified data integrity through the most by breaking out the total number of SSH sessions the group participated in by MAC algorithms.
SOCKS
The ExtraHop system collects metrics about SOCKS (SOCKet Secure) protocol activity. SOCKS is a network protocol that routes traffic between a client and a server through a proxy server. The proxy server creates a TCP connection on behalf of the client to a server behind the firewall and then routes traffic between the client and the actual server.
| Note: | The ExtraHop system does not include any built-in metric pages for SOCKS. However, you can view SOCKS metrics by adding them to a custom page or dashboard. |
Storage NAS
The ExtraHop system collects metrics about network-attached storage (NAS) activity. NAS is a file-level storage repository. Clients can access the repository through SMB (Server Message Block) or NFS (Network File System) protocols.
NAS application page
This page displays metric charts of Storage NAS traffic associated with application containers on your network.
- Learn about charts on this page:
- Learn about working with metrics.
NAS Summary
The following charts are available in this region:
- Transactions
- This chart shows you when NAS warnings, errors, and responses were associated with the
application. This information can help you see how active the application was at the
time the errors and warnings occurred.
In a healthy environment, the number of requests and responses should be roughly equal. For more information, see Requests and Responses.
Metric Description Responses The number of NFS and SMB responses sent or received by network attached storage (NAS) devices. Errors The number of NFS and SMB response errors sent or received by network attached storage (NAS) devices. Errors can range from informational to severe. A large volume of errors should be investigated. Warnings The number of response warnings sent or received by network attached storage (NAS) devices. CIFS Responses The number of SMB responses sent or received by network attached storage (NAS) devices. NFS Responses The number of NFS responses sent or received by network-attached storage (NAS) devices. - Total Transactions
- This chart displays the total number of NAS responses that were associated with the
application and how many of those responses contained warnings and errors.
Metric Description Responses The number of NFS and SMB responses sent or received by network attached storage (NAS) devices. Errors The number of NFS and SMB response errors sent or received by network attached storage (NAS) devices. Errors can range from informational to severe. A large volume of errors should be investigated. Warnings The number of response warnings sent or received by network attached storage (NAS) devices. CIFS Responses The number of SMB responses sent or received by network attached storage (NAS) devices. NFS Responses The number of NFS responses sent or received by network-attached storage (NAS) devices. - Operations
- This chart shows you when the application performed NAS read, write, and file system
information request operations.
Metric Description Reads The number of read operation requests sent or received by network attached storage (NAS) devices. Writes The number of write operation requests sent or received by network attached storage (NAS) devices. File System Information Requests The number of NFS and SMB file system metadata queries transferred from network attached storage (NAS) devices. - Total Operations
- This chart shows you how many NAS read and write operations the application
performed.
Metric Description Reads The number of read operation requests sent or received by network attached storage (NAS) devices. Writes The number of write operation requests sent or received by network attached storage (NAS) devices. - Access Time (95th Percentile)
- This chart shows the 95th percentile of access times for the application over time,
measured in milliseconds. High server access times indicate that the application is
contacting slow servers.
Metric Description Access Time The time to access a file on an SMB or NFS partition. For SMB, the access time is measured by timing the first READ or WRITE on every flow. For NFS, the access time is measured by timing non-pipelined commands for every READ and WRITE. - Access Time (95th Percentile)
- This chart shows the 95th percentile of access times for the selected time period,
measured in milliseconds.
Metric Description Access Time The time to access a file on an SMB or NFS partition. For SMB, the access time is measured by timing the first READ or WRITE on every flow. For NFS, the access time is measured by timing non-pipelined commands for every READ and WRITE. - Performance (95th Percentile)
-
This chart shows the 95th percentile of timing metrics,
measured in milliseconds. The transfer and processing time metrics show parts of a
complete transaction. The request transfer time shows how long clients took to transmit
requests onto the network; the server processing time shows how long the servers took to
process requests; and the response transfer time shows how long the servers took to
transmit responses onto the network.
Transfer and processing times are calculated by measuring the time between when the first and last packets of requests and responses are seen by the ExtraHop system, as shown in the following figure:
It can be difficult to tell whether an issue is caused by a network or a device from looking only at transfer and processing times, because these metrics alone provide an incomplete picture. Therefore the round trip time (RTT) metric is also included in this chart. RTT metrics are a good indicator of how your network is performing. If you see high transfer or processing times, but the RTT is low, the issue is probably at the device-level. However, if the RTT, processing, and transfer times are all high, network latency might be affecting the transfer and processing times, and the issue might be with the network.
The RTT metric can help identify the source of the problem because it only measures how long an immediate acknowledgment takes to be sent from the client or server; it does not wait until all packets are delivered.
The ExtraHop system calculates the RTT value by measuring the time between the first packet of a request and the acknowledgment from the server, as shown in the following figure:
The request transfer time might be high because the client took a long time to transmit the request (possibly because the request was very large); however, the transfer time could also be high because the request took a long time to travel on the network (possibly because of network congestion).
Learn more about how the ExtraHop system calculates round trip time on the ExtraHop blog.
Metric Description Request Transfer Time The time between the ExtraHop system detecting the first packet and last packet of network attached storage (NAS) requests. A high number might indicate a large request or network delay. Server Processing Time The time between the ExtraHop system detecting the last packet of network attached storage (NAS) requests and the first packet of their corresponding responses. Response Transfer Time The time between the ExtraHop system detecting the first packet and last packet of network attached storage (NAS) responses. A high number might indicate a large request or network delay. Round Trip Time The time between when a network attached storage (NAS) client or server sent a packet requiring immediate acknowledgment and when the acknowledgment was received. The Performance (95th percentile) chart shows the highest value for a time period while filtering outliers; the 95th percentile is the highest value that falls below 95% of the values for a sample period. By displaying the 95th value, rather than the true maximum, the chart gives you a more accurate view of the data:
- Performance (95th)
-
This chart shows the 95th percentile of timing
metrics, measured in milliseconds. If an application is acting slow, performance
summary metrics can help you figure out whether the network or servers are causing the
issue. These metrics show the 95th percentile of time that servers took to process
requests from clients versus the 95th percentile time that packets from those requests
(and their respective responses) took to be transmitted across the network. High
server processing times indicate that clients are contacting slow servers. High TCP
round trip times indicate that clients are communicating over slow networks.
Metric Description Server Processing Time The time between the ExtraHop system detecting the last packet of network attached storage (NAS) requests and the first packet of their corresponding responses. Round Trip Time The time between when a network attached storage (NAS) client or server sent a packet requiring immediate acknowledgment and when the acknowledgment was received.
NAS Details
The following charts are available in this region:
- Top Files
- This chart shows which files the application accessed the most by breaking out the total number of NAS responses the application received by file path.
- Top Errors
- This chart shows which NAS errors were associated with the application the most by breaking out the number of responses by error.
NAS Performance
The following charts are available in this region:
- Server Processing Time Distribution
-
This chart breaks out server processing times in a histogram to
show the most common processing times, measured in milliseconds.
Metric Description Server Processing Time The time between the ExtraHop system detecting the last packet of network attached storage (NAS) requests and the first packet of their corresponding responses. - Server Processing Time
-
This chart shows the median processing time for the
application, measured in milliseconds.
Metric Description Server Processing Time The time between the ExtraHop system detecting the last packet of network attached storage (NAS) requests and the first packet of their corresponding responses. - Access Time Distribution
- This chart breaks out access times in a histogram to show the most common access
times, measured in milliseconds.
Metric Description Access Time The time to access a file on an SMB or NFS partition. For SMB, the access time is measured by timing the first READ or WRITE on every flow. For NFS, the access time is measured by timing non-pipelined commands for every READ and WRITE. - Access Time
- This chart shows the median processing time for the application, measured in
milliseconds.
Metric Description Access Time The time to access a file on an SMB or NFS partition. For SMB, the access time is measured by timing the first READ or WRITE on every flow. For NFS, the access time is measured by timing non-pipelined commands for every READ and WRITE. - Round Trip Time Distribution
-
This chart breaks out round trip times in a histogram to show the
most common round trip times, measured in milliseconds.
Metric Description Round Trip Time The time between when a network attached storage (NAS) client or server sent a packet requiring immediate acknowledgment and when the acknowledgment was received. - Round Trip Time
-
This chart shows the median round trip time for the application,
measured in milliseconds.
Metric Description Round Trip Time The time between when a network attached storage (NAS) client or server sent a packet requiring immediate acknowledgment and when the acknowledgment was received.
Network Data
This region shows you TCP information that is related to the current protocol. In general, host stalls indicate that there is an issue with either a server or a client, and network stalls indicate that there is an issue with the network.
- Host Stalls
-
This chart shows the number of zero windows that were
associated with an application. Devices control the amount of data they receive by
specifying the number of packets that can be sent to them over a given time period.
When a device is sent more data than it can process, the device advertises a zero
window to ask its peer device to stop sending packets completely until the device
catches up. If you see a large number of zero windows, a server or client might not be
not fast enough to support the amount of data being received.
Metric Definition Request Zero Windows The number of zero window advertisements sent by network attached storage (NAS) clients. A device advertises a Zero Window when incoming data is arriving too quickly to be processed. A large number of incoming Zero Windows indicates that a peer device was too slow to process the amount of data received.
Response Zero Windows The number of zero window advertisements sent by servers while receiving network attached storage (NAS) requests. A device advertises a Zero Window when incoming data is arriving too quickly to be processed. A large number of outgoing Zero Windows indicates that a client was too slow to process the amount of data received.
- Total Host Stalls
- This chart shows the median number of zero window advertisements sent by devices.
- Network Stalls
-
This chart shows the number of retransmission
timeouts that occurred. Retransmission timeouts (RTOs) occur when a network drops too
many packets, usually due to packet collisions or buffer exhaustion. If a device sends
a request or response and does not receive confirmation within a specified amount of
time, the device retransmits the request. If too many retransmissions are
unacknowledged, an RTO occurs. If you see a large number of RTOs, the network might be
too slow to support the current level of activity.
Metric Definition RTOs In The number of retransmission timeouts (RTOs) caused by congestion when network attached storage (NAS) clients were sending requests. An RTO is a 1-5 second stall in the TCP connection flow due to excessive retransmissions. If you see a large number of incoming RTOs, a device did not send an acknowledgment to the server quickly enough, or the network might be too slow to support the current level of activity. Depending on the timeout value configured in the operating system, this delay can be anywhere from 1 to 8 seconds.
RTOs Out The number of retransmission timeouts caused by congestion when servers were sending network attached storage (NAS) responses. An RTO is a 1-5 second stall in the TCP connection flow due to excessive retransmissions. If you see a large number of outgoing RTOs, a device did not receive an acknowledgment from the server quickly enough, or the network might be too slow to support the current level of activity. Depending on the timeout value configured in the operating system, this delay can be anywhere from 1 to 8 seconds.
- Total Network Stalls
-
This chart shows the median number of
retransmission timeouts caused by congestion when clients and servers were sending
requests.
Metric Definition RTOs In The number of retransmission timeouts (RTOs) caused by congestion when network attached storage (NAS) clients were sending requests. An RTO is a 1-5 second stall in the TCP connection flow due to excessive retransmissions. If you see a large number of incoming RTOs, a device did not send an acknowledgment to the server quickly enough, or the network might be too slow to support the current level of activity. Depending on the timeout value configured in the operating system, this delay can be anywhere from 1 to 8 seconds.
RTOs Out The number of retransmission timeouts caused by congestion when servers were sending network attached storage (NAS) responses. An RTO is a 1-5 second stall in the TCP connection flow due to excessive retransmissions. If you see a large number of outgoing RTOs, a device did not receive an acknowledgment from the server quickly enough, or the network might be too slow to support the current level of activity. Depending on the timeout value configured in the operating system, this delay can be anywhere from 1 to 8 seconds.
NAS Metric Totals
The following charts are available in this region:
- Total Requests and Responses
-
Requests and responses represent the conversation taking place between clients and servers. If there are more requests than responses, clients might be sending more requests than servers can handle or the network might be too slow. To identify whether the issue is with the network or a server, check RTOs and zero windows in the Network Data section.
Note: It is unlikely that the total number of NAS requests and responses will be exactly equal, even in a healthy environment. For example, you might be viewing a time period that captures a response to a request that was sent before the start of the time period. In general, the greater the difference between responses and errors, the greater the chance that there is an issue with those transactions. Metric Description Responses The number of NFS and SMB responses sent or received by network attached storage (NAS) devices. CIFS Responses The number of SMB responses sent or received by network attached storage (NAS) devices. NFS Responses The number of NFS responses sent or received by network-attached storage (NAS) devices. Warnings The number of response warnings sent or received by network attached storage (NAS) devices. Errors The number of NFS and SMB response errors sent or received by network attached storage (NAS) devices. Errors can range from informational to severe. A large volume of errors should be investigated. Reads The number of read operation requests sent or received by network attached storage (NAS) devices. Writes The number of write operation requests sent or received by network attached storage (NAS) devices. File System Information Requests The number of NFS and SMB file system metadata queries transferred from network attached storage (NAS) devices. Locks The number of NFS and SMB lock operation requests sent and received by network attached storage (NAS) devices. File locking prevents unintentional loss of data from concurrent writes to the same file or from file corruption. - NAS Network Metrics
-
Metric Description Request Zero Windows The number of zero window advertisements sent by network attached storage (NAS) clients. A device advertises a Zero Window when incoming data is arriving too quickly to be processed. Response Zero Windows The number of zero window advertisements sent by servers while receiving network attached storage (NAS) requests. A device advertises a Zero Window when incoming data is arriving too quickly to be processed. Request RTOs The number of retransmission timeouts (RTOs) caused by congestion when network attached storage (NAS) clients were sending requests. An RTO is a 1-5 second stall in the TCP connection flow due to excessive retransmissions. Response RTOs The number of retransmission timeouts caused by congestion when servers were sending network attached storage (NAS) responses. An RTO is a 1-5 second stall in the TCP connection flow due to excessive retransmissions. Request L2 Bytes The number of L2 bytes associated with requests sent or received by network attached storage (NAS) devices. Response L2 Bytes The number of L2 bytes associated with responses sent or received by network attached storage (NAS) devices. Request Goodput Bytes The number of goodput bytes associated with requests sent or received by network attached storage (NAS) devices. Goodput refers to the throughput of the original data transferred and excludes other throughput such as protocol headers or retransmitted packets. Response Goodput Bytes The number of goodput bytes associated with responses sent or received network attached storage (NAS) devices. Goodput refers to the throughput of the original data transferred and excludes other throughput such as protocol headers or retransmitted packets. Request Packets The number of packets associated with requests network attached storage (NAS) devices. Response Packets The number of packets associated with responses sent or received by network attached storage (NAS) devices.
Telnet
The ExtraHop system collects metrics about Teletype Network Protocol (Telnet) activity. Telnet is a protocol for interactive text-oriented communications over a virtual terminal connection. Telnet provides a command line interface for communication with a remote device or server, sometimes employed for remote management such as initial network hardware setup.
Security considerations
- Unencrypted Telnet connections might expose sensitive data to attackers that intercept Telnet traffic.
- Telnet is a remote service protocol that an attacker can leverage to interact with remote devices and laterally move across the network.
Telnet client page
This page displays metric charts of Telnet traffic associated with a device on your network.
- Learn about charts on this page:
- Learn about Telnet security considerations
- Learn about working with metrics.
Telnet Summary
The following charts are available in this region:
- Packets
- This chart shows when Telnet request packets were sent and response packets were
received by the client.
Metric Description Request Packets The number of packets associated with Telnet requests. Response Packets The number of packets associated with Telnet responses. - Total Packets
- This chart shows the total number of Telnet request packets sent and response packets
received by the server.
Metric Description Request Packets The number of packets associated with Telnet requests. Response Packets The number of packets associated with Telnet responses. - Round Trip Time
- This chart shows percentiles of round trip time (RTT). The RTT metric measures how
long it took for packets to get an immediate acknowledgment from the client or server,
measured in milliseconds. Therefore, RTT is a good indicator of how your network is
performing.
Learn more about how the ExtraHop system calculates round trip time on the ExtraHop blog.
Metric Description Round Trip Time The number of packets associated with Telnet requests. - Round Trip Time
- This chart shows the 95th percentile and median RTT, measured in milliseconds.
Metric Description Round Trip Time The time between when a Telnet client sent a packet that required an immediate acknowledgment and when the client received the acknowledgment. Round trip time (RTT) is a measurement of network latency. The Performance (95th Percentile) chart shows the 95th percentile to show the highest value for a time period while filtering outliers; the 95th percentile is the highest value that falls below 95% of the values for a sample period. The following chart shows how displaying the 95th value, rather than the true maximum, can give a more accurate view of the data:
Network Data
This region shows you TCP information that is related to the current protocol. In general, host stalls indicate that there is an issue with either the server or the client, and network stalls indicate that there is an issue with the network.
- Host Stalls
- This chart shows the number of zero windows that were advertised or received by the
device. Devices control the amount of data they receive by specifying the number of
packets that can be sent to them over a given time period. When a device is sent more
data than it can process, the device advertises a zero window to ask its peer device to
stop sending packets completely until the device catches up. If you see a large number
of zero windows, a server or client might not be not fast enough to support the amount
of data being received.
Metric Definition Zero Windows In The number of zero windows that were sent to the device to stop the flow of data over the connection. A device advertises a Zero Window when incoming data is arriving too quickly to be processed. A large number of zero windows in indicates that a peer device was too slow to process the amount of data received.
Zero Windows Out The number of zero windows that were sent from the device to stop the flow of data. A device advertises a Zero Window when incoming data is arriving too quickly to be processed. A large number of zero windows out indicates that the client was too slow to process the amount of data received.
- Network Stalls
-
This chart shows the number of retransmission timeouts that occurred. Retransmission timeouts (RTOs) occur when a network drops too many packets, usually due to packet collisions or buffer exhaustion. If a device sends a request or response and does not receive confirmation within a specified amount of time, the device retransmits the request. If too many retransmissions are unacknowledged, an RTO occurs. If you see a large number of RTOs, the network might be too slow to support the current level of activity.
Metric Definition RTOs In The number of retransmission timeouts (RTOs) caused by network congestion as peers were sending data to the current device. An RTO is a 1-5 second stall in the TCP connection flow due to excessive retransmissions. If you see a large number of RTOs in, the device did not send an acknowledgment to the server quickly enough, or the network might be too slow to support the current level of activity. Depending on the timeout value configured in the operating system, this delay can be anywhere from 1 to 8 seconds.
RTOs Out The number of retransmission timeouts (RTOs) caused by network congestion as the device was sending data to its peers. An RTO is a 1-5 second stall in the TCP connection flow due to excessive retransmissions. If you see a large number of RTOs out, the device did not receive an acknowledgment from the server quickly enough, or the network might be too slow to support the current level of activity. Depending on the timeout value configured in the operating system, this delay can be anywhere from 1 to 8 seconds.
Telnet server page
This page displays metric charts of Telnet traffic associated with a device on your network.
- Learn about charts on this page:
- Learn about Telnet security considerations
- Learn about working with metrics.
Telnet Summary
The following charts are available in this region:
- Packets
- This chart shows when Telnet request packets were received and response packets were
sent by the server.
Metric Description Request Packets The number of packets associated with Telnet requests. Response Packets The number of packets associated with Telnet responses. - Total Packets
- This chart shows the total number of Telnet request packets received and response
packets sent by the server.
Metric Description Request Packets The number of packets associated with Telnet requests. Response Packets The number of packets associated with Telnet responses. - Round Trip Time
- This chart shows percentiles of round trip time (RTT). The RTT metric measures how
long it took for packets to get an immediate acknowledgment from the client or server,
measured in milliseconds. Therefore, RTT is a good indicator of how your network is
performing.
Learn more about how the ExtraHop system calculates round trip time on the ExtraHop blog.
Metric Description Round Trip Time The number of packets associated with Telnet requests. - Timing Summary
- This chart shows the 95th percentile and median RTT, measured in milliseconds.
Metric Description Round Trip Time The time between when a Telnet server sent a packet that required an immediate acknowledgment and when the server received the acknowledgment. Round trip time (RTT) is a measurement of network latency. The Performance (95th Percentile) chart shows the 95th percentile to show the highest value for a time period while filtering outliers; the 95th percentile is the highest value that falls below 95% of the values for a sample period. The following chart shows how displaying the 95th value, rather than the true maximum, can give a more accurate view of the data:
Network Data
This region shows you TCP information that is related to the current protocol. In general, host stalls indicate that there is an issue with either the server or the client, and network stalls indicate that there is an issue with the network.
- Host Stalls
- This chart shows the number of zero windows that were advertised or received by the
device. Devices control the amount of data they receive by specifying the number of
packets that can be sent to them over a given time period. When a device is sent more
data than it can process, the device advertises a zero window to ask its peer device to
stop sending packets completely until the device catches up. If you see a large number
of zero windows, a server or client might not be not fast enough to support the amount
of data being received.
Metric Definition Zero Windows In The number of zero windows that were sent to the device to stop the flow of data over the connection. A device advertises a Zero Window when incoming data is arriving too quickly to be processed. A large number of zero windows in indicates that a peer device was too slow to process the amount of data received.
Zero Windows Out The number of zero windows that were sent from the device to stop the flow of data. A device advertises a Zero Window when incoming data is arriving too quickly to be processed. A large number of zero windows out indicates that the client was too slow to process the amount of data received.
- Network Stalls
-
This chart shows the number of retransmission timeouts that occurred. Retransmission timeouts (RTOs) occur when a network drops too many packets, usually due to packet collisions or buffer exhaustion. If a device sends a request or response and does not receive confirmation within a specified amount of time, the device retransmits the request. If too many retransmissions are unacknowledged, an RTO occurs. If you see a large number of RTOs, the network might be too slow to support the current level of activity.
Metric Definition RTOs In The number of retransmission timeouts (RTOs) caused by network congestion as peers were sending data to the current device. An RTO is a 1-5 second stall in the TCP connection flow due to excessive retransmissions. If you see a large number of RTOs in, the device did not send an acknowledgment to the server quickly enough, or the network might be too slow to support the current level of activity. Depending on the timeout value configured in the operating system, this delay can be anywhere from 1 to 8 seconds.
RTOs Out The number of retransmission timeouts (RTOs) caused by network congestion as the device was sending data to its peers. An RTO is a 1-5 second stall in the TCP connection flow due to excessive retransmissions. If you see a large number of RTOs out, the device did not receive an acknowledgment from the server quickly enough, or the network might be too slow to support the current level of activity. Depending on the timeout value configured in the operating system, this delay can be anywhere from 1 to 8 seconds.
Telnet client group page
This page displays metric charts of Telnet traffic associated with a device group on your network.
- Learn about charts on this page:
- Learn about Telnet security considerations
- Learn about working with metrics.
Telnet Summary for Group
The following charts are available in this region:
- Packets
- This chart shows when Telnet request packets were sent and response packets were
received by the clients in the group.
Metric Description Request Packets The number of packets associated with Telnet requests. Response Packets The number of packets associated with Telnet responses. - Total Packets
- This chart shows how many Telnet request packets were sent and response packets were
received by the clients in the group.
Metric Description Request Packets The number of packets associated with Telnet requests. Response Packets The number of packets associated with Telnet responses.
Telnet server group page
This page displays metric charts of Telnet traffic associated with a device group on your network.
- Learn about charts on this page:
- Learn about Telnet security considerations
- Learn about working with metrics.
Telnet Summary for Group
The following charts are available in this region:
- Packets
- This chart shows when Telnet request packets were received and response packets were
sent by servers in the group.
Metric Description Request Packets The number of packets associated with Telnet requests. Response Packets The number of packets associated with Telnet responses. - Total Packets
- This chart shows how many Telnet request packets were received and response packets
were sent by servers in the group.
Metric Description Request Packets The number of packets associated with Telnet requests. Response Packets The number of packets associated with Telnet responses.
TLS
The ExtraHop system collects metrics about Secure Sockets Layer (SSL) and TLS (Transport Layer Security) activity. TLS are standard protocols for securing communication over the Internet. To establish an encrypted link between a web browser and a server, the server must have an SSL certificate.
| Note: | SSL metrics can include information about TLS traffic that is tunneled through HTTP-CONNECT. |
Learn more by taking the SSL Quick Peek training.
Security considerations
- SSL 3.0, TLS 1.0, and TLS 1.1 were deprecated because these versions of TLS only provide support for weak cipher algorithms and are vulnerable to attacks such as POODLE and BEAST.
- TLS certificates that are expired or self-signed can enable machine-in-the-middle (MITM) attacks.
- Encrypted TLS traffic is an increasingly common vector for malicious activity. You can configure the ExtraHop system to decrypt TLS traffic to enable detections that can identify suspicious behaviors and potential attacks.
TLS application page
This page displays metric charts of TLS traffic associated with an application container on your network.
- Learn about charts on this page:
- Learn about TLS security considerations
- Learn about working with metrics.
TLS Summary
The following charts are available in this region:
- Sessions
- This chart shows you when the application participated in TLS sessions.
Metric Description Connected Sessions The number of established secure connections associated with this application due to a completed TLS handshake. Decrypted Sessions The number of encrypted TLS sessions associated with this application for which the ExtraHop system had the necessary information to decrypt the session. Resumed Sessions The number of times an TLS session was resumed over a new connection with the original session ID or ticket. Aborted Sessions The number of attempted TLS sessions that did not proceed past the TLS handshake. No data was exchanged between devices after the handshake. If the number of aborted sessions is high, look at the TLS Alerts by Type metric to determine which errors occurred, such as problems with the certificate. Post Quantum Sessions The number of encrypted TLS sessions associated with this application established with post-quantum cryptography (PQC) algorithms. PQC is designed to resist attacks from quantum computers. Weak Ciphers The number of sessions associated with this application that were negotiated with a weak cipher suite. The ExtraHop system automatically detects weak cipher suites. CBC, DES, 3DES, RC4, null, anonymous, and export cipher suites are considered to be weak because they include an encryption algorithm that is known to be vulnerable. Data encrypted with a weak cipher suite is potentially insecure. Here is an example of a weak cipher suite: TLS_ECDH_anon_WITH_RC4_128_SHA
The following cipher suite algorithms are considered weak:Cipher Block Chaining (CBC): This algorithm has multiple known vulnerabilities, including those related to the Lucky Thirteen (CVE-2013-0169), POODLE (CVE-2014-3566), and BEAST (CVE-2011-3389) attacks.
Data Encryption Standard (DES): This algorithm is considered insecure because the 56-bit key is too small.
Triple Data Encryption Algorithm (3DES): This algorithm has a known vulnerability (CVE-2016-2183).
Rivest Cipher 4 (RC4): This algorithm is considered insecure because of biases in the RC4 keystream that can be exploited.
null: This value indicates that no encryption algorithm is applied to the data.
anon: This value indicates that no authentication is applied to the data.
export: This algorithm was intentionally designed to be weak to meet previous United States export laws.
- Total Sessions
- This chart shows you how many TLS sessions the application participated in.
Metric Description Connected Sessions The number of established secure connections associated with this application due to a completed TLS handshake. Decrypted Sessions The number of encrypted TLS sessions associated with this application for which the ExtraHop system had the necessary information to decrypt the session. Resumed Sessions The number of times an TLS session was resumed over a new connection with the original session ID or ticket. Aborted Sessions The number of attempted TLS sessions that did not proceed past the TLS handshake. No data was exchanged between devices after the handshake. If the number of aborted sessions is high, look at the TLS Alerts by Type metric to determine which errors occurred, such as problems with the certificate. Weak Ciphers The number of sessions associated with this application that were negotiated with a weak cipher suite. The ExtraHop system automatically detects weak cipher suites. CBC, DES, 3DES, RC4, null, anonymous, and export cipher suites are considered to be weak because they include an encryption algorithm that is known to be vulnerable. Data encrypted with a weak cipher suite is potentially insecure. Here is an example of a weak cipher suite: TLS_ECDH_anon_WITH_RC4_128_SHA
The following cipher suite algorithms are considered weak:Cipher Block Chaining (CBC): This algorithm has multiple known vulnerabilities, including those related to the Lucky Thirteen (CVE-2013-0169), POODLE (CVE-2014-3566), and BEAST (CVE-2011-3389) attacks.
Data Encryption Standard (DES): This algorithm is considered insecure because the 56-bit key is too small.
Triple Data Encryption Algorithm (3DES): This algorithm has a known vulnerability (CVE-2016-2183).
Rivest Cipher 4 (RC4): This algorithm is considered insecure because of biases in the RC4 keystream that can be exploited.
null: This value indicates that no encryption algorithm is applied to the data.
anon: This value indicates that no authentication is applied to the data.
export: This algorithm was intentionally designed to be weak to meet previous United States export laws.
Post Quantum Sessions The number of encrypted TLS sessions associated with this application established with post-quantum cryptography (PQC) algorithms. PQC is designed to resist attacks from quantum computers.
TLS Session Details
The following charts are available in this region:
- Top Versions
- This chart shows which versions of the TLS protocol the application communicated over
the most by breaking out the total number of TLS sessions the application participated
in by protocol version.
Metric Description Sessions by Version The number of times a session associated with this application included a particular TLS version. - Top Key Agreement Types
- This chart shows which key agreement types were the most commonly associated with TLS
connections established by this application.
Metric Description Key Agreement by Key Agreement The number of encrypted TLS sessions established with a key agreement that were associated with this application, listed by the key agreement or key exchange. - Top Alerts
- This chart shows which TLS alert types the application sent or received the most by
breaking out the number of alerts by type.
Metric Description Alerts by Type The number of TLS alerts transferred during the TLS handshake or decrypted session, broken down by type. Each alert type provides information about the warning or fatal error conditions that occurred. Depending on when a fatal error occurs, the session or handshake cannot continue and the sessions ends.
TLS Certificate Details
The following charts are available in this region:
- Top Certificates
- This chart shows the top certificates sent to the application by breaking out the
total number of connected TLS sessions by certificate.
Metric Description Connected Sessions The number of established secure connections associated with this application due to a completed TLS handshake. - Top Domains (SNI)
- This chart shows which domains the SSL client wanted to connect to during the TLS
handshake negotiation.
Metric Description Connected Sessions by SNI The number of established secure connections due to a completed TLS handshake, listed by the hostname that the client wants to connect to. The client sends the hostname during the TLS handshake negotiation as part of the Server Name Indication (SNI) TLS extension. - Top Cipher Suites
- This chart shows which cipher suites the application encrypted data with the most by
breaking out the number of TLS sessions the application participated in by cipher
suite.
Metric Description Sessions by Cipher Suite The number of times a given TLS cipher suite was negotiated.
TLS Performance
The following charts are available in this region:
- Round Trip Time
- This chart shows percentiles of round trip time (RTT). The RTT metric measures how
long it took for packets to get an immediate acknowledgment from the client or server.
Therefore, RTT is a good indicator of how your network is performing.
Learn more about how the ExtraHop system calculates round trip time on the ExtraHop blog.
Metric Description Round Trip Time The time between when an TLS client or server sent a packet requiring immediate acknowledgment and when the acknowledgment was received. - Round Trip Time
- This chart shows the median for RTT, measured in milliseconds.
Metric Description Round Trip Time The time between when an TLS client or server sent a packet requiring immediate acknowledgment and when the acknowledgment was received.
Network Data
This region shows you TCP information that is related to the current protocol. In general, host stalls indicate that there is an issue with either a server or a client, and network stalls indicate that there is an issue with the network.
- Host Stalls
-
This chart shows the number of zero windows that were
associated with an application. Devices control the amount of data they receive by
specifying the number of packets that can be sent to them over a given time period.
When a device is sent more data than it can process, the device advertises a zero
window to ask its peer device to stop sending packets completely until the device
catches up. If you see a large number of zero windows, a server or client might not be
not fast enough to support the amount of data being received.
Metric Definition Request Zero Windows The number of zero window advertisements sent by TLS clients. A device advertises a Zero Window when incoming data is arriving too quickly to be processed. A large number of incoming Zero Windows indicates that a peer device was too slow to process the amount of data received.
Response Zero Windows The number of zero window advertisements sent by servers while receiving TLS requests. A device advertises a Zero Window when incoming data is arriving too quickly to be processed. A large number of outgoing Zero Windows indicates that a client was too slow to process the amount of data received.
- Total Host Stalls
- This chart shows the median number of zero window advertisements sent by devices.
- Network Stalls
-
This chart shows the number of retransmission
timeouts that occurred. Retransmission timeouts (RTOs) occur when a network drops too
many packets, usually due to packet collisions or buffer exhaustion. If a device sends
a request or response and does not receive confirmation within a specified amount of
time, the device retransmits the request. If too many retransmissions are
unacknowledged, an RTO occurs. If you see a large number of RTOs, the network might be
too slow to support the current level of activity.
Metric Definition RTOs In The number of retransmission timeouts caused by congestion when clients were sending TLS requests. An RTO is a 1-5 second stall in the TCP connection flow due to excessive retransmissions. If you see a large number of incoming RTOs, a device did not send an acknowledgment to the server quickly enough, or the network might be too slow to support the current level of activity. Depending on the timeout value configured in the operating system, this delay can be anywhere from 1 to 8 seconds.
RTOs Out The number of retransmission timeouts caused by congestion when servers were sending TLS responses. An RTO is a 1-5 second stall in the TCP connection flow due to excessive retransmissions. If you see a large number of outgoing RTOs, a device did not receive an acknowledgment from the server quickly enough, or the network might be too slow to support the current level of activity. Depending on the timeout value configured in the operating system, this delay can be anywhere from 1 to 8 seconds.
- Total Network Stalls
-
This chart shows the median number of
retransmission timeouts caused by congestion when clients and servers were sending
requests.
Metric Definition RTOs In The number of retransmission timeouts caused by congestion when clients were sending TLS requests. An RTO is a 1-5 second stall in the TCP connection flow due to excessive retransmissions. If you see a large number of incoming RTOs, a device did not send an acknowledgment to the server quickly enough, or the network might be too slow to support the current level of activity. Depending on the timeout value configured in the operating system, this delay can be anywhere from 1 to 8 seconds.
RTOs Out The number of retransmission timeouts caused by congestion when servers were sending TLS responses. An RTO is a 1-5 second stall in the TCP connection flow due to excessive retransmissions. If you see a large number of outgoing RTOs, a device did not receive an acknowledgment from the server quickly enough, or the network might be too slow to support the current level of activity. Depending on the timeout value configured in the operating system, this delay can be anywhere from 1 to 8 seconds.
TLS Metric Totals
The following charts are available in this region:
- Sessions
-
Metric Description Connected Sessions The number of established secure connections associated with this application due to a completed TLS handshake. Decrypted Sessions The number of encrypted TLS sessions associated with this application for which the ExtraHop system had the necessary information to decrypt the session. Resumed Sessions The number of times an TLS session was resumed over a new connection with the original session ID or ticket. Aborted Sessions The number of attempted TLS sessions that did not proceed past the TLS handshake. No data was exchanged between devices after the handshake. If the number of aborted sessions is high, look at the TLS Alerts by Type metric to determine which errors occurred, such as problems with the certificate. Weak Ciphers The number of sessions associated with this application that were negotiated with a weak cipher suite. The ExtraHop system automatically detects weak cipher suites. CBC, DES, 3DES, RC4, null, anonymous, and export cipher suites are considered to be weak because they include an encryption algorithm that is known to be vulnerable. Data encrypted with a weak cipher suite is potentially insecure. Here is an example of a weak cipher suite: TLS_ECDH_anon_WITH_RC4_128_SHA
The following cipher suite algorithms are considered weak:Cipher Block Chaining (CBC): This algorithm has multiple known vulnerabilities, including those related to the Lucky Thirteen (CVE-2013-0169), POODLE (CVE-2014-3566), and BEAST (CVE-2011-3389) attacks.
Data Encryption Standard (DES): This algorithm is considered insecure because the 56-bit key is too small.
Triple Data Encryption Algorithm (3DES): This algorithm has a known vulnerability (CVE-2016-2183).
Rivest Cipher 4 (RC4): This algorithm is considered insecure because of biases in the RC4 keystream that can be exploited.
null: This value indicates that no encryption algorithm is applied to the data.
anon: This value indicates that no authentication is applied to the data.
export: This algorithm was intentionally designed to be weak to meet previous United States export laws.
Renegotiated Sessions The number of times an TLS session associated with this application was renegotiated. Extended Master Secret The number of TLS sessions with an extended master secret. SSLv2 Compatible Sessions The number of TLS sessions for which the private key was available, enabling their decryption. Self-signed Certificates The number of TLS sessions associated with this application that included self-signed certificates. A self-signed certificate is signed with its own private key. Post Quantum Sessions The number of encrypted TLS sessions associated with this application established with post-quantum cryptography (PQC) algorithms. PQC is designed to resist attacks from quantum computers. - TLS Network Metrics
-
Metric Description Request Zero Windows The number of zero window advertisements sent by TLS clients. A device advertises a Zero Window when incoming data is arriving too quickly to be processed. Response Zero Windows The number of zero window advertisements sent by servers while receiving TLS requests. A device advertises a Zero Window when incoming data is arriving too quickly to be processed. Request RTOs The number of retransmission timeouts caused by congestion when clients were sending TLS requests. An RTO is a 1-5 second stall in the TCP connection flow due to excessive retransmissions. Response RTOs The number of retransmission timeouts caused by congestion when servers were sending TLS responses. An RTO is a 1-5 second stall in the TCP connection flow due to excessive retransmissions. Request L2 Bytes The number of L2 bytes associated with TLS requests. Response L2 Bytes The number of L2 bytes associated with TLS responses. Request Goodput Bytes The number of Goodput Bytes associated with TLS requests. Goodput refers to the throughput of the original data transferred and excludes other throughput such as protocol headers or retransmitted packets. Response Goodput Bytes The number of Goodput Bytes associated with TLS responses. Goodput refers to the throughput of the original data transferred and excludes other throughput such as protocol headers or retransmitted packets. Request Packets The number of packets associated with TLS requests. Response Packets The number of packets associated with TLS responses.
TLS client page
This page displays metric charts of TLS traffic associated with a device on your network.
- Learn about charts on this page:
- Learn about TLS security considerations
- Learn about working with metrics.
TLS Summary
The following charts are available in this region:
- Sessions
- This chart shows you when the client participated in TLS sessions.
Metric Description Connected Sessions The number of secure connections established by this TLS client due to a completed TLS handshake. Decrypted Sessions The number of encrypted sessions associated with this TLS client for which the ExtraHop system had the necessary information to decrypt the session. Resumed Sessions The number of times a session was resumed over a new connection with this TLS client by reusing the original session ID or ticket. Aborted Sessions The number of attempted TLS sessions that did not proceed past the TLS handshake or result in a connection. No data was exchanged between devices. If the number of aborted sessions is high, look at the TLS Alerts by Type metric to determine which errors occurred. Post Quantum Sessions The number of encrypted sessions established by this TLS client with post-quantum cryptography (PQC) algorithms. PQC is designed to resist attacks from quantum computers. Weak Ciphers The number of sessions established by this TLS client that was negotiated with a weak cipher suite. The ExtraHop system automatically detects weak cipher suites. CBC, DES, 3DES, RC4, null, anonymous, and export cipher suites are considered to be weak because they include an encryption algorithm that is known to be vulnerable. Data encrypted with a weak cipher suite is potentially insecure. Here is an example of a weak cipher suite: TLS_ECDH_anon_WITH_RC4_128_SHA
The following cipher suite algorithms are considered weak:Cipher Block Chaining (CBC): This algorithm has multiple known vulnerabilities, including those related to the Lucky Thirteen (CVE-2013-0169), POODLE (CVE-2014-3566), and BEAST (CVE-2011-3389) attacks.
Data Encryption Standard (DES): This algorithm is considered insecure because the 56-bit key is too small.
Triple Data Encryption Algorithm (3DES): This algorithm has a known vulnerability (CVE-2016-2183).
Rivest Cipher 4 (RC4): This algorithm is considered insecure because of biases in the RC4 keystream that can be exploited.
null: This value indicates that no encryption algorithm is applied to the data.
anon: This value indicates that no authentication is applied to the data.
export: This algorithm was intentionally designed to be weak to meet previous United States export laws.
- Total Sessions
- This chart shows you how many TLS sessions the client participated in.
Metric Description Connected Sessions The number of secure connections established by this TLS client due to a completed TLS handshake. Decrypted Sessions The number of encrypted sessions associated with this TLS client for which the ExtraHop system had the necessary information to decrypt the session. Resumed Sessions The number of times a session was resumed over a new connection with this TLS client by reusing the original session ID or ticket. Aborted Sessions The number of attempted TLS sessions that did not proceed past the TLS handshake or result in a connection. No data was exchanged between devices. If the number of aborted sessions is high, look at the TLS Alerts by Type metric to determine which errors occurred. Weak Ciphers The number of sessions established by this TLS client that was negotiated with a weak cipher suite. The ExtraHop system automatically detects weak cipher suites. CBC, DES, 3DES, RC4, null, anonymous, and export cipher suites are considered to be weak because they include an encryption algorithm that is known to be vulnerable. Data encrypted with a weak cipher suite is potentially insecure. Here is an example of a weak cipher suite: TLS_ECDH_anon_WITH_RC4_128_SHA
The following cipher suite algorithms are considered weak:Cipher Block Chaining (CBC): This algorithm has multiple known vulnerabilities, including those related to the Lucky Thirteen (CVE-2013-0169), POODLE (CVE-2014-3566), and BEAST (CVE-2011-3389) attacks.
Data Encryption Standard (DES): This algorithm is considered insecure because the 56-bit key is too small.
Triple Data Encryption Algorithm (3DES): This algorithm has a known vulnerability (CVE-2016-2183).
Rivest Cipher 4 (RC4): This algorithm is considered insecure because of biases in the RC4 keystream that can be exploited.
null: This value indicates that no encryption algorithm is applied to the data.
anon: This value indicates that no authentication is applied to the data.
export: This algorithm was intentionally designed to be weak to meet previous United States export laws.
Post Quantum Sessions The number of encrypted sessions established by this TLS client with post-quantum cryptography (PQC) algorithms. PQC is designed to resist attacks from quantum computers.
TLS Session Details
The following charts are available in this region:
- Top Versions
- This chart shows how many TLS sessions took place on each TLS version and the 95th
percentile handshake time for each version.
Metric Description Sessions by Version The number of sessions associated with this TLS client, broken down by TLS protocol version used. Handshake Time by Version The time it took to negotiate the TLS handshake to establish a connection, listed by TLS version. - Top Key Agreement Types
- This chart shows which key agreement types were the most commonly associated with
connections established by this TLS client.
Metric Description Connected Sessions by Key Agreement The number of secure connections established by this TLS client due to a completed TLS handshake, listed by the key agreement or key exchange. - Handshake Time by Version
- This chart shows percentiles of handshake times listed by TLS version.
Metric Description Handshake Time by Version The time it took to negotiate the TLS handshake to establish a connection, listed by TLS version. - Top Content Types
- This chart shows which types of content the client exchanged the most by breaking out
the total number of TLS records the client exchanged by content type.
Metric Description Handshake A message from an initial exchange wherein a client and a server agreed on a protocol version, selected cryptographic algorithms, optionally authenticated each other, and used public-key encryption techniques to generate shared secrets. Application Data A message sent through TLS that is normally sent directly on top of the transport layer (for example, TCP/IP). Change Cipher A message indicating a transition in ciphering strategies. Alerts A message indicating a session had a change of status or error condition, such as a handshake failure, a bad checksum, or a certificate issue. - Top Alerts
- This chart shows which TLS alert types the client sent or received the most by
breaking out the number of alerts by type.
Metric Description Alerts by Type The number of alerts sent or received by this TLS client during the TLS handshake or decrypted session, broken down by alert type. Each alert type provides information about the warning or fatal error conditions that occurred. Depending on when a fatal error occurs, the session or handshake cannot continue and the sessions ends.
TLS Certificate Details
The following charts are available in this region:
- Top Certificates
- This chart shows the top certificates sent to the client by breaking out the total
number of connected TLS sessions by certificate.
Metric Description Connected Sessions The number of secure connections established by this TLS client due to a completed TLS handshake. - Top Domains (SNI)
- This chart shows which domains the TLS client wanted to connect to during the TLS
handshake negotiation.
Metric Description Connected Sessions by SNI The number of TLS sessions associated with this client, listed by the hostname that the client wants to connect to. The client sends the hostname during the TLS handshake negotiation as part of the Server Name Indication (SNI) TLS extension. - Top Cipher Suites
- This chart shows which cipher suites the client encrypted data with the most by
breaking out the number of TLS sessions the client participated in by cipher
suite.
Metric Description Sessions by Cipher Suite The number of sessions associated with this TLS client, broken down by the cipher suite negotiated.
TLS Performance
The following charts are available in this region:
- Round Trip Time Distribution
-
This chart breaks out round trip times in a histogram to show the
most common round trip times, measured in milliseconds.
Metric Description Round Trip Time The time between when a TLS client sent a packet that required an immediate acknowledgment and when the client received the acknowledgment. Round trip time (RTT) is a measurement of network latency. - Round Trip Time
-
This chart shows the median round trip time for the client, measured in
milliseconds.
Metric Description Round Trip Time The time between when a TLS client sent a packet that required an immediate acknowledgment and when the client received the acknowledgment. Round trip time (RTT) is a measurement of network latency.
TLS Metric Totals
The following charts are available in this region:
- Total Sessions
-
Metric Description Connected Sessions The number of secure connections established by this TLS client due to a completed TLS handshake. Decrypted Sessions The number of encrypted sessions associated with this TLS client for which the ExtraHop system had the necessary information to decrypt the session. Resumed Sessions The number of times a session was resumed over a new connection with this TLS client by reusing the original session ID or ticket. Aborted Sessions The number of attempted TLS sessions that did not proceed past the TLS handshake or result in a connection. No data was exchanged between devices. If the number of aborted sessions is high, look at the TLS Alerts by Type metric to determine which errors occurred. Weak Ciphers The number of sessions established by this TLS client that was negotiated with a weak cipher suite. The ExtraHop system automatically detects weak cipher suites. CBC, DES, 3DES, RC4, null, anonymous, and export cipher suites are considered to be weak because they include an encryption algorithm that is known to be vulnerable. Data encrypted with a weak cipher suite is potentially insecure. Here is an example of a weak cipher suite: TLS_ECDH_anon_WITH_RC4_128_SHA
The following cipher suite algorithms are considered weak:Cipher Block Chaining (CBC): This algorithm has multiple known vulnerabilities, including those related to the Lucky Thirteen (CVE-2013-0169), POODLE (CVE-2014-3566), and BEAST (CVE-2011-3389) attacks.
Data Encryption Standard (DES): This algorithm is considered insecure because the 56-bit key is too small.
Triple Data Encryption Algorithm (3DES): This algorithm has a known vulnerability (CVE-2016-2183).
Rivest Cipher 4 (RC4): This algorithm is considered insecure because of biases in the RC4 keystream that can be exploited.
null: This value indicates that no encryption algorithm is applied to the data.
anon: This value indicates that no authentication is applied to the data.
export: This algorithm was intentionally designed to be weak to meet previous United States export laws.
Renegotiated Sessions The number of times an TLS session was renegotiated with this TLS client. Sessions with Extended Master Secret When the device is acting as an TLS client, the number of sessions that use extended master secret. SSLv2 Compatible Sessions When the device is acting as an TLS client, the number of times an TLSv2-compatible hello was sent. Self-signed Certificates The number of TLS sessions associated with this client that included self-signed certificates. A self-signed certificate is signed with its own private key. Post Quantum Sessions The number of encrypted sessions established by this TLS client with post-quantum cryptography (PQC) algorithms. PQC is designed to resist attacks from quantum computers. - Record Size
-
Metric Description Record Size The distribution of sizes of TLS records (in bytes) exchanged when the device is acting as an TLS client.
TLS server page
This page displays metric charts of TLS traffic associated with a device on your network.
- Learn about charts on this page:
- Learn about TLS security considerations
- Learn about working with metrics.
TLS Summary
The following charts are available in this region:
- Sessions
- This chart shows you how many TLS sessions the client participated in.
Metric Description Connected Sessions The number of secure connections established by this TLS server due to a completed TLS handshake. Decrypted Sessions The number of encrypted sessions associated with this TLS server for which the ExtraHop system had the necessary information to decrypt the session. Resumed Sessions The number of times a session was resumed over a new connection with this TLS server by reusing the original session ID or ticket. Aborted Sessions The number of attempted TLS sessions that did not proceed past the TLS handshake or result in a connection. No data was exchanged between devices. If the number of aborted sessions is high, look at the TLS Alerts by Type metric to determine which errors occurred. Post Quantum Sessions The number of encrypted sessions established by this TLS server with post-quantum cryptography (PQC) algorithms. PQC is designed to resist attacks from quantum computers. Weak Ciphers The number of sessions established by this TLS server that was negotiated with a weak cipher suite. The ExtraHop system automatically detects weak cipher suites. CBC, DES, 3DES, RC4, null, anonymous, and export cipher suites are considered to be weak because they include an encryption algorithm that is known to be vulnerable. Data encrypted with a weak cipher suite is potentially insecure. Here is an example of a weak cipher suite: TLS_ECDH_anon_WITH_RC4_128_SHA
The following cipher suite algorithms are considered weak:Cipher Block Chaining (CBC): This algorithm has multiple known vulnerabilities, including those related to the Lucky Thirteen (CVE-2013-0169), POODLE (CVE-2014-3566), and BEAST (CVE-2011-3389) attacks.
Data Encryption Standard (DES): This algorithm is considered insecure because the 56-bit key is too small.
Triple Data Encryption Algorithm (3DES): This algorithm has a known vulnerability (CVE-2016-2183).
Rivest Cipher 4 (RC4): This algorithm is considered insecure because of biases in the RC4 keystream that can be exploited.
null: This value indicates that no encryption algorithm is applied to the data.
anon: This value indicates that no authentication is applied to the data.
export: This algorithm was intentionally designed to be weak to meet previous United States export laws.
- Total Sessions
- This chart shows you when the server participated in SSL sessions.
Metric Description Connected Sessions The number of secure connections established by this TLS server due to a completed TLS handshake. Decrypted Sessions The number of encrypted sessions associated with this TLS client for which the ExtraHop system had the necessary information to decrypt the session. Resumed Sessions The number of times a session was resumed over a new connection with this TLS server by reusing the original session ID or ticket. Aborted Sessions The number of attempted TLS sessions that did not proceed past the TLS handshake or result in a connection. No data was exchanged between devices. If the number of aborted sessions is high, look at the TLS Alerts by Type metric to determine which errors occurred. Weak Ciphers The number of sessions established by this TLS server that was negotiated with a weak cipher suite. The ExtraHop system automatically detects weak cipher suites. CBC, DES, 3DES, RC4, null, anonymous, and export cipher suites are considered to be weak because they include an encryption algorithm that is known to be vulnerable. Data encrypted with a weak cipher suite is potentially insecure. Here is an example of a weak cipher suite: TLS_ECDH_anon_WITH_RC4_128_SHA
The following cipher suite algorithms are considered weak:Cipher Block Chaining (CBC): This algorithm has multiple known vulnerabilities, including those related to the Lucky Thirteen (CVE-2013-0169), POODLE (CVE-2014-3566), and BEAST (CVE-2011-3389) attacks.
Data Encryption Standard (DES): This algorithm is considered insecure because the 56-bit key is too small.
Triple Data Encryption Algorithm (3DES): This algorithm has a known vulnerability (CVE-2016-2183).
Rivest Cipher 4 (RC4): This algorithm is considered insecure because of biases in the RC4 keystream that can be exploited.
null: This value indicates that no encryption algorithm is applied to the data.
anon: This value indicates that no authentication is applied to the data.
export: This algorithm was intentionally designed to be weak to meet previous United States export laws.
Post Quantum Sessions The number of encrypted sessions established by this TLS server with post-quantum cryptography (PQC) algorithms. PQC is designed to resist attacks from quantum computers.
TLS Session Details
The following charts are available in this region:
- Top Versions
- This chart shows how many TLS sessions took place on each TLS version and the 95th
percentile handshake time for each version.
Metric Description Sessions by Version The number of sessions associated with this TLS server, broken down by TLS protocol version used. Handshake Time by Version The time it took to negotiate the TLS handshake to establish a connection, listed by TLS version. - Top Key Agreement Types
- This chart shows which key agreement types were the most commonly associated with
connections established with this TLS server.
Metric Description Connected Sessions by Key Agreement The number of secure connections established by this TLS server due to a completed TLS handshake, listed by the key agreement or key exchange and the IP address of the client. - Handshake Time by Version
- This chart shows percentiles of handshake times listed by TLS version.
Metric Description Handshake Time by Version The time it took to negotiate the TLS handshake to establish a connection, listed by TLS version. - Top Content Types
- This chart shows which types of content the server exchanged the most by breaking out
the total number of TLS records the server exchanged by content type.
Metric Description Handshake A message from an initial exchange wherein a client and a server agreed on a protocol version, selected cryptographic algorithms, optionally authenticated each other, and used public-key encryption techniques to generate shared secrets. Application Data A message sent via TLS that is normally sent directly on top of the transport layer (for example, TCP/IP). Change Cipher A message indicating a transition in ciphering strategies. Alerts A message indicating a session had a change of status or error condition, such as a handshake failure, a bad checksum, or a certificate issue. - Top Alerts
- This chart shows which TLS alert types the server sent or received the most by
breaking out the number of alerts by type.
Metric Description Alerts by Type The number of alerts sent or received by this TLS server during the TLS handshake or decrypted session, broken down by alert type. Each alert type provides information about the warning or fatal error conditions that occurred. Depending on when a fatal error occurs, the session or handshake cannot continue and the sessions ends.
TLS Certificate Details
The following charts are available in this region:
- Top Certificates
- This chart shows the top certificates the server sent by breaking out the total number
of connected TLS sessions by certificate.
Metric Description Connected Sessions The number of secure connections established by this TLS server due to a completed TLS handshake. - Top Domains (SNI)
- This chart shows which domains the TLS clients wanted to connect to during the TLS
handshake negotiation.
Metric Description Connected Sessions by SNI The number of TLS sessions associated with this server, listed by the hostname that the client wants to connect to. The client sends the hostname during the TLS handshake negotiation as part of the Server Name Indication (SNI) TLS extension. - Top Cipher Suites
- This chart shows which cipher suites the server encrypted data with the most by
breaking out the number of TLS sessions the server participated in by cipher
suite.
Metric Description Sessions by Cipher Suite The number of sessions associated with this TLS server, broken down by the cipher suite negotiated.
TLS Performance
The following charts are available in this region:
- Round Trip Time Distribution
-
This chart breaks out round trip times in a histogram to show the
most common round trip times, measured in milliseconds.
Metric Description Round Trip Time The time between when a TLS server sent a packet that required an immediate acknowledgment and when the server received the acknowledgment. Round trip time (RTT) is a measurement of network latency. - Round Trip Time
-
This chart shows the median round trip time for the client, measured in
milliseconds.
Metric Description Round Trip Time The time between when a TLS server sent a packet that required an immediate acknowledgment and when the server received the acknowledgment. Round trip time (RTT) is a measurement of network latency.
TLS Metric Totals
The following charts are available in this region:
- Total Sessions
-
Metric Description Connected Sessions The number of secure connections established by this TLS server due to a completed TLS handshake. Decrypted Sessions The number of encrypted sessions associated with this TLS server for which the ExtraHop system had the necessary information to decrypt the session. Resumed Sessions The number of times a session was resumed over a new connection with this TLS server by reusing the original session ID or ticket. Aborted Sessions The number of attempted TLS sessions that did not proceed past the TLS handshake or result in a connection. No data was exchanged between devices. If the number of aborted sessions is high, look at the TLS Alerts by Type metric to determine which errors occurred. Weak Ciphers The number of sessions established by this TLS server that was negotiated with a weak cipher suite. The ExtraHop system automatically detects weak cipher suites. CBC, DES, 3DES, RC4, null, anonymous, and export cipher suites are considered to be weak because they include an encryption algorithm that is known to be vulnerable. Data encrypted with a weak cipher suite is potentially insecure. Here is an example of a weak cipher suite: TLS_ECDH_anon_WITH_RC4_128_SHA
The following cipher suite algorithms are considered weak:Cipher Block Chaining (CBC): This algorithm has multiple known vulnerabilities, including those related to the Lucky Thirteen (CVE-2013-0169), POODLE (CVE-2014-3566), and BEAST (CVE-2011-3389) attacks.
Data Encryption Standard (DES): This algorithm is considered insecure because the 56-bit key is too small.
Triple Data Encryption Algorithm (3DES): This algorithm has a known vulnerability (CVE-2016-2183).
Rivest Cipher 4 (RC4): This algorithm is considered insecure because of biases in the RC4 keystream that can be exploited.
null: This value indicates that no encryption algorithm is applied to the data.
anon: This value indicates that no authentication is applied to the data.
export: This algorithm was intentionally designed to be weak to meet previous United States export laws.
Renegotiated Sessions The number of times an TLS session was renegotiated with this TLS server. Sessions with Extended Master Secret When the device is acting as an TLS server, the number of sessions that use extended master secret. SSLv2 Compatible Sessions When the device is acting as an TLS server, the number of times an TLSv2-compatible hello was sent by the client. Self-signed Certificates The number of TLS sessions associated with this server that included self-signed certificates. A self-signed certificate is signed with its own private key. Post Quantum Sessions The number of encrypted sessions established by this TLS server with post-quantum cryptography (PQC) algorithms. PQC is designed to resist attacks from quantum computers. - Record Size
-
Metric Description Record Size The distribution of sizes of TLS records (in bytes) exchanged when the device is acting as an TLS server.
TLS client group page
This page displays metric charts of TLS traffic associated with a device group on your network.
- Learn about charts on this page:
- Learn about TLS security considerations
- Learn about working with metrics.
TLS Summary for Group
The following charts are available in this region:
- Sessions
- This chart shows you when the clients in the group participated in TLS sessions.
Metric Description Connected Sessions The number of secure connections established by this TLS client due to a completed TLS handshake. Decrypted Sessions The number of encrypted sessions associated with this TLS client for which the ExtraHop system had the necessary information to decrypt the session. Resumed Sessions The number of times a session was resumed over a new connection with this TLS client by reusing the original session ID or ticket. Aborted Sessions The number of attempted TLS sessions that did not proceed past the TLS handshake or result in a connection. No data was exchanged between devices. If the number of aborted sessions is high, look at the TLS Alerts by Type metric to determine which errors occurred. Post Quantum Sessions The number of encrypted sessions established by this TLS client with post-quantum cryptography (PQC) algorithms. PQC is designed to resist attacks from quantum computers. Weak Ciphers The number of sessions established by this TLS client that was negotiated with a weak cipher suite. The ExtraHop system automatically detects weak cipher suites. CBC, DES, 3DES, RC4, null, anonymous, and export cipher suites are considered to be weak because they include an encryption algorithm that is known to be vulnerable. Data encrypted with a weak cipher suite is potentially insecure. Here is an example of a weak cipher suite: TLS_ECDH_anon_WITH_RC4_128_SHA
The following cipher suite algorithms are considered weak:Cipher Block Chaining (CBC): This algorithm has multiple known vulnerabilities, including those related to the Lucky Thirteen (CVE-2013-0169), POODLE (CVE-2014-3566), and BEAST (CVE-2011-3389) attacks.
Data Encryption Standard (DES): This algorithm is considered insecure because the 56-bit key is too small.
Triple Data Encryption Algorithm (3DES): This algorithm has a known vulnerability (CVE-2016-2183).
Rivest Cipher 4 (RC4): This algorithm is considered insecure because of biases in the RC4 keystream that can be exploited.
null: This value indicates that no encryption algorithm is applied to the data.
anon: This value indicates that no authentication is applied to the data.
export: This algorithm was intentionally designed to be weak to meet previous United States export laws.
- Total Sessions
- This chart shows you how many TLS sessions the clients in the group participated
in.
Metric Description Connected Sessions The number of secure connections established by this TLS client due to a completed TLS handshake. Decrypted Sessions The number of encrypted sessions associated with this TLS client for which the ExtraHop system had the necessary information to decrypt the session. Resumed Sessions The number of times a session was resumed over a new connection with this TLS client by reusing the original session ID or ticket. Aborted Sessions The number of attempted TLS sessions that did not proceed past the TLS handshake or result in a connection. No data was exchanged between devices. If the number of aborted sessions is high, look at the TLS Alerts by Type metric to determine which errors occurred. Weak Ciphers The number of sessions established by this TLS client that was negotiated with a weak cipher suite. The ExtraHop system automatically detects weak cipher suites. CBC, DES, 3DES, RC4, null, anonymous, and export cipher suites are considered to be weak because they include an encryption algorithm that is known to be vulnerable. Data encrypted with a weak cipher suite is potentially insecure. Here is an example of a weak cipher suite: TLS_ECDH_anon_WITH_RC4_128_SHA
The following cipher suite algorithms are considered weak:Cipher Block Chaining (CBC): This algorithm has multiple known vulnerabilities, including those related to the Lucky Thirteen (CVE-2013-0169), POODLE (CVE-2014-3566), and BEAST (CVE-2011-3389) attacks.
Data Encryption Standard (DES): This algorithm is considered insecure because the 56-bit key is too small.
Triple Data Encryption Algorithm (3DES): This algorithm has a known vulnerability (CVE-2016-2183).
Rivest Cipher 4 (RC4): This algorithm is considered insecure because of biases in the RC4 keystream that can be exploited.
null: This value indicates that no encryption algorithm is applied to the data.
anon: This value indicates that no authentication is applied to the data.
export: This algorithm was intentionally designed to be weak to meet previous United States export laws.
Post Quantum Sessions The number of encrypted sessions established by this TLS client with post-quantum cryptography (PQC) algorithms. PQC is designed to resist attacks from quantum computers.
TLS Session Details
The following charts are available in this region:
- Top Group Members (SSL Clients)
- This chart shows which TLS clients in the group were most active by breaking out the
total number of connected TLS sessions the group participated in by client.
Metric Description Connected SSL Sessions The number of secure connections established by this TLS client due to a completed TLS handshake. - Top Key Agreement Types
- This chart shows which key agreement types were the most commonly associated with
connections established by this TLS client group.
Metric Description Connected Sessions by Key Agreement The number of secure connections established by this TLS client due to a completed TLS handshake, listed by the key agreement or key exchange. - Top Versions
- This chart shows how many TLS sessions took place on each TLS version and the 95th
percentile handshake time for each version.
Metric Description Sessions by Version The number of sessions associated with this TLS client, broken down by TLS protocol version used. Handshake Time by Version The time it took to negotiate the TLS handshake to establish a connection, listed by TLS version. - Top Content Types
- This chart shows which types of content the group exchanged the most by breaking out
the total number of TLS records the group exchanged by content type.
Metric Description Handshake A message from an initial exchange wherein a client and a server agreed on a protocol version, selected cryptographic algorithms, optionally authenticated each other, and used public-key encryption techniques to generate shared secrets. Application Data A message sent via TLS that is normally sent directly on top of the transport layer (for example, TCP/IP). Change Cipher A message indicating a transition in ciphering strategies. Alerts A message indicating a session had a change of status or error condition, such as a handshake failure, a bad checksum, or a certificate issue. - Top Alerts
- This chart shows which TLS alert types the group sent or received the most by breaking
out the number of alerts by type.
Metric Description Alerts by Type The number of alerts sent or received by this TLS client during the TLS handshake or decrypted session, broken down by alert type. Each alert type provides information about the warning or fatal error conditions that occurred. Depending on when a fatal error occurs, the session or handshake cannot continue and the sessions ends.
TLS Certificate Details
The following charts are available in this region:
- Top Cipher Suites
- This chart shows which cipher suites the group encrypted data with the most by
breaking out the number of TLS sessions the group participated in by cipher suite.
Metric Description Sessions by Cipher Suite The number of sessions associated with this TLS client, broken down by the cipher suite negotiated. - Top Certificates
- This chart shows the top certificates sent to the group by breaking out the total
number of connected TLS sessions by certificate.
Metric Description Connected Sessions The number of secure connections established by this TLS client due to a completed TLS handshake. - Certificate Expirations
- This chart shows the expiration dates of certificates sent to the group.
Metric Description SSL Certificate Expirations The expiration date of the certificates presented by peer servers to this TLS client during session negotiations.
TLS Metrics for Group
The following charts are available in this region:
- Total Sessions
-
Metric Description Connected Sessions The number of secure connections established by this TLS client due to a completed TLS handshake. Decrypted Sessions The number of encrypted sessions associated with this TLS client for which the ExtraHop system had the necessary information to decrypt the session. Resumed Sessions The number of times a session was resumed over a new connection with this TLS client by reusing the original session ID or ticket. Aborted Sessions The number of attempted TLS sessions that did not proceed past the TLS handshake or result in a connection. No data was exchanged between devices. If the number of aborted sessions is high, look at the TLS Alerts by Type metric to determine which errors occurred. Weak Ciphers The number of sessions established by this TLS client that was negotiated with a weak cipher suite. The ExtraHop system automatically detects weak cipher suites. CBC, DES, 3DES, RC4, null, anonymous, and export cipher suites are considered to be weak because they include an encryption algorithm that is known to be vulnerable. Data encrypted with a weak cipher suite is potentially insecure. Here is an example of a weak cipher suite: TLS_ECDH_anon_WITH_RC4_128_SHA
The following cipher suite algorithms are considered weak:Cipher Block Chaining (CBC): This algorithm has multiple known vulnerabilities, including those related to the Lucky Thirteen (CVE-2013-0169), POODLE (CVE-2014-3566), and BEAST (CVE-2011-3389) attacks.
Data Encryption Standard (DES): This algorithm is considered insecure because the 56-bit key is too small.
Triple Data Encryption Algorithm (3DES): This algorithm has a known vulnerability (CVE-2016-2183).
Rivest Cipher 4 (RC4): This algorithm is considered insecure because of biases in the RC4 keystream that can be exploited.
null: This value indicates that no encryption algorithm is applied to the data.
anon: This value indicates that no authentication is applied to the data.
export: This algorithm was intentionally designed to be weak to meet previous United States export laws.
Renegotiated Sessions The number of times an TLS session was renegotiated with this TLS client. Sessions with Extended Master Secret When the device is acting as an TLS client, the number of sessions that use extended master secret. SSLv2 Compatible Sessions When the device is acting as an TLS client, the number of times an TLSv2-compatible hello was sent. Self-signed Certificates The number of TLS sessions associated with this client that included self-signed certificates. A self-signed certificate is signed with its own private key. Post Quantum Sessions The number of encrypted sessions established by this TLS client with post-quantum cryptography (PQC) algorithms. PQC is designed to resist attacks from quantum computers. - Record Size
-
Metric Description Record Size The distribution of sizes of TLS records (in bytes) exchanged when the device is acting as an TLS client.
TLS server group page
This page displays metric charts of TLS traffic associated with a device group on your network.
- Learn about charts on this page:
- Learn about TLS security considerations
- Learn about working with metrics.
TLS Summary for Group
The following charts are available in this region:
- Total Sessions
- This chart shows you how manyTLS sessions the servers in the group participated
in.
Metric Description Connected Sessions The number of secure connections established by this TLS server due to a completed TLS handshake. Decrypted Sessions The number of encrypted sessions associated with this TLS server for which the ExtraHop system had the necessary information to decrypt the session. Resumed Sessions The number of times a session was resumed over a new connection with this TLS server by reusing the original session ID or ticket. Aborted Sessions The number of attempted TLS sessions that did not proceed past the TLS handshake or result in a connection. No data was exchanged between devices. If the number of aborted sessions is high, look at the TLS Alerts by Type metric to determine which errors occurred. Post Quantum Sessions The number of encrypted sessions established by this TLS server with post-quantum cryptography (PQC) algorithms. PQC is designed to resist attacks from quantum computers. Weak Ciphers The number of sessions established by this TLS server that was negotiated with a weak cipher suite. The ExtraHop system automatically detects weak cipher suites. CBC, DES, 3DES, RC4, null, anonymous, and export cipher suites are considered to be weak because they include an encryption algorithm that is known to be vulnerable. Data encrypted with a weak cipher suite is potentially insecure. Here is an example of a weak cipher suite: TLS_ECDH_anon_WITH_RC4_128_SHA
The following cipher suite algorithms are considered weak:Cipher Block Chaining (CBC): This algorithm has multiple known vulnerabilities, including those related to the Lucky Thirteen (CVE-2013-0169), POODLE (CVE-2014-3566), and BEAST (CVE-2011-3389) attacks.
Data Encryption Standard (DES): This algorithm is considered insecure because the 56-bit key is too small.
Triple Data Encryption Algorithm (3DES): This algorithm has a known vulnerability (CVE-2016-2183).
Rivest Cipher 4 (RC4): This algorithm is considered insecure because of biases in the RC4 keystream that can be exploited.
null: This value indicates that no encryption algorithm is applied to the data.
anon: This value indicates that no authentication is applied to the data.
export: This algorithm was intentionally designed to be weak to meet previous United States export laws.
- Sessions
- This chart shows you when servers in the group participated in TLS sessions.
Metric Description Connected Sessions The number of secure connections established by this TLS server due to a completed TLS handshake. Decrypted Sessions The number of encrypted sessions associated with this TLS server for which the ExtraHop system had the necessary information to decrypt the session. Resumed Sessions The number of times a session was resumed over a new connection with this TLS server by reusing the original session ID or ticket. Aborted Sessions The number of attempted TLS sessions that did not proceed past the TLS handshake or result in a connection. No data was exchanged between devices. If the number of aborted sessions is high, look at the TLS Alerts by Type metric to determine which errors occurred. Weak Ciphers The number of sessions established by this TLS server that was negotiated with a weak cipher suite. The ExtraHop system automatically detects weak cipher suites. CBC, DES, 3DES, RC4, null, anonymous, and export cipher suites are considered to be weak because they include an encryption algorithm that is known to be vulnerable. Data encrypted with a weak cipher suite is potentially insecure. Here is an example of a weak cipher suite: TLS_ECDH_anon_WITH_RC4_128_SHA
The following cipher suite algorithms are considered weak:Cipher Block Chaining (CBC): This algorithm has multiple known vulnerabilities, including those related to the Lucky Thirteen (CVE-2013-0169), POODLE (CVE-2014-3566), and BEAST (CVE-2011-3389) attacks.
Data Encryption Standard (DES): This algorithm is considered insecure because the 56-bit key is too small.
Triple Data Encryption Algorithm (3DES): This algorithm has a known vulnerability (CVE-2016-2183).
Rivest Cipher 4 (RC4): This algorithm is considered insecure because of biases in the RC4 keystream that can be exploited.
null: This value indicates that no encryption algorithm is applied to the data.
anon: This value indicates that no authentication is applied to the data.
export: This algorithm was intentionally designed to be weak to meet previous United States export laws.
Post Quantum Sessions The number of encrypted sessions established by this TLS server with post-quantum cryptography (PQC) algorithms. PQC is designed to resist attacks from quantum computers.
SSL/TLS Session Details for Group
The following charts are available in this region:
- Top Group Members (TLS Servers)
- This chart shows which TLS servers in the group were most active by breaking out the
total number of connected TLS sessions the group participated in by server.
Metric Description Connected SSL Sessions The number of secure connections established by this TLS client due to a completed TLS handshake. - Top Key Agreement Types
- This chart shows which key agreement types were the most commonly associated with
connections established with this TLS server group.
Metric Description Connected Sessions by Key Agreement The number of secure connections established by this TLS server due to a completed TLS handshake, listed by the key agreement or key exchange and the IP address of the client. - Top Versions
- This chart shows how many TLS sessions took place on each TLS version and the 95th
percentile handshake time for each version.
Metric Description SSL Server Sessions by Version The number of sessions associated with this TLS server, broken down by TLS protocol version used. SSL Handshake Time by Version The time it took to negotiate the TLS handshake to establish a connection, listed by TLS version. - Top Content Types
- This chart shows which types of content the group exchanged the most by breaking out
the total number of TLS records the group exchanged by content type.
Metric Description Handshake A message from an initial exchange wherein a client and a server agreed on a protocol version, selected cryptographic algorithms, optionally authenticated each other, and used public-key encryption techniques to generate shared secrets. Application Data A message sent via TLS that is normally sent directly on top of the transport layer (for example, TCP/IP). Change Cipher A message indicating a transition in ciphering strategies. Alerts A message indicating a session had a change of status or error condition, such as a handshake failure, a bad checksum, or a certificate issue. - Top Alerts
- This chart shows which TLS alert types the group sent or received the most by breaking
out the number of alerts by type.
Metric Description SSL Client Alerts by Type The number of alerts sent or received by this TLS server during the TLS handshake or decrypted session, broken down by alert type. Each alert type provides information about the warning or fatal error conditions that occurred. Depending on when a fatal error occurs, the session or handshake cannot continue and the sessions ends.
TLS Certificate Details
The following charts are available in this region:
- Top Cipher Suites
- This chart shows which cipher suites the group encrypted data with the most by
breaking out the number of TLS sessions the group participated in by cipher suite.
Metric Description SSL Client Sessions by Cipher Suite The number of sessions associated with this TLS server, broken down by the cipher suite negotiated. - Top Certificates
- This chart shows the top certificates the group sent by breaking out the total number
of connected TLS sessions by certificate.
Metric Description SSL Server Connected Sessions The number of secure connections established by this TLS server due to a completed TLS handshake. - Certificate Expirations
- This chart shows the expiration dates of certificates sent by the group.
Metric Description SSL Certificate Expirations The expiration date of the certificates presented by this TLS server to clients during session negotiations.
TLS Metrics for Group
The following charts are available in this region:
- Total Sessions
-
Metric Description Connected Sessions The number of secure connections established by this TLS server due to a completed TLS handshake. Decrypted Sessions The number of encrypted sessions associated with this TLS server for which the ExtraHop system had the necessary information to decrypt the session. Resumed Sessions The number of times a session was resumed over a new connection with this TLS server by reusing the original session ID or ticket. Aborted Sessions The number of attempted TLS sessions that did not proceed past the TLS handshake or result in a connection. No data was exchanged between devices. If the number of aborted sessions is high, look at the TLS Alerts by Type metric to determine which errors occurred. Weak Ciphers The number of sessions established by this TLS server that was negotiated with a weak cipher suite. The ExtraHop system automatically detects weak cipher suites. CBC, DES, 3DES, RC4, null, anonymous, and export cipher suites are considered to be weak because they include an encryption algorithm that is known to be vulnerable. Data encrypted with a weak cipher suite is potentially insecure. Here is an example of a weak cipher suite: TLS_ECDH_anon_WITH_RC4_128_SHA
The following cipher suite algorithms are considered weak:Cipher Block Chaining (CBC): This algorithm has multiple known vulnerabilities, including those related to the Lucky Thirteen (CVE-2013-0169), POODLE (CVE-2014-3566), and BEAST (CVE-2011-3389) attacks.
Data Encryption Standard (DES): This algorithm is considered insecure because the 56-bit key is too small.
Triple Data Encryption Algorithm (3DES): This algorithm has a known vulnerability (CVE-2016-2183).
Rivest Cipher 4 (RC4): This algorithm is considered insecure because of biases in the RC4 keystream that can be exploited.
null: This value indicates that no encryption algorithm is applied to the data.
anon: This value indicates that no authentication is applied to the data.
export: This algorithm was intentionally designed to be weak to meet previous United States export laws.
Renegotiated Sessions The number of times an TLS session was renegotiated with this TLS server. Sessions with Extended Master Secret When the device is acting as an TLS server, the number of sessions that use extended master secret. SSLv2 Compatible Sessions When the device is acting as an TLS server, the number of times an TLSv2-compatible hello was sent by the client. Self-signed Certificates The number of TLS sessions associated with this server that included self-signed certificates. A self-signed certificate is signed with its own private key. Post Quantum Sessions The number of encrypted sessions established by this TLS server with post-quantum cryptography (PQC) algorithms. PQC is designed to resist attacks from quantum computers. - Record Size
-
Metric Description Record Size The distribution of sizes of TLS records (in bytes) exchanged when the device is acting as an TLS server.
TFTP
The ExtraHop system collects metrics about Trivial File Transfer Protocol (TFTP) activity. TFTP is a simple protocol that enables a client to transfer files to and from a remote host without user authentication. TFTP is often implemented in network booting, backing up and transferring device configuration files, and transferring firmware images.
| Note: | The ExtraHop system does not include any built-in metric pages for TFTP. However, you can view TFTP metrics by adding them to a custom page or dashboard. |
WebSocket
The ExtraHop system collects metrics about WebSocket activity. WebSocket is a protocol that provides full-duplex communication channels over a single TCP connection.
| Note: | The ExtraHop system does not include any built-in metrics for WebSocket. However, you can create triggers that record WebSocket activity in custom metrics and add them to a custom page or dashboard. |
WebSocket client page
This page displays metric charts of WebSocket traffic associated with a device on your network.
- Learn about charts on this page:
- Learn about working with metrics.
WebSocket Summary
The following charts are available in this region:
- Messages
- This chart shows you when WebSocket messages were sent and received by the
client.
Metric Description Messages Sent The number of WebSocket messages (TEXT/BINARY) sent or received during an aggregation period. Messages Received The number of WebSocket messages (TEXT/BINARY) sent or received during an aggregation period. - Total Messages
- This chart shows you how many WebSocket messages were sent and received by the
client.
Metric Description Messages Sent The number of WebSocket messages (TEXT/BINARY) sent or received during an aggregation period. Messages Received The number of WebSocket messages (TEXT/BINARY) sent or received during an aggregation period. - Round Trip Time
- This chart shows percentiles of round trip time (RTT). The RTT metric measures how
long it took for packets to get an immediate acknowledgment from the client or server,
measured in milliseconds. Therefore, RTT is a good indicator of how your network is
performing.
Learn more about how the ExtraHop system calculates round trip time on the ExtraHop blog.
Metric Description Round Trip Time The time between when a WebSocket client sent a packet that required an immediate acknowledgment and when the client received the acknowledgment. Round trip time (RTT) is a measurement of network latency. - Round Trip Time
- This chart shows the 95th percentile and median RTT, measured in milliseconds.
Metric Description Round Trip Time The time between when a WebSocket client sent a packet that required an immediate acknowledgment and when the client received the acknowledgment. Round trip time (RTT) is a measurement of network latency. The Performance (95th Percentile) chart shows the 95th percentile to show the highest value for a time period while filtering outliers; the 95th percentile is the highest value that falls below 95% of the values for a sample period. The following chart shows how displaying the 95th value, rather than the true maximum, can give a more accurate view of the data:
Network Data
This region shows you TCP information that is related to the current protocol. In general, host stalls indicate that there is an issue with either the server or the client, and network stalls indicate that there is an issue with the network.
- Host Stalls
- This chart shows the number of zero windows that were advertised or received by the
device. Devices control the amount of data they receive by specifying the number of
packets that can be sent to them over a given time period. When a device is sent more
data than it can process, the device advertises a zero window to ask its peer device to
stop sending packets completely until the device catches up. If you see a large number
of zero windows, a server or client might not be not fast enough to support the amount
of data being received.
Metric Definition Zero Windows In The number of zero windows that were sent to the device to stop the flow of data over the connection. A device advertises a Zero Window when incoming data is arriving too quickly to be processed. A large number of zero windows in indicates that a peer device was too slow to process the amount of data received.
Zero Windows Out The number of zero windows that were sent from the device to stop the flow of data. A device advertises a Zero Window when incoming data is arriving too quickly to be processed. A large number of zero windows out indicates that the client was too slow to process the amount of data received.
- Network Stalls
-
This chart shows the number of retransmission timeouts that occurred. Retransmission timeouts (RTOs) occur when a network drops too many packets, usually due to packet collisions or buffer exhaustion. If a device sends a request or response and does not receive confirmation within a specified amount of time, the device retransmits the request. If too many retransmissions are unacknowledged, an RTO occurs. If you see a large number of RTOs, the network might be too slow to support the current level of activity.
Metric Definition RTOs In The number of retransmission timeouts (RTOs) caused by network congestion as peers were sending data to the current device. An RTO is a 1-5 second stall in the TCP connection flow due to excessive retransmissions. If you see a large number of RTOs in, the device did not send an acknowledgment to the server quickly enough, or the network might be too slow to support the current level of activity. Depending on the timeout value configured in the operating system, this delay can be anywhere from 1 to 8 seconds.
RTOs Out The number of retransmission timeouts (RTOs) caused by network congestion as the device was sending data to its peers. An RTO is a 1-5 second stall in the TCP connection flow due to excessive retransmissions. If you see a large number of RTOs out, the device did not receive an acknowledgment from the server quickly enough, or the network might be too slow to support the current level of activity. Depending on the timeout value configured in the operating system, this delay can be anywhere from 1 to 8 seconds.
WebSocket server page
This page displays metric charts of WebSocket traffic associated with a device on your network.
- Learn about charts on this page:
- Learn about working with metrics.
WebSocket Summary
The following charts are available in this region:
- Messages
- This chart shows you when WebSocket messages were sent and received by the
server.
Metric Description Messages Sent The number of WebSocket messages (TEXT/BINARY) sent or received during an aggregation period. Messages Received The number of WebSocket messages (TEXT/BINARY) sent or received during an aggregation period. - Total Messages
- This chart shows you how many WebSocket messages were sent and received by the
server.
Metric Description Messages Sent The number of WebSocket messages (TEXT/BINARY) sent or received during an aggregation period. Messages Received The number of WebSocket messages (TEXT/BINARY) sent or received during an aggregation period. - Round Trip Time
- This chart shows percentiles of round trip time (RTT). The RTT metric measures how
long it took for packets to get an immediate acknowledgment from the client or server,
measured in milliseconds. Therefore, RTT is a good indicator of how your network is
performing.
Learn more about how the ExtraHop system calculates round trip time on the ExtraHop blog.
Metric Description Round Trip Time The time between when a WebSocket client sent a packet that required an immediate acknowledgment and when the client received the acknowledgment. Round trip time (RTT) is a measurement of network latency. - Round Trip Time
- This chart shows the 95th percentile and median RTT, measured in milliseconds.
Round Trip Time The time between when a WebSocket client sent a packet that required an immediate acknowledgment and when the client received the acknowledgment. Round trip time (RTT) is a measurement of network latency. The Performance (95th Percentile) chart shows the 95th percentile to show the highest value for a time period while filtering outliers; the 95th percentile is the highest value that falls below 95% of the values for a sample period. The following chart shows how displaying the 95th value, rather than the true maximum, can give a more accurate view of the data:
Network Data
This region shows you TCP information that is related to the current protocol. In general, host stalls indicate that there is an issue with either the server or the client, and network stalls indicate that there is an issue with the network.
- Host Stalls
- This chart shows the number of zero windows that were advertised or received by the
device. Devices control the amount of data they receive by specifying the number of
packets that can be sent to them over a given time period. When a device is sent more
data than it can process, the device advertises a zero window to ask its peer device to
stop sending packets completely until the device catches up. If you see a large number
of zero windows, a server or client might not be not fast enough to support the amount
of data being received.
Metric Definition Zero Windows In The number of zero windows that were sent to the device to stop the flow of data over the connection. A device advertises a Zero Window when incoming data is arriving too quickly to be processed. A large number of zero windows in indicates that a peer device was too slow to process the amount of data received.
Zero Windows Out The number of zero windows that were sent from the device to stop the flow of data. A device advertises a Zero Window when incoming data is arriving too quickly to be processed. A large number of zero windows out indicates that the client was too slow to process the amount of data received.
- Network Stalls
-
This chart shows the number of retransmission timeouts that occurred. Retransmission timeouts (RTOs) occur when a network drops too many packets, usually due to packet collisions or buffer exhaustion. If a device sends a request or response and does not receive confirmation within a specified amount of time, the device retransmits the request. If too many retransmissions are unacknowledged, an RTO occurs. If you see a large number of RTOs, the network might be too slow to support the current level of activity.
Metric Definition RTOs In The number of retransmission timeouts (RTOs) caused by network congestion as peers were sending data to the current device. An RTO is a 1-5 second stall in the TCP connection flow due to excessive retransmissions. If you see a large number of RTOs in, the device did not send an acknowledgment to the server quickly enough, or the network might be too slow to support the current level of activity. Depending on the timeout value configured in the operating system, this delay can be anywhere from 1 to 8 seconds.
RTOs Out The number of retransmission timeouts (RTOs) caused by network congestion as the device was sending data to its peers. An RTO is a 1-5 second stall in the TCP connection flow due to excessive retransmissions. If you see a large number of RTOs out, the device did not receive an acknowledgment from the server quickly enough, or the network might be too slow to support the current level of activity. Depending on the timeout value configured in the operating system, this delay can be anywhere from 1 to 8 seconds.
WebSocket client group page
This page displays metric charts of WebSocket traffic associated with a device group on your network.
- Learn about charts on this page:
- Learn about working with metrics.
WebSocket Summary for Group
The following charts are available in this region:
- Messages
- This chart shows you when WebSocket messages were sent and received by clients in the
group.
Metric Description Messages Sent The number of WebSocket messages (TEXT/BINARY) sent or received during an aggregation period. Messages Received The number of WebSocket messages (TEXT/BINARY) sent or received during an aggregation period. - Total Messages
- This chart shows you how many WebSocket messages were sent and received by clients in
the group.
Metric Description Messages Sent The number of WebSocket messages (TEXT/BINARY) sent or received during an aggregation period. Messages Received The number of WebSocket messages (TEXT/BINARY) sent or received during an aggregation period.
WebSocket server group page
This page displays metric charts of WebSocket traffic associated with a device group on your network.
- Learn about charts on this page:
- Learn about working with metrics.
WebSocket Summary for Group
The following charts are available in this region:
- Messages
- This chart shows you when WebSocket messages were sent and received by servers in the
group.
Metric Description Messages Sent The number of WebSocket messages (TEXT/BINARY) sent or received during an aggregation period. Messages Received The number of WebSocket messages (TEXT/BINARY) sent or received during an aggregation period. - Total Messages
- This chart shows you how many WebSocket messages were sent and received by servers in
the group.
Metric Description Messages Sent The number of WebSocket messages (TEXT/BINARY) sent or received during an aggregation period. Messages Received The number of WebSocket messages (TEXT/BINARY) sent or received during an aggregation period.
WireGuard
WireGuard is an open-source protocol. Users can set up secure virtual private networks (VPNs) with cryptographic tools that seal data within an encrypted tunnel.
| Note: | The ExtraHop system classifies and collects metrics for WireGuard protocol activity, but does not include any built-in metrics or metric pages for WireGuard. |
WMI
The ExtraHop system collects metrics about Windows Management Instrumentation (WMI) Remote Protocol activity. WMI is a set of Windows system extensions that provide an operating system interface for establishing remote access sessions.
| Note: | The ExtraHop system does not include any built-in metric pages for WMI. However, you can view WMI metrics by adding them to a custom page or dashboard. |
WSMAN
The ExtraHop system collects metrics about Web Services Management protocol (WSMAN) activity. The WSMAN protocol is a SOAP-based, public standard for exchanging data with any computer device.
| Note: | The ExtraHop system does not include any built-in metric pages for WSMAN. However, you can view WSMAN metrics by adding them to a custom page or dashboard. |
Security considerations
- WSMAN enables administration utilities, such as PowerShell, to send commands to remote devices. Attackers can take advantage of PowerShell to compromise remote devices and laterally move across a network.
Metrics by asset
Each built-in asset page includes metrics about the related metric source. These metric charts can be copied to your dashboards.
Device metrics
These metrics are about devices discovered on your network.
Device Overview page
Click Traffic to view inbound and outbound traffic metrics which can include the charts below.
- Traffic In
- This chart displays the rate of data received by the device, measured in bits per
second.
Metric Descriptions Bytes In The number of inbound L2 bytes that were received by this device. - Traffic Out
- This chart displays the rate of data sent by the device, measured in bits per
second.
Metric Descriptions Bytes Out The number of outbound L2 bytes that were sent by this device. - Top Protocols In
- This chart displays when data was received by the device, broken out by L7
protocol.
Metric Descriptions Bytes In by L7 Protocol The number of inbound L2 bytes that were received by this device. - Top Protocols Out
- This chart displays when data was sent by the device, broken out by L7 protocol.
Metric Descriptions Bytes Out by L7 Protocol The number of outbound L2 bytes that were sent by this device. - Top Cloud Services In
- This chart displays when cloud service data was received by the device, broken out by
the top five cloud services.
Metric Descriptions Cloud Services - Bytes In by Service The number of inbound bytes from cloud services, listed by the cloud service provider. This metric counts the size of the total packet payload. - Top Cloud Services Out
- This chart displays when cloud service data was sent by the device, broken out by the
top five cloud services.
Metric Descriptions Cloud Services - Bytes Out by Service The number of outbound bytes to cloud services, listed by the cloud service provider. This metric counts the size of the total packet payload. - Top Peers
- This table displays the peer devices that exchanged the most traffic with the device
Where to look next
Drill down on a metric: You can get more information about a metric by clicking the metric value or name and selecting an option from the Drill down by menu. For example, if you are looking at the total number of errors, click the number and select Servers to see which servers returned the errors.
Search the Metric Explorer: Built-in protocol pages include the most commonly referenced metrics for a protocol, but you can see additional metrics in the Metric Explorer. Click any chart title on a protocol page and select Create chart from.... When the Metric Explorer opens, click Add Metric in the left pane to display a drop-down menu of comprehensive metrics for the device. If you find an interesting metric, click Add to Dashboard to add the metric to a new or existing dashboard.
Create a custom metric: If you want to view a metric that is not included in the Metric Explorer, you can create a custom metric through a trigger. For more information, see the following resources:
Child Devices page
This page displays a list of child devices (also known as L3 devices) for the current device. For more information about how the ExtraHop system identifies and classifies devices, see Device discovery.
- Name
- The primary name associated with the device on the network. Names are discovered by
passively monitoring a variety of naming protocols, including DNS, DHCP, NETBIOS, and Cisco Discovery Protocol.
If a device name is not discovered, a NIC manufacturer-based identifier is assigned to
the device by looking at the MAC address. If the MAC address range is not registered, or
if it belongs to a private MAC address space, the name includes the last six characters
of the MAC address (for example, Device 00000c0789b1).
The device-type icon to the left of the device name identifies the activity primarily associated with this device. The device name and type can be edited by clicking on the name and using the edit tools on the Device page.
- MAC Address
- The MAC address is a unique identifier of the device network interface. For physical devices that have multiple interfaces, one entry per interface is maintained. The vendor icon displays to the left of MAC Address as determined by the MAC OID lookup.
- VLAN
- The VLAN tag of the device.
- IP Address
- The Primary IP address the device uses to communicate on the network. By default, Address Resolution Protocol (ARP) traffic is used to determine the mapping from MAC addresses to IP addresses. In the absence of such traffic, IP packet header information is used. If there is no ARP traffic, the IP address 0.0.0.0 is assigned to routing devices, such as gateways, firewalls, and load balancers, to indicate that it handles packets from many sources.
- Discovery Time
- The time when the device was first discovered. The day of the week, the calendar date, and time are displayed in the following format: Wed Feb 23 09:01.
- Description
- A user-defined description of the device. To edit the device description, click the device name and use the edit tools on the Device page.
Device Network page
Throughput
- Throughput In Summary
- This chart shows you how much data was received by the device.
Metric Description Bytes In The number of inbound L2 bytes that were received by this device. - Throughput Out Summary
- This chart shows you how much data was sent by the device.
Metric Description Bytes Out The number of outbound L2 bytes that were sent by this device. - Throughput In
- This chart shows you when data was received by the device.
Metric Description Bytes In The number of inbound L2 bytes that were received by this device. - Throughput Out
- This chart shows you when data was sent by the device.
Metric Description Bytes Out The number of outbound L2 bytes that were sent by this device. - Throughput In by L7 Protocol
- This chart shows you when data was received by the device, broken out by L7
protocol.
Metric Description Bytes In by L7 Protocol The number of bytes observed inbound, listed by L7 protocol. L7 protocols support communication at the application level. - Throughput Out by L7 Protocol
- This chart shows you when data was sent by the device, broken out by L7
protocol.
Metric Description Bytes Out by L7 Protocol The number of bytes observed outbound, listed by L7 protocol.L7 protocols support communication at the application level.
Network Latency
This region does not appear if the device is in Flow Analysis.
- Round Trip Time
- This chart shows percentiles for the device TCP round trip time. The RTT metric
measures how long it took for packets to get an immediate acknowledgment from the client
or server, measured in milliseconds. The ExtraHop system calculates this value by
measuring the time between the first packet of a request and the acknowledgment from the
server, as shown in the following figure:
RTT only measures how long an immediate acknowledgment takes to be sent; it does not wait until all packets are delivered. Therefore, RTT is a good indicator of how your network is performing. If the TCP RTT time is high, there might be an issue with the network.
Learn more about how the ExtraHop system calculates round trip time on the ExtraHop blog.
Metric Description Round Trip Time The time elapsed between a device sending a packet and receiving an acknowledgment (ACK). Round trip time (RTT) is a measurement of network latency. - Round Trip Time
- This chart shows you the 95th percentile and median RTT for the device, measured in
milliseconds.
Metric Description Round Trip Time The time elapsed between a device sending a packet and receiving an acknowledgment (ACK). Round trip time (RTT) is a measurement of network latency. This Round Trip Time Summary chart highlights the 95th percentile to show the highest value for a time period while filtering outliers; the 95th percentile is the highest value that falls below 95% of the values for a sample period. The following chart shows how displaying the 95th value, rather than the true maximum, can give a more accurate view of the data:
Packets and Fragmentation
- Packets In
- This chart shows you how many packets were received by the device.
Metric Description Packets In The number of inbound packets received by the device. - Packets Out
- This chart shows you how many packets were sent by the device.
Metric Description Packets Out The number of outbound packets sent by the device. - Packet Rate In
- This chart shows you when packets were received by the device.
Metric Description Packets In The number of inbound packets received by the device. - Packet Rate Out
- This chart shows you when packets were sent by the device.
Metric Description Packets Out The number of outbound packets sent by the device. - Packet Fragmentation In
- This chart shows you when the device received IP datagrams that were fragmented in
transit and required reassembly. This chart does not appear if the device is in Flow
Analysis.
Metric Description IP Fragments In The number of IP fragments that were received by the device. IP fragmentation occurs when an IP datagram is larger than the current maximum transmission unit (MTU). To enable the packet to send, the sender breaks the datagram into smaller pieces called fragments, each with its own header information. If you see a sustained spike in this number, make sure that the device is receiving expected traffic, and that MTU settings are not too low. - Packet Fragmentation Out
- This chart shows you when the device sent IP datagrams that were fragmented in transit
and required reassembly. This chart does not appear if the device is in Flow
Analysis.
Metric Description IP Fragments Out The number of IP fragments that were sent by the device. IP fragmentation occurs when an IP datagram is larger than the current maximum transmission unit (MTU). To enable the packet to send, the sender breaks the datagram into smaller pieces called fragments, each with its own header information. If you see a sustained spike in this number, make sure the device is sending expected traffic and that MTU settings are not too low.
Packet Types
This region does not appear if the device is in Flow Analysis.
- Packet Types
- The chart breaks out how many packets the device sent by packet type.
Metric Description Unicast Packets The number of Ethernet frames (packets) sent by the device to the network as unicast traffic. Multicast Packets The number of Ethernet frames (packets) sent by the device to the network as multicast traffic. Broadcast Packets The number of Ethernet frames (packets) sent by the device to the network as broadcast traffic. - Top Multicast Packet Groups
- The chart breaks out how many multicast packets the device sent by multicast
group.
Metric Description Multicast Groups The number of Ethernet frames (packets) sent by the device to the network as multicast traffic.
DSCP Types (Quality of Service)
This region does not appear if the device is in Flow Analysis.
- Top DSCP Types - Packets In
- This chart breaks out how many packets the device received by differentiated services
code point (DSCP) type.
Metric Description Packets In The number of inbound packets received by the device. - Top DSCP Types - Packets Out
- This chart breaks out how many packets the device sent by differentiated services code
point (DSCP) type.
Metric Description Packets Out The number of outbound packets sent by the device.
Frame Sizes
This region does not appear if the device is in Flow Analysis.
- Frame Sizes In
- The chart breaks out how many packets the device received by size.
Metric Description 64-Byte Frames In The number of Ethernet frames (packets) received by the device that contained 64 or fewer bytes of payload. 128-Byte Frames In The number of Ethernet frames (packets) received by the device that contained between 65 and 128 bytes of payload. 256-Byte Frames In The number of Ethernet frames (packets) received by the device that contained between 129 and 256 bytes of payload. 512-Byte Frames In The number of Ethernet frames (packets) received by the device that contained between 257 and 512 bytes of payload. 1024-Byte Frames In The number of Ethernet frames (packets) received by the device that contain between 513 and 1024 bytes. 1513-Byte Frames In The number of Ethernet frames (packets) received by the device that contained between 1025 and 1513 bytes of payload. 1518-Byte Frames In The number of Ethernet frames (packets) received by the device that contained between 1514 and 1518 bytes of payload. Jumbo Frames In The number of Ethernet frames (packets) received by the device that qualify as jumbo frames, containing between 1501 and 9000 bytes of payload. - Frame Sizes Out
- The chart breaks out how many packets the device sent by size.
Metric Description 64-Byte Frames Out The number of Ethernet frames (packets) sent by the device that contained 64 or fewer bytes of payload. 128-Byte Frames Out The number of Ethernet frames (packets) sent by the device that contained between 65 and 128 bytes of payload. 256-Byte Frames Out The number of Ethernet frames (packets) sent by the device that contained between 129 and 256 bytes of payload. 512-Byte Frames Out The number of Ethernet frames (packets) sent by the device that contained between 257 and 512 bytes of payload. 1024-Byte Frames Out The number of Ethernet frame (packets) sent by the device that contained between 513 and 1024 bytes of payload. 1513-Byte Frames Out The number of Ethernet frames (packets) sent by the device that contained between 1025 and 1513 bytes of payload. 1518-Byte Frames Out The number of Ethernet frames (packets) sent by the device that contained between 1514 and 1518 bytes of payload. Jumbo Frames Out The number of Ethernet frames (packets) sent by the device that qualify as jumbo frames, containing between 1501 and 9000 bytes of payload.
Frame Types
This region does not appear if the device is in Flow Analysis.
- Frame Types In
- The chart breaks out how many packets the device received by type.
Metric Description ARP Frames In The number of Ethernet frames (packets) received by the device that contained an Address Resolution Protocol (ARP) datagram. ARP is a link-level protocol used for resolving IP addresses into MAC addresses. IEEE 802.1x Frames In The number of Ethernet frames (packets) received by the device that were defined by port-based network access control (PNAC). IEEE 802.1x provides an authentication mechanism to devices that attach to a LAN or WLAN. IPv4 Frames In The number of Ethernet frames (packets) received by the device that contained an Internet Protocol version 4 (IPv4) datagram. IPv6 Frames In The number of Ethernet frames (packets) received by the device that contained an Internet Protocol version 6 (IPv6) datagram. IPX Frames In The number of Ethernet frames (packets) received by the device that contained an Internetwork Packet Exchange (IPX) datagram. IPX is a networking protocol that interconnects networks that use Novell NetWare clients and servers. LACP Frames In The number of Ethernet frames (packets) received by the device that contained a Link Aggregation Control Protocol (LACP) datagram. LACP controls the bundling of several physical ports to form a single logical channel. MPLS Frames In The number of Ethernet frames (packets) received by the device that contained a Multiprotocol Label Switching (MPLS) datagram. MPLS is a packet-forwarding technology that uses labels to make data forwarding decisions. It is frequently used to enable the following network services: Virtual Private Networking (VPN), Traffic Engineering (TE), and Quality of Service (QoS). Other Frames In The number of Ethernet frames (packets) received by the device that contained an unspecified datagram. STP Frames In The number of Ethernet frames received by the device that contained a Spanning Tree Protocol (STP) datagram. STP creates a spanning tree within a network of connected L2 bridges and disables links that are not part of the spanning tree, leaving a single active path between any two network nodes. - Frame Types Out
- The chart breaks out how many packets the device sent by type.
Metric Description ARP Frames Out The number of Ethernet frames (packets) sent by the device that contained an Address Resolution Protocol (ARP) datagram. ARP is a link-level protocol used for resolving IP addresses into MAC addresses. IEEE 802.1x Frames Out The number of Ethernet frames (packets) sent by the device that were defined by port-based network access control (PNAC). IEEE 802.1x provides an authentication mechanism to devices that attach to a LAN or WLAN. IPv4 Frames Out The number of Ethernet frames (packets) sent by the device that contained an Internet Protocol version 4 (IPv4) datagram. IPv6 Frames Out The number of Ethernet frames (packets) sent by the device that contained an Internet Protocol version 6 (IPv6) datagram. IPX Frames Out The number of Ethernet frames (packets) sent by the device that contained an Internetwork Packet Exchange (IPX) datagram. IPX is a networking protocol that interconnects networks that use Novell NetWare clients and servers. LACP Frames Out The number of Ethernet frames (packets) sent by the device that contained a Link Aggregation Control Protocol (LACP) datagram. LACP controls the bundling of several physical ports to form a single logical channel. MPLS Frames Out The number of Ethernet frames (packets) sent by the device that contained a Multiprotocol Label Switching (MPLS) datagram. MPLS is a packet-forwarding technology that uses labels to make data forwarding decisions. It is frequently used to enable the following network services: Virtual Private Networking (VPN), Traffic Engineering (TE), and Quality of Service (QoS). Other Frames Out The number of Ethernet frames (packets) sent by the device that contained an unspecified datagram. STP Frames Out The number of Ethernet frames sent by the device that contained a Spanning Tree Protocol (STP) datagram. STP creates a spanning tree within a network of connected L2 bridges and disables links that are not part of the spanning tree, leaving a single active path between any two network nodes. - VLAN Tagged Frames In
-
Metric Description Multicast Groups The number of Ethernet frames received by the device that were VLAN-tagged. VLAN tagging logically groups network resources to enhance network performance, security, and ease of administration. - VLAN Tagged Frames Out
-
Metric Description Multicast Groups The number of Ethernet frames sent by the device that were VLAN-tagged. VLAN tagging logically groups network resources to enhance network performance, security, and ease of administration.
IP Protocols
- Top IP Protocols - Packets In
- This chart breaks out how many packets the device received by protocol.
Metric Description Packets In The number of inbound packets received by the device. - Top IP Protocols - Packets Out
- This chart breaks out how many packets the device sent by protocol.
Metric Description Packets Out The number of outbound packets sent by the device.
ICMP Types
This region does not appear if the device is in Flow Analysis.
- Top ICMP Types - Packets In
- This chart breaks out how many packets the device received by ICMP type.
Metric Description Packets In The number of inbound packets received by the device. - Top ICMP Types - Packets Out
- This chart breaks out how many packets the device sent by ICMP type.
Metric Description Packets Out The number of outbound packets sent by the device.
Where to look next
Drill down on a metric: You can get more information about a metric by clicking the metric value or name and selecting an option from the Drill down by menu. For example, if you are looking at the total number of errors, click the number and select Servers to see which servers returned the errors.
Search the Metric Explorer: Built-in protocol pages include the most commonly referenced metrics for a protocol, but you can see additional metrics in the Metric Explorer. Click any chart title on a protocol page and select Create chart from.... When the Metric Explorer opens, click Add Metric in the left pane to display a drop-down menu of comprehensive metrics for the device. If you find an interesting metric, click Add to Dashboard to add the metric to a new or existing dashboard.
Create a custom metric: If you want to view a metric that is not included in the Metric Explorer, you can create a custom metric through a trigger. For more information, see the following resources:
TCP device page
TCP Summary
- Connections
- Shows the when the device accepted and initiated connections.
Accepted The number of inbound TCP connections accepted by a device during the selected time interval. Connected The number of outbound TCP connections initiated by a device during the selected time interval. External Accepted The number of inbound TCP connections accepted from an external IP address by a device during the selected time interval. By default, a non-RFC1918 IP address is considered external. However, IP addresses can be specified as internal or external on the Network Localities page in System Settings or through the REST API Network Locality Entry resource. External Connected The number of outbound TCP connections initiated to an external IP address by a device during the selected time interval. By default, a non-RFC1918 IP address is considered external. However, IP addresses can be specified as internal or external on the Network Localities page in System Settings or through the REST API Network Locality Entry resource. Closed The number of connections explicitly shut down by the device or its peer. This metric does not appear if the device is in Flow Analysis.
Aborted Connections In The number of times that a device unexpectedly received a reset (RST) instead of a finish (FIN) to abruptly close an established connection. This number does not include unclean shutdowns, which are when a device intentionally responds to a FIN with a RST to close the connection. This metric does not appear if the device is in Flow Analysis.
Aborted Connections Out The number of times that a device unexpectedly sent a reset (RST) instead of a finish (FIN) to abruptly close an established connection. This number does not include unclean shutdowns, which are when a device intentionally responds to a FIN with a RST to close the connection. This metric does not appear if the device is in Flow Analysis.
- Total Connections
- Shows the number of connections accepted and the number of connections initiated by
the device. Accepted connections and connected connections are not the same. For
example, a web server will generally have far more accepted than connected because web
servers rarely initiate connections with other devices.
Accepted The number of inbound TCP connections accepted by a device during the selected time interval. Connected The number of outbound TCP connections initiated by a device during the selected time interval. External Accepted The number of inbound TCP connections accepted from an external IP address by a device during the selected time interval. By default, a non-RFC1918 IP address is considered external. However, IP addresses can be specified as internal or external on the Network Localities page in System Settings or through the REST API Network Locality Entry resource. External Connected The number of outbound TCP connections initiated to an external IP address by a device during the selected time interval. By default, a non-RFC1918 IP address is considered external. However, IP addresses can be specified as internal or external on the Network Localities page in System Settings or through the REST API Network Locality Entry resource. Closed The number of connections explicitly shut down by the device or its peer. This metric does not appear if the device is in Flow Analysis.
Aborted Connections In The number of times that a device unexpectedly received a reset (RST) instead of a finish (FIN) to abruptly close an established connection. This number does not include unclean shutdowns, which are when a device intentionally responds to a FIN with a RST to close the connection. This metric does not appear if the device is in Flow Analysis.
Aborted Connections Out The number of times that a device unexpectedly sent a reset (RST) instead of a finish (FIN) to abruptly close an established connection. This number does not include unclean shutdowns, which are when a device intentionally responds to a FIN with a RST to close the connection. This metric does not appear if the device is in Flow Analysis.
TCP Performance
This region does not appear if the device is in Flow Analysis.- Round Trip Time
-
Round Trip Time The time elapsed between a device sending a packet and receiving an acknowledgment (ACK). Round trip time (RTT) is a measurement of network latency. Measured in milliseconds. - Connection Setup Time
-
TCP Setup Time The time between the ExtraHop system detecting the first and last packet of a TCP 3-way handshake. Measured in milliseconds.
TCP Data Transmission
This region does not appear if the device is in Flow Analysis.- Data Transmitted
-
Bytes In The number of goodput bytes transferred in for the device. Goodput refers to the throughput of the original data transferred and excludes other throughput such as protocol headers or retransmitted packets. Bytes Out The number of goodput bytes transferred out for the device. Goodput refers to the throughput of the original data transferred and excludes other throughput such as protocol headers or retransmitted packets. Retransmission Bytes Out The number of bytes that were resent by the device. - Retransmitted Packets
-
Retransmissions Out The number of times data was resent by the device. - Network Congestion
-
RTOs Out The number of retransmission timeouts (RTOs) caused by network congestion as the device was sending data to its peers. An RTO is a 1-5 second stall in the TCP connection flow due to excessive retransmissions. - Temporary Unresponsiveness
-
TCP Flow Stalls In The number of times that a TCP flow stalled in such a way that this device appeared unresponsive. In the ExtraHop system, a TCP Flow Stall In indicates that three consecutive retransmission timeouts (RTOs) occurred as peer devices sent data to this device. An RTO is a 1-5 second stall in the TCP connection flow due to excessive retransmissions.
TCP Flow Control and Congestion
- Network Congestion
- This chart does not appear if the device is in Flow Analysis.
RTOs In The number of retransmission timeouts (RTOs) caused by network congestion as peers were sending data to the current device. An RTO is a 1-5 second stall in the TCP connection flow due to excessive retransmissions. RTOs Out The number of retransmission timeouts (RTOs) caused by network congestion as the device was sending data to its peers. An RTO is a 1-5 second stall in the TCP connection flow due to excessive retransmissions. - Network Congestion
- This chart does not appear if the device is in Flow Analysis.
RTOs In The number of retransmission timeouts (RTOs) caused by network congestion as peers were sending data to the current device. An RTO is a 1-5 second stall in the TCP connection flow due to excessive retransmissions. RTOs Out The number of retransmission timeouts (RTOs) caused by network congestion as the device was sending data to its peers. An RTO is a 1-5 second stall in the TCP connection flow due to excessive retransmissions. - Host Stalls
- This chart does not appear if the device is in Flow Analysis.
Zero Windows In The number of zero windows that were sent to the device to stop the flow of data over the connection. A device advertises a Zero Window when incoming data is arriving too quickly to be processed. Zero Windows Out The number of zero windows that were sent from the device to stop the flow of data. A device advertises a Zero Window when incoming data is arriving too quickly to be processed. Receive Window Throttles In The number of times the receive window, which was received from a peer device, limited the TCP connection throughput to slow the flow of data. Throttling occurs when a peer device buffer for receiving data is becoming full. In some cases, the read socket buffer size can be increased or receive window scaling can be enabled on the peer device to resolve this problem. Receive Window Throttles Out The number of times the receive window, which was sent by the device, limited the TCP connection throughput to slow the flow of data. Throttling occurs when a device buffer for receiving data becomes full. In some cases, the read socket buffer size can be increased or receive window scaling can be enabled on the device to resolve this problem. - Host Stalls
- This chart does not appear if the device is in Flow Analysis.
Zero Windows In The number of zero windows that were sent to the device to stop the flow of data over the connection. A device advertises a Zero Window when incoming data is arriving too quickly to be processed. Zero Windows Out The number of zero windows that were sent from the device to stop the flow of data. A device advertises a Zero Window when incoming data is arriving too quickly to be processed. Receive Window Throttles In The number of times the receive window, which was received from a peer device, limited the TCP connection throughput to slow the flow of data. Throttling occurs when a peer device buffer for receiving data is becoming full. In some cases, the read socket buffer size can be increased or receive window scaling can be enabled on the peer device to resolve this problem. Receive Window Throttles Out The number of times the receive window, which was sent by the device, limited the TCP connection throughput to slow the flow of data. Throttling occurs when a device buffer for receiving data becomes full. In some cases, the read socket buffer size can be increased or receive window scaling can be enabled on the device to resolve this problem. - Connection Health In
-
Syns Received The number of SYNs received by the device. A synchronize (SYN) packet is the first packet sent across a TCP connection. Accepted The number of inbound TCP connections accepted by a device during the selected time interval. - Connection Health In
-
Syns Received The number of SYNs received by the device. A synchronize (SYN) packet is the first packet sent across a TCP connection. Accepted The number of inbound TCP connections accepted by a device during the selected time interval. - Connection Health Out
-
SYNs Sent The number of SYNs sent by the device to initiate a connection. A synchronize (SYN) packet is the first packet sent across a TCP connection. Connected The number of outbound TCP connections initiated by a device during the selected time interval. - Connection Health Out
-
SYNs Sent The number of SYNs sent by the device to initiate a connection. A synchronize (SYN) packet is the first packet sent across a TCP connection. Connected The number of outbound TCP connections initiated by a device during the selected time interval. - Congestion Control
- This chart does not appear if the device is in Flow Analysis.
Bad Congestion Control In The number of episodes in which a peer device was sending too much data to the device, resulting in network congestion and dropped packets. Bad Congestion Control Out The number of episodes in which the device was sending too much data to a peer device, resulting in network congestion and dropped packets. - Congestion Control
- This chart does not appear if the device is in Flow Analysis.
Bad Congestion Control In The number of episodes in which a peer device was sending too much data to the device, resulting in network congestion and dropped packets. Bad Congestion Control Out The number of episodes in which the device was sending too much data to a peer device, resulting in network congestion and dropped packets. - Send Window Throttling
- This chart does not appear if the device is in Flow Analysis.
Send Window Throttles In The number of times the device appeared to be capable of receiving data from the sender at a higher rate, but the peer device appeared to be limited by its send window. Send Window Throttles Out The number of times in which a peer device appeared to be capable of receiving data from the sender at a higher rate, but the device appeared to be limited by its send window. - Send Window Throttling
- This chart does not appear if the device is in Flow Analysis.
Send Window Throttles In The number of times the device appeared to be capable of receiving data from the sender at a higher rate, but the peer device appeared to be limited by its send window. Send Window Throttles Out The number of times in which a peer device appeared to be capable of receiving data from the sender at a higher rate, but the device appeared to be limited by its send window. - Slow Starts
- This chart does not appear if the device is in Flow Analysis.
Slow Starts Out The number of times the devices entered TCP slow start congestion avoidance, reducing connection throughput. - Slow Starts
- This chart does not appear if the device is in Flow Analysis.
Slow Starts Out The number of times the devices entered TCP slow start congestion avoidance, reducing connection throughput.
TCP Efficient Network Utilization
This region does not appear if the device is in Flow Analysis.- Tinygrams
-
Tinygrams Out The number of tinygrams sent by the device. Tinygrams occur when TCP payloads are segmented inefficiently, resulting in a higher than necessary number of packets on the network. - Total Tinygrams
-
Tinygrams Out The number of tinygrams sent by the device. Tinygrams occur when TCP payloads are segmented inefficiently, resulting in a higher than necessary number of packets on the network. - Nagle Delays - Tinygram Avoidance
-
Nagle Delays Out by L7 Protocol The number of Nagle delays incurred by the current device, which indicates a bad interaction between the Nagle algorithm and delayed acknowledgments (ACKs). - Total Nagle Delays
-
Nagle Delays Out by L7 Protocol The number of Nagle delays incurred by the current device, which indicates a bad interaction between the Nagle algorithm and delayed acknowledgments (ACKs).
TCP Notable Conditions
This region does not appear if the device is in Flow Analysis.- Out of Order Segments
-
Outgoing Out of Order Packets Number of packets sent by the device where the TCP sequence number did not match the sequence number that the ExtraHop system was expecting. The reordering might have been introduced at the device itself or by an intermediate device. This can result in reduced connection throughput, increased processing load on the peer device, and additional ACK packets on the network. - Total Out of Order Segments
-
Outgoing Out of Order Packets Number of packets sent by the device where the TCP sequence number did not match the sequence number that the ExtraHop system was expecting. The reordering might have been introduced at the device itself or by an intermediate device. This can result in reduced connection throughput, increased processing load on the peer device, and additional ACK packets on the network. - Connections Not Using Selective acknowledgments (SACK)
-
SYNs w/o SACK Out The number of SYNs sent by the device that did not have TCP SackOK option set. A synchronize (SYN) packet is the first packet sent across a TCP connection. Selective acknowledgment (SACK) allows the receiver to acknowledge discontinuous blocks of packets that were received correctly. SYNs w/o SACK In The number of SYNs received by the device that did not have TCP SackOK option set. A synchronize (SYN) packet is the first packet sent across a TCP connection. Selective acknowledgment (SACK) allows the receiver to acknowledge discontinuous blocks of packets that were received correctly. - Total Not Using SACK
-
SYNs w/o SACK Out The number of SYNs sent by the device that did not have TCP SackOK option set. A synchronize (SYN) packet is the first packet sent across a TCP connection. Selective acknowledgment (SACK) allows the receiver to acknowledge discontinuous blocks of packets that were received correctly. SYNs w/o SACK In The number of SYNs received by the device that did not have TCP SackOK option set. A synchronize (SYN) packet is the first packet sent across a TCP connection. Selective acknowledgment (SACK) allows the receiver to acknowledge discontinuous blocks of packets that were received correctly. - Dropped or Resent Segments
-
Dropped Segments Out The number of episodes in which a segment or a series of segments were lost on the way from the current device and required retransmission. Dropped Segments In The number of episodes in which a segment or a series of segments were lost on the way to the current device and required retransmission. Retransmissions Out The number of times data was resent by the device. - Dropped or Resent Segments
-
Dropped Segments Out The number of episodes in which a segment or a series of segments were lost on the way from the current device and required retransmission. Dropped Segments In The number of episodes in which a segment or a series of segments were lost on the way to the current device and required retransmission. Retransmissions Out The number of times data was resent by the device.
TCP Metric Totals
- TCP Connections
-
Accepted The number of inbound TCP connections accepted by a device during the selected time interval. Connected The number of outbound TCP connections initiated by a device during the selected time interval. External Accepted The number of inbound TCP connections accepted from an external IP address by a device during the selected time interval. By default, a non-RFC1918 IP address is considered external. However, IP addresses can be specified as internal or external on the Network Localities page in System Settings or through the REST API Network Locality Entry resource. External Connected The number of outbound TCP connections initiated to an external IP address by a device during the selected time interval. By default, a non-RFC1918 IP address is considered external. However, IP addresses can be specified as internal or external on the Network Localities page in System Settings or through the REST API Network Locality Entry resource. Closed The number of connections explicitly shut down by the device or its peer. This metric does not appear if the device is in Flow Analysis.
Established The total number of open TCP connections between devices during the selected time interval. This metric does not appear if the device is in Flow Analysis.
Established Max The largest number of open TCP connections between devices during the selected time interval. This metric does not appear if the device is in Flow Analysis.
Expired The number of connections associated with this device for which tracking stopped because of inactivity. For most protocols, the time range for inactivity is between 16 and 60 seconds. For protocols associated with long-running sessions, such as ICA, the range can be up to 10 minutes. This metric does not appear if the device is in Flow Analysis.
- TCP In
-
Aborted Connections In The number of times that a device unexpectedly received a reset (RST) instead of a finish (FIN) to abruptly close an established connection. This number does not include unclean shutdowns, which are when a device intentionally responds to a FIN with a RST to close the connection. This metric does not appear if the device is in Flow Analysis.
Resets In The number of resets (RSTs) received by the device before the connection is closed. A high number of RSTs can be normal. A spike in RSTs should be investigated. SYNs Received The number of SYNs received by the device. A synchronize (SYN) packet is the first packet sent across a TCP connection. Unestablished SYN-ACKs Received The number of SYN acknowledgments (SYN-ACKs) received by a device that did not result in an established TCP connection. This metric does not appear if the device is in Flow Analysis.
Unanswered SYNs In The number of retransmitted SYNs received by an unresponsive device in an attempt to initiate a connection. This metric does not appear if the device is in Flow Analysis.
Stray Segments In The number of unexpected TCP packets received by the device. This metric does not appear if the device is in Flow Analysis.
Dropped Segments In The number of episodes in which a segment or a series of segments were lost on the way to the current device and required retransmission. This metric does not appear if the device is in Flow Analysis.
Retransmission Timeouts (RTOs) In The number of retransmission timeouts (RTOs) caused by network congestion as peers were sending data to the current device. An RTO is a 1-5 second stall in the TCP connection flow due to excessive retransmissions. If you see a large number of RTOs in, the device did not send an acknowledgment to the server quickly enough, or the network might be too slow to support the current level of activity. Depending on the timeout value configured in the operating system, this delay can be anywhere from 1 to 8 seconds.
This metric does not appear if the device is in Flow Analysis.
Receive Window Throttles In The number of times the receive window, which was received from a peer device, limited the TCP connection throughput to slow the flow of data. Throttling occurs when a peer device buffer for receiving data is becoming full. In some cases, the read socket buffer size can be increased or receive window scaling can be enabled on the peer device to resolve this problem. This metric does not appear if the device is in Flow Analysis.
Send Window Throttles In The number of times the device appeared to be capable of receiving data from the sender at a higher rate, but the peer device appeared to be limited by its send window. This metric does not appear if the device is in Flow Analysis.
SYNs w/o Timestamps In The number of SYNs received by the device that did not have TCP timestamp option set. A synchronize (SYN) packet is the first packet sent across a TCP connection. This metric does not appear if the device is in Flow Analysis.
SYNs w/o SACK In The number of SYNs received by the device that did not have TCP SackOK option set. A synchronize (SYN) packet is the first packet sent across a TCP connection. Selective acknowledgment (SACK) allows the receiver to acknowledge discontinuous blocks of packets that were received correctly. This metric does not appear if the device is in Flow Analysis.
Bad Congestion Control In The number of episodes in which a peer device was sending too much data to the device, resulting in network congestion and dropped packets. This metric does not appear if the device is in Flow Analysis.
PAWS-Dropped SYNs In The number of unanswered SYN packets that were sent to a device in an attempt to initiate a connection. A device's TCP Protection Against Wrapped Sequence (PAWS) mechanism will drop incoming SYN packets if the SYN segment sequence number does not align with the accompanying timestamp value. This metric does not appear if the device is in Flow Analysis.
TCP Flow Stalls In The number of times that a TCP flow stalled in such a way that this device appeared unresponsive. In the ExtraHop system, a TCP Flow Stall In indicates that three consecutive retransmission timeouts (RTOs) occurred as peer devices sent data to this device. An RTO is a 1-5 second stall in the TCP connection flow due to excessive retransmissions. This metric does not appear if the device is in Flow Analysis.
Zero Windows In The number of zero windows that were sent to the device to stop the flow of data over the connection. A device advertises a Zero Window when incoming data is arriving too quickly to be processed. This metric does not appear if the device is in Flow Analysis.
- TCP Out
-
Aborted Connections Out The number of times that a device unexpectedly sent a reset (RST) instead of a finish (FIN) to abruptly close an established connection. This number does not include unclean shutdowns, which are when a device intentionally responds to a FIN with a RST to close the connection. This metric does not appear if the device is in Flow Analysis.
Resets Out The number of resets (RSTs) sent by the device to end a connection. A high number of RSTs can be normal. A spike in RSTs should be investigated. SYNs Sent The number of SYNs sent by the device to initiate a connection. A synchronize (SYN) packet is the first packet sent across a TCP connection. Unanswered SYNs Out The number of retransmitted SYN packets sent to an unresponsive device in an attempt to initiate a connection. This metric does not appear if the device is in Flow Analysis.
Slow Starts Out The number of times the devices entered TCP slow start congestion avoidance, reducing connection throughput. This metric does not appear if the device is in Flow Analysis.
Dropped Segments Out The number of episodes in which a segment or a series of segments were lost on the way from the current device and required retransmission. This metric does not appear if the device is in Flow Analysis.
Retransmission Timeouts (RTOs) Out The number of retransmission timeouts (RTOs) caused by network congestion as the device was sending data to its peers. An RTO is a 1-5 second stall in the TCP connection flow due to excessive retransmissions. If you see a large number of RTOs out, the device did not receive an acknowledgment from the server quickly enough, or the network might be too slow to support the current level of activity. Depending on the timeout value configured in the operating system, this delay can be anywhere from 1 to 8 seconds.
This metric does not appear if the device is in Flow Analysis.
Receive Window Throttles Out The number of times the receive window, which was sent by the device, limited the TCP connection throughput to slow the flow of data. Throttling occurs when a device buffer for receiving data becomes full. In some cases, the read socket buffer size can be increased or receive window scaling can be enabled on the device to resolve this problem. This metric does not appear if the device is in Flow Analysis.
Send Window Throttles Out The number of times in which a peer device appeared to be capable of receiving data from the sender at a higher rate, but the device appeared to be limited by its send window. This metric does not appear if the device is in Flow Analysis.
SYNs w/o Timestamps Out The number of SYNs sent by the device that did not have TCP timestamp option set. A synchronize (SYN) packet is the first packet sent across a TCP connection. This metric does not appear if the device is in Flow Analysis.
SYNs w/o SACK Out The number of SYNs sent by the device that did not have TCP SackOK option set. A synchronize (SYN) packet is the first packet sent across a TCP connection. Selective acknowledgment (SACK) allows the receiver to acknowledge discontinuous blocks of packets that were received correctly. This metric does not appear if the device is in Flow Analysis.
Bad Congestion Control Out The number of episodes in which the device was sending too much data to a peer device, resulting in network congestion and dropped packets. This metric does not appear if the device is in Flow Analysis.
Retransmissions Out The number of times data was resent by the device. This metric does not appear if the device is in Flow Analysis.
TCP Flow Stalls Out The number of times that a TCP flow stalled in such a way that a peer device appeared unresponsive. In the ExtraHop system, a TCP Flow Stall Out indicates that three consecutive retransmission timeouts (RTOs) occurred as this device sent data to peer devices. A single RTO represents a 1-5 second delay on your network. Zero Windows Out The number of zero windows that were sent from the device to stop the flow of data. A device advertises a Zero Window when incoming data is arriving too quickly to be processed. This metric does not appear if the device is in Flow Analysis.
Outgoing Out of Order Packets Number of packets sent by the device where the TCP sequence number did not match the sequence number that the ExtraHop system was expecting. The reordering might have been introduced at the device itself or by an intermediate device. This can result in reduced connection throughput, increased processing load on the peer device, and additional ACK packets on the network. This metric does not appear if the device is in Flow Analysis.
Tinygrams Out The number of tinygrams sent by the device. Tinygrams occur when TCP payloads are segmented inefficiently, resulting in a higher than necessary number of packets on the network. This metric does not appear if the device is in Flow Analysis.
Nagle Delays Out The number of Nagle delays incurred by the current device, which indicates a bad interaction between the Nagle algorithm and delayed acknowledgments (ACKs). This metric does not appear if the device is in Flow Analysis.
Where to look next
Drill down on a metric: You can get more information about a metric by clicking the metric value or name and selecting an option from the Drill down by menu. For example, if you are looking at the total number of errors, click the number and select Servers to see which servers returned the errors.
Search the Metric Explorer: Built-in protocol pages include the most commonly referenced metrics for a protocol, but you can see additional metrics in the Metric Explorer. Click any chart title on a protocol page and select Create chart from.... When the Metric Explorer opens, click Add Metric in the left pane to display a drop-down menu of comprehensive metrics for the device. If you find an interesting metric, click Add to Dashboard to add the metric to a new or existing dashboard.
Create a custom metric: If you want to view a metric that is not included in the Metric Explorer, you can create a custom metric through a trigger. For more information, see the following resources:
Device Cloud Services page
Traffic by Cloud Services
This page shows you which cloud service providers have exchanged data with this device. Click Bytes In or Bytes Out to view information about data received or data sent.
The halo visualization shows connections from this device to external endpoints by cloud service provider. External endpoints appear on the outer ring and are connected to this device, which appears as a circle in the middle of the visualization. Inner circles and outer rings increase in size as traffic volume increases.
- Hover over endpoints or connections to view available hostnames and IP addresses.
- Click endpoints or connections to hold focus and display information for your selection in the information panel to the right.
The chart in the information panel shows you the bitrate and when this device sent or received data, broken out by the top five cloud service providers.
The list in the information panel shows you the amount of data sent or received by this device, broken out by cloud service provider.
Device Geolocation page
Traffic by Geolocation
This page shows you which geographic locations have exchanged data with this device. Click Bytes In or Bytes Out to view information about data received or data sent.
The halo visualization shows connections from this device to external endpoints by the geolocation. External endpoints appear on the outer ring and are connected to this device, which appears as a circle in the middle of the visualization. Inner circles and outer rings increase in size as traffic volume increases.
- Hover over endpoints or connections to view available hostnames and IP addresses.
- Click endpoints or connections to hold focus and display information for your selection in the information panel to the right.
The list in the information panel shows you the amount of data sent or received by this device, broken out by geolocation.
Device Large Uploads page
Large Uploads
This page shows you which external endpoints have received over 1 MB of data in a single transmission from this device.
The halo visualization shows connections from this device to external endpoints. External endpoints appear on the outer ring and are connected to this device, which appears as a circle in the middle of the visualization. Inner circles and outer rings increase in size as traffic volume increases.
- Hover over endpoints or connections to view available hostnames and IP addresses.
- Click endpoints or connections to hold focus and display information for your selection in the information panel to the right.
The chart in the information panel shows you the bitrate and when this device sent data, broken out by the top five external endpoints.
The list in the information panel shows you the amount of data sent or received by this device, broken out external endpoint.
Device AWS page
AWS - Inbound Traffic to Device
- Throughput
- This chart shows you the bitrate of traffic from all AWS cloud services to
the device.
Metric Description AWS Client - AWS Bytes In The number of inbound bytes from AWS. This metric counts the size of the total packet payload. - Traffic
- This chart shows you how much data the device received from all AWS cloud
services.
Metric Description AWS Client - AWS Bytes In The number of inbound bytes from AWS. This metric counts the size of the total packet payload. - Top Services
- This chart shows you the bitrate and when the device received data, broken
out by the top five AWS cloud services.
Metric Description Cloud Services - Bytes In by Service The number of inbound bytes from cloud services, listed by the cloud service provider. This metric counts the size of the total packet payload. - Top Services
- This chart shows you how much data the device received, broken out by the
top five AWS cloud services.
Metric Description Cloud Services - Bytes In by Service The number of inbound bytes from cloud services, listed by the cloud service provider. This metric counts the size of the total packet payload. - Top S3 Buckets
- This chart shows you how much data the device received, broken out by the
top five S3 buckets.
Metric Description AWS Client - S3 Bytes In by S3 Bucket The number of bytes received from Amazon S3 (Simple Storage Service), listed by S3 bucket. This metric counts traffic between the device and S3 buckets. The count only includes the size of the encrypted TLS record.
AWS - Outbound Traffic From Device
- Throughput
- This chart shows you the bitrate of traffic from all AWS cloud service
traffic from the device.
Metric Description AWS Client - AWS Bytes Out The number of outbound bytes to AWS. This metric counts the size of the total packet payload. - Traffic
- This chart shows you how much data from all AWS cloud services was sent from
the device.
Metric Description AWS Client - AWS Bytes Out The number of outbound bytes to AWS. This metric counts the size of the total packet payload. - Top Services
- This chart shows you the bitrate and when data was sent from the device,
broken out by the top five AWS cloud services.
Metric Description Cloud Services - Bytes Out by Service The number of outbound bytes to cloud services, listed by the cloud service provider. This metric counts the size of the total packet payload. - Top Services
- This chart shows you how much data was sent from the device, broken out by
the top five AWS cloud services.
Metric Description Cloud Services - Bytes Out by Service The number of outbound bytes to cloud services, listed by the cloud service provider. This metric counts the size of the total packet payload. - Top S3 Buckets
- This chart shows you how much data was sent from the device, broken out by
the top five S3 buckets.
Metric Description AWS Client - S3 Bytes Out by S3 Bucket The number of bytes sent to Amazon S3 (Simple Storage Service), listed by S3 bucket. This metric counts traffic between the device and S3 buckets. The count only includes the size of the encrypted TLS record.
Device group metrics
These metrics are about device groups, which are user-defined sets of devices that can be collectively assigned as a metric source to a chart, alert, or trigger.
Group Overview page
Group Overview
- Traffic
- This chart shows you how much data was sent and received by the group.
Metric Description Network - Bytes In The number of inbound L2 bytes that were received by this device. Network - Bytes Out The number of outbound L2 bytes that were sent by this device. Network - External Bytes In (ExtraHop RevealX only) The inbound data throughput of a device from external IP addresses. By default, a non-RFC1918 IP address is considered external. However, IP addresses can be specified as internal or external on the Network Localities page in System Settings or through the REST API Network Locality Entry resource. Network - External Bytes Out (ExtraHop RevealX only) The outbound data throughput of a device to external IP addresses. By default, a non-RFC1918 IP address is considered external. However, IP addresses can be specified as internal or external on the Network Localities page in System Settings or through the REST API Network Locality Entry resource. - Throughput
- This chart shows you how much data was sent and received by the group, measured in
bits.
Metric Description Network - Bytes In The number of inbound L2 bytes that were received by this device. Network - Bytes Out The number of outbound L2 bytes that were sent by this device. - External Connections
- This chart shows the number of connections to and from the group. (ExtraHop RevealX
only)
Metric Description TCP - External Accepted The number of inbound TCP connections accepted by a device during the selected time interval. TCP - External Connected The number of outbound TCP connections initiated to an external IP address by a device during the selected time interval. By default, a non-RFC1918 IP address is considered external. However, IP addresses can be specified as internal or external on the Network Localities page in System Settings or through the REST API Network Locality Entry resource. TCP - Suspicious Connections The number of outbound TCP connections to suspicious IP addresses initiated by a device. These IP addresses are considered suspicious based on threat intelligence found in your RevealX system. - Top Group Members
- This table shows the group devices with the most traffic, including data sent and
received.
Metric Description Network - Bytes In The number of inbound L2 bytes that were received by this device. Network - Bytes Out The number of outbound L2 bytes that were sent by this device.
Protocols
- Top Protocols In
- This chart shows you when data was sent by the group, broken out by L7 protocol.
Metric Description L7 - Bytes in by L7 Protocol The number of inbound L2 bytes that were received by this device, listed by L7 protocol. - Top Protocols Out
- This chart shows you when data was received by the group, broken out by L7
protocol.
Metric Description L7 - Bytes in by L7 Protocol The number of outbound L2 bytes that were sent by this device, listed by L7 protocol. - Top Protocols In
- This chart shows you how much data was sent by the group, broken out by L7
protocol.
Metric Description L7 - Bytes in by L7 Protocol The number of inbound L2 bytes that were received by this device, listed by L7 protocol. - Top Protocols Out
- This chart shows you how much data was received by the group, broken out by L7
protocol.
Metric Description L7 - Bytes in by L7 Protocol The number of outbound L2 bytes that were sent by this device, listed by L7 protocol.
Where to look next
Drill down on a metric: You can get more information about a metric by clicking the metric value or name and selecting an option from the Drill down by menu. For example, if you are looking at the total number of errors, click the number and select Servers to see which servers returned the errors.
Search the Metric Explorer: Built-in protocol pages include the most commonly referenced metrics for a protocol, but you can see additional metrics in the Metric Explorer. Click any chart title on a protocol page and select Create chart from.... When the Metric Explorer opens, click Add Metric in the left pane to display a drop-down menu of comprehensive metrics for the device. If you find an interesting metric, click Add to Dashboard to add the metric to a new or existing dashboard.
Create a custom metric: If you want to view a metric that is not included in the Metric Explorer, you can create a custom metric through a trigger. For more information, see the following resources:
Group Devices page
The Devices sub-page lists the devices in the group. You can filter the list of devices and manage the assignments for a device or group of devices. You can click a device to open a detailed metrics page for that device. To return to the list of devices, click the back button in your browser.
Group Network page
Throughput
- Throughput In
- This chart shows you the bitrate and when the device group received data.
Metric Description Bytes In The number of inbound L2 bytes that were received by this device. - Total Traffic In
- This chart shows you how much data the device group received.
Metric Description Bytes In The number of inbound L2 bytes that were received by this device. - Throughput Out
- This chart shows you the bitrate and when the device group sent data.
Metric Description Bytes Out The number of outbound L2 bytes that were sent by this device. - Total Traffic Out
- This chart shows you how much data the device group sent.
Metric Description Bytes Out The number of outbound L2 bytes that were sent by this device.
Packets and Fragmentation
- Packets In
- This chart shows you the average rate and when the device group received
packets.
Metric Description Packets In The number of inbound packets received by the device. - Total Packets In
- This chart shows you how many packets the device group received.
Metric Description Packets In The number of inbound packets received by the device. - Packets Out
- This chart shows you the average rate and when the device group sent packets.
Metric Description Packets Out The number of outbound packets sent by the device. - Total Packets Out
- This chart shows you how many packets the device group sent.
Metric Description Packets Out The number of outbound packets sent by the device. - Packet Fragmentation In
- This chart shows you when the group received IP datagrams that were fragmented in
transit and required reassembly. This chart does not appear if all devices in the group
are in Flow Analysis.
Metric Description IP Fragments In The number of IP fragments that were received by the device. IP fragmentation occurs when an IP datagram is larger than the current maximum transmission unit (MTU). To enable the packet to send, the sender breaks the datagram into smaller pieces called fragments, each with its own header information. If you see a sustained spike in this number, make sure that the device is receiving expected traffic, and that MTU settings are not too low. - Packet Fragmentation Out
- This chart shows you when the group sent IP datagrams that were fragmented in transit
and required reassembly. This chart does not appear if all devices in the group are in
Flow Analysis.
Metric Description IP Fragments Out The number of IP fragments that were sent by the device. IP fragmentation occurs when an IP datagram is larger than the current maximum transmission unit (MTU). To enable the packet to send, the sender breaks the datagram into smaller pieces called fragments, each with its own header information. If you see a sustained spike in this number, make sure the device is sending expected traffic and that MTU settings are not too low.
Packet Types
This region does not appear if all devices in the group are in Flow Analysis.- Packet Types
- The chart breaks out how many packets the group sent by packet type.
Metric Description Unicast Packets The number of Ethernet frames (packets) sent by the device to the network as unicast traffic. Multicast Packets The number of Ethernet frames (packets) sent by the device to the network as multicast traffic. Broadcast Packets The number of Ethernet frames (packets) sent by the device to the network as broadcast traffic. - Top Multicast Packet Groups
- The chart breaks out how many multicast packets the group sent by multicast
group.
Metric Description Multicast Groups The number of Ethernet frames (packets) sent by the device to the network as multicast traffic.
DSCP Types (Quality of Service)
This region does not appear if all devices in the group are in Flow Analysis.- Traffic Prioritization In
- This chart breaks out how much data the group received by differentiated services code
point (DSCP) type.
Metric Description Bytes In The number of inbound L2 bytes that were received by this device. - Traffic Prioritization Out
- This chart breaks out how much data the group sent by differentiated services code
point (DSCP) type.
Metric Description Bytes Out The number of outbound L2 bytes that were sent by this device.
Frame Sizes
This region does not appear if all devices in the group are in Flow Analysis.- Frame Sizes In
- The chart breaks out how many packets the group received by size.
Metric Description 64-Byte Frames In The number of Ethernet frames (packets) received by the device that contained 64 or fewer bytes of payload. 128-Byte Frames In The number of Ethernet frames (packets) received by the device that contained between 65 and 128 bytes of payload. 256-Byte Frames In The number of Ethernet frames (packets) received by the device that contained between 129 and 256 bytes of payload. 512-Byte Frames In The number of Ethernet frames (packets) received by the device that contained between 257 and 512 bytes of payload. 1024-Byte Frames In The number of Ethernet frames (packets) received by the device that contain between 513 and 1024 bytes. 1513-Byte Frames In The number of Ethernet frames (packets) received by the device that contained between 1025 and 1513 bytes of payload. 1518-Byte Frames In The number of Ethernet frames (packets) received by the device that contained between 1514 and 1518 bytes of payload. Jumbo Frames In The number of Ethernet frames (packets) received by the device that qualify as jumbo frames, containing between 1501 and 9000 bytes of payload. - Frame Sizes Out
- The chart breaks out how many packets the group sent by size.
Metric Description 64-Byte Frames Out The number of Ethernet frames (packets) sent by the device that contained 64 or fewer bytes of payload. 128-Byte Frames Out The number of Ethernet frames (packets) sent by the device that contained between 65 and 128 bytes of payload. 256-Byte Frames Out The number of Ethernet frames (packets) sent by the device that contained between 129 and 256 bytes of payload. 512-Byte Frames Out The number of Ethernet frames (packets) sent by the device that contained between 257 and 512 bytes of payload. 1024-Byte Frames Out The number of Ethernet frame (packets) sent by the device that contained between 513 and 1024 bytes of payload. 1513-Byte Frames Out The number of Ethernet frames (packets) sent by the device that contained between 1025 and 1513 bytes of payload. 1518-Byte Frames Out The number of Ethernet frames (packets) sent by the device that contained between 1514 and 1518 bytes of payload. Jumbo Frames Out The number of Ethernet frames (packets) sent by the device that qualify as jumbo frames, containing between 1501 and 9000 bytes of payload.
Frame Types
This region does not appear if all devices in the group are in Flow Analysis.- Frame Types In
- The chart breaks out how many packets the group received by type.
Metric Description ARP Frames In The number of Ethernet frames (packets) received by the device that contained an Address Resolution Protocol (ARP) datagram. ARP is a link-level protocol used for resolving IP addresses into MAC addresses. IEEE 802.1x Frames In The number of Ethernet frames (packets) received by the device that were defined by port-based network access control (PNAC). IEEE 802.1x provides an authentication mechanism to devices that attach to a LAN or WLAN. IPv4 Frames In The number of Ethernet frames (packets) received by the device that contained an Internet Protocol version 4 (IPv4) datagram. IPv6 Frames In The number of Ethernet frames (packets) received by the device that contained an Internet Protocol version 6 (IPv6) datagram. IPX Frames In The number of Ethernet frames (packets) received by the device that contained an Internetwork Packet Exchange (IPX) datagram. IPX is a networking protocol that interconnects networks that use Novell NetWare clients and servers. LACP Frames In The number of Ethernet frames (packets) received by the device that contained a Link Aggregation Control Protocol (LACP) datagram. LACP controls the bundling of several physical ports to form a single logical channel. MPLS Frames In The number of Ethernet frames (packets) received by the device that contained a Multiprotocol Label Switching (MPLS) datagram. MPLS is a packet-forwarding technology that uses labels to make data forwarding decisions. It is frequently used to enable the following network services: Virtual Private Networking (VPN), Traffic Engineering (TE), and Quality of Service (QoS). Other Frames In The number of Ethernet frames (packets) received by the device that contained an unspecified datagram. STP Frames In The number of Ethernet frames received by the device that contained a Spanning Tree Protocol (STP) datagram. STP creates a spanning tree within a network of connected L2 bridges and disables links that are not part of the spanning tree, leaving a single active path between any two network nodes. - Frame Types Out
- The chart breaks out how many packets the group sent by type.
Metric Description ARP Frames Out The number of Ethernet frames (packets) sent by the device that contained an Address Resolution Protocol (ARP) datagram. ARP is a link-level protocol used for resolving IP addresses into MAC addresses. IEEE 802.1x Frames Out The number of Ethernet frames (packets) sent by the device that were defined by port-based network access control (PNAC). IEEE 802.1x provides an authentication mechanism to devices that attach to a LAN or WLAN. IPv4 Frames Out The number of Ethernet frames (packets) sent by the device that contained an Internet Protocol version 4 (IPv4) datagram. IPv6 Frames Out The number of Ethernet frames (packets) sent by the device that contained an Internet Protocol version 6 (IPv6) datagram. IPX Frames Out The number of Ethernet frames (packets) sent by the device that contained an Internetwork Packet Exchange (IPX) datagram. IPX is a networking protocol that interconnects networks that use Novell NetWare clients and servers. LACP Frames Out The number of Ethernet frames (packets) sent by the device that contained a Link Aggregation Control Protocol (LACP) datagram. LACP controls the bundling of several physical ports to form a single logical channel. MPLS Frames Out The number of Ethernet frames (packets) sent by the device that contained a Multiprotocol Label Switching (MPLS) datagram. MPLS is a packet-forwarding technology that uses labels to make data forwarding decisions. It is frequently used to enable the following network services: Virtual Private Networking (VPN), Traffic Engineering (TE), and Quality of Service (QoS). Other Frames Out The number of Ethernet frames (packets) sent by the device that contained an unspecified datagram. STP Frames Out The number of Ethernet frames sent by the device that contained a Spanning Tree Protocol (STP) datagram. STP creates a spanning tree within a network of connected L2 bridges and disables links that are not part of the spanning tree, leaving a single active path between any two network nodes. - VLAN Tagged Frames In
- This chart shows you the number of Ethernet frames received by devices in the group
that were VLAN-tagged.
Metric Description Multicast Groups The number of Ethernet frames received by the device that were VLAN-tagged. VLAN tagging logically groups network resources to enhance network performance, security, and ease of administration. - VLAN Tagged Frames Out
- This chart shows you the number of Ethernet frames sent by devices in the group that
were VLAN-tagged.
Metric Description Multicast Groups The number of Ethernet frames sent by the device that were VLAN-tagged. VLAN tagging logically groups network resources to enhance network performance, security, and ease of administration.
IP Protocols
- Top IP Protocols - Packets In
- This chart breaks out how many packets devices in the group received by
protocol.
Metric Description Packets In The number of inbound packets received by the device. - Top IP Protocols - Packets Out
- This chart breaks out how many packets devices in the group sent by protocol.
Metric Description Packets Out The number of outbound packets sent by the device.
ICMP Types
This region does not appear if all devices in the group are in Flow Analysis.- Top ICMP Types - Packets In
- This chart breaks out how many packets devices in the group received by ICMP
type.
Metric Description Packets In The number of inbound packets received by the device. - Top ICMP Types - Packets Out
- This chart breaks out how many packets devices in the group sent by ICMP type.
Metric Description Packets Out The number of outbound packets sent by the device.
Where to look next
Drill down on a metric: You can get more information about a metric by clicking the metric value or name and selecting an option from the Drill down by menu. For example, if you are looking at the total number of errors, click the number and select Servers to see which servers returned the errors.
Search the Metric Explorer: Built-in protocol pages include the most commonly referenced metrics for a protocol, but you can see additional metrics in the Metric Explorer. Click any chart title on a protocol page and select Create chart from.... When the Metric Explorer opens, click Add Metric in the left pane to display a drop-down menu of comprehensive metrics for the device. If you find an interesting metric, click Add to Dashboard to add the metric to a new or existing dashboard.
Create a custom metric: If you want to view a metric that is not included in the Metric Explorer, you can create a custom metric through a trigger. For more information, see the following resources:
TCP device group page
TCP Metrics for Group
| Note: | To see TCP metric values listed by device group member, you can drill down on TCP metrics. To see metric
values by peer devices, which are either sending or receiving TCP connections from the
device group members, you can drill down by IP, as shown in the
following figure.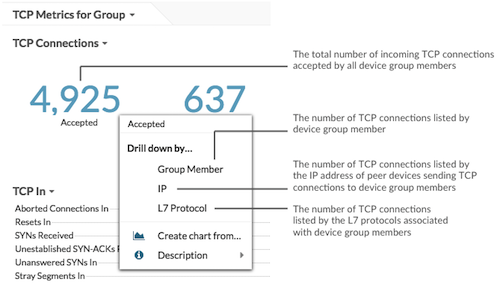 |
- TCP Connections
- Shows the number of connections accepted and the number of connections initiated by
the group. Accepted connections and connected connections are not the same. For example,
a web server will generally have far more accepted than connected because web servers
rarely initiate connections with other devices.
Accepted The number of inbound TCP connections accepted by a device during the selected time interval. Connected The number of outbound TCP connections initiated by a device during the selected time interval. External Accepted The number of inbound TCP connections accepted from an external IP address by a device during the selected time interval. By default, a non-RFC1918 IP address is considered external. However, IP addresses can be specified as internal or external on the Network Localities page in System Settings or through the REST API Network Locality Entry resource. External Connected The number of outbound TCP connections initiated to an external IP address by a device during the selected time interval. By default, a non-RFC1918 IP address is considered external. However, IP addresses can be specified as internal or external on the Network Localities page in System Settings or through the REST API Network Locality Entry resource. Closed The number of connections explicitly shut down by the device or its peer. This metric does not appear if all devices in the group are in Flow Analysis.
Established The total number of open TCP connections between devices during the selected time interval. This metric does not appear if all devices in the group are in Flow Analysis.
Established Max The largest number of open TCP connections between devices during the selected time interval. This metric does not appear if all devices in the group are in Flow Analysis.
Expired The number of connections associated with this device for which tracking stopped because of inactivity. For most protocols, the time range for inactivity is between 16 and 60 seconds. For protocols associated with long-running sessions, such as ICA, the range can be up to 10 minutes. This metric does not appear if all devices in the group are in Flow Analysis.
- TCP In
-
Aborted Connections In The number of times that a device unexpectedly received a reset (RST) instead of a finish (FIN) to abruptly close an established connection. This number does not include unclean shutdowns, which are when a device intentionally responds to a FIN with a RST to close the connection. This metric does not appear if all devices in the group are in Flow Analysis.
Resets In The number of resets (RSTs) received by the device before the connection is closed. A high number of RSTs can be normal. A spike in RSTs should be investigated. SYNs Received The number of SYNs received by the device. A synchronize (SYN) packet is the first packet sent across a TCP connection. Unestablished SYN-ACKs Received The number of SYN acknowledgments (SYN-ACKs) received by a device that did not result in an established TCP connection. This metric does not appear if all devices in the group are in Flow Analysis.
Unanswered SYNs In The number of retransmitted SYNs received by an unresponsive device in an attempt to initiate a connection. This metric does not appear if all devices in the group are in Flow Analysis.
Stray Segments In The number of unexpected TCP packets received by the device. This metric does not appear if all devices in the group are in Flow Analysis.
Dropped Segments In The number of episodes in which a segment or a series of segments were lost on the way to the current device and required retransmission. This metric does not appear if all devices in the group are in Flow Analysis.
Retransmission Timeouts (RTOs) In The number of retransmission timeouts (RTOs) caused by network congestion as peers were sending data to the current device. An RTO is a 1-5 second stall in the TCP connection flow due to excessive retransmissions. This metric does not appear if all devices in the group are in Flow Analysis.
Receive Window Throttles In The number of times the receive window, which was received from a peer device, limited the TCP connection throughput to slow the flow of data. Throttling occurs when a peer device buffer for receiving data is becoming full. In some cases, the read socket buffer size can be increased or receive window scaling can be enabled on the peer device to resolve this problem. This metric does not appear if all devices in the group are in Flow Analysis.
Send Window Throttles In The number of times the device appeared to be capable of receiving data from the sender at a higher rate, but the peer device appeared to be limited by its send window. This metric does not appear if all devices in the group are in Flow Analysis.
SYNs w/o Timestamps In The number of SYNs received by the device that did not have TCP timestamp option set. A synchronize (SYN) packet is the first packet sent across a TCP connection. This metric does not appear if all devices in the group are in Flow Analysis.
SYNs w/o SACK In The number of SYNs received by the device that did not have TCP SackOK option set. A synchronize (SYN) packet is the first packet sent across a TCP connection. Selective acknowledgment (SACK) allows the receiver to acknowledge discontinuous blocks of packets that were received correctly. This metric does not appear if all devices in the group are in Flow Analysis.
Bad Congestion Control In The number of episodes in which a peer device was sending too much data to the device, resulting in network congestion and dropped packets. This metric does not appear if all devices in the group are in Flow Analysis.
PAWS-Dropped SYNs In The number of unanswered SYN packets that were sent to a device in an attempt to initiate a connection. A device's TCP Protection Against Wrapped Sequence (PAWS) mechanism will drop incoming SYN packets if the SYN segment sequence number does not align with the accompanying timestamp value. This metric does not appear if all devices in the group are in Flow Analysis.
TCP Flow Stalls In The number of times that a TCP flow stalled in such a way that this device appeared unresponsive. In the ExtraHop system, a TCP Flow Stall In indicates that three consecutive retransmission timeouts (RTOs) occurred as peer devices sent data to this device. An RTO is a 1-5 second stall in the TCP connection flow due to excessive retransmissions. This metric does not appear if all devices in the group are in Flow Analysis.
Zero Windows In The number of zero windows that were sent to the device to stop the flow of data over the connection. A device advertises a Zero Window when incoming data is arriving too quickly to be processed. This metric does not appear if all devices in the group are in Flow Analysis.
- TCP Out
-
Aborted Connections Out The number of times that a device unexpectedly sent a reset (RST) instead of a finish (FIN) to abruptly close an established connection. This number does not include unclean shutdowns, which are when a device intentionally responds to a FIN with a RST to close the connection. This metric does not appear if all devices in the group are in Flow Analysis.
Resets Out The number of resets (RSTs) sent by the device to end a connection. A high number of RSTs can be normal. A spike in RSTs should be investigated. SYNs Sent The number of SYNs sent by the device to initiate a connection. A synchronize (SYN) packet is the first packet sent across a TCP connection. Unanswered SYNs Out The number of retransmitted SYN packets sent to an unresponsive device in an attempt to initiate a connection. This metric does not appear if all devices in the group are in Flow Analysis.
Slow Starts Out The number of times the devices entered TCP slow start congestion avoidance, reducing connection throughput. This metric does not appear if all devices in the group are in Flow Analysis.
Dropped Segments Out The number of episodes in which a segment or a series of segments were lost on the way from the current device and required retransmission. This metric does not appear if all devices in the group are in Flow Analysis.
Retransmission Timeouts (RTOs) Out The number of retransmission timeouts (RTOs) caused by network congestion as the device was sending data to its peers. An RTO is a 1-5 second stall in the TCP connection flow due to excessive retransmissions. This metric does not appear if all devices in the group are in Flow Analysis.
Receive Window Throttles Out The number of times the receive window, which was sent by the device, limited the TCP connection throughput to slow the flow of data. Throttling occurs when a device buffer for receiving data becomes full. In some cases, the read socket buffer size can be increased or receive window scaling can be enabled on the device to resolve this problem. This metric does not appear if all devices in the group are in Flow Analysis.
Send Window Throttles Out The number of times in which a peer device appeared to be capable of receiving data from the sender at a higher rate, but the device appeared to be limited by its send window. This metric does not appear if all devices in the group are in Flow Analysis.
SYNs w/o Timestamps Out The number of SYNs sent by the device that did not have TCP timestamp option set. A synchronize (SYN) packet is the first packet sent across a TCP connection. This metric does not appear if all devices in the group are in Flow Analysis.
SYNs w/o SACK Out The number of SYNs sent by the device that did not have TCP SackOK option set. A synchronize (SYN) packet is the first packet sent across a TCP connection. Selective acknowledgment (SACK) allows the receiver to acknowledge discontinuous blocks of packets that were received correctly. This metric does not appear if all devices in the group are in Flow Analysis.
Bad Congestion Control Out The number of episodes in which the device was sending too much data to a peer device, resulting in network congestion and dropped packets. This metric does not appear if all devices in the group are in Flow Analysis.
Retransmissions Out The number of times data was resent by the device. This metric does not appear if all devices in the group are in Flow Analysis.
TCP Flow Stalls Out The number of times that a TCP flow stalled in such a way that a peer device appeared unresponsive. In the ExtraHop system, a TCP Flow Stall Out indicates that three consecutive retransmission timeouts (RTOs) occurred as this device sent data to peer devices. A single RTO represents a 1-5 second delay on your network. This metric does not appear if all devices in the group are in Flow Analysis.
Zero Windows Out The number of zero windows that were sent from the device to stop the flow of data. A device advertises a Zero Window when incoming data is arriving too quickly to be processed. This metric does not appear if all devices in the group are in Flow Analysis.
Outgoing Out of Order Packets Number of packets sent by the device where the TCP sequence number did not match the sequence number that the ExtraHop system was expecting. The reordering might have been introduced at the device itself or by an intermediate device. This can result in reduced connection throughput, increased processing load on the peer device, and additional ACK packets on the network. This metric does not appear if all devices in the group are in Flow Analysis.
Tinygrams Out The number of tinygrams sent by the device. Tinygrams occur when TCP payloads are segmented inefficiently, resulting in a higher than necessary number of packets on the network. This metric does not appear if all devices in the group are in Flow Analysis.
Nagle Delays Out The number of Nagle delays incurred by the current device, which indicates a bad interaction between the Nagle algorithm and delayed acknowledgments (ACKs). This metric does not appear if all devices in the group are in Flow Analysis.
TCP Devices in Group
- Top Group Members (TCP Accepted)
- Displays the group members that have accepted the most TCP connections.
TCP Accepted The number of inbound TCP connections accepted by a device during the selected time interval.
TCP Performance
This region does not appear if all devices in the group are in Flow Analysis.- Round Trip Time
-
Round Trip Time The time elapsed between a device sending a packet and receiving an acknowledgment (ACK). Round trip time (RTT) is a measurement of network latency. - Connection Setup Time
-
TCP Setup Time The time between the ExtraHop system detecting the first and last packet of a TCP 3-way handshake.
Group Cloud Services page
Traffic by Cloud Services
This page shows you which cloud service providers have exchanged data with this device group. Click Bytes In or Bytes Out to view information about data received or data sent.
The halo visualization shows connections from internal endpoints in this device group to external endpoints by cloud service provider. External endpoints appear on the outer ring and are connected to devices in this group, which appear as circles in the middle of the visualization. Inner circles and outer rings increase in size as traffic volume increases.
- Hover over endpoints or connections to view available hostnames and IP addresses.
- Click endpoints or connections to hold focus and display information for your selection in the information panel to the right.
The chart in the information panel shows you the bitrate and when this device group sent or received data, broken out by the top five cloud service providers.
The list in the information panel shows you the amount of data sent or received by this device group, broken out by cloud service provider.
Group Geolocation page
Traffic by Geolocation
This page shows you which geographic locations have exchanged data with this device group. Click Bytes In or Bytes Out to view information about data received or data sent.
The halo visualization shows connections from internal endpoints in this device group to external endpoints by geolocation. External endpoints appear on the outer ring and are connected to devices in this group, which appear as circles in the middle of the visualization. Inner circles and outer rings increase in size as traffic volume increases.
- Hover over endpoints or connections to view available hostnames and IP addresses.
- Click endpoints or connections to hold focus and display information for your selection in the information panel to the right.
The list in the information panel shows you the amount of data sent or received by this device group, broken out by geolocation.
Group Large Uploads page
Large Uploads
This page shows you which external endpoints have received over 1 MB of data in a single transmission from a device in this group.
The halo visualization shows you the connections between internal endpoints in this device group and external endpoints. External endpoints are displayed in the outer ring with connections to devices in this group, which are displayed as circles in the middle of the visualization. Inner circles and outer rings increase in size as traffic volume increases.
The halo visualization shows connections from internal endpoints in this device group to external endpoints. External endpoints appear on the outer ring and are connected to devices in this group, which appear as circles in the middle of the visualization. Inner circles and outer rings increase in size as traffic volume increases.
- Hover over endpoints or connections to view available hostnames and IP addresses.
- Click endpoints or connections to hold focus and display information for your selection in the information panel to the right.
The chart in the information panel shows you the bitrate and when this device group sent data, broken out by the top five external endpoints.
The list in the information panel shows you the amount of data sent or received by this device group, broken out external endpoint.
Group AWS page
AWS - Inbound Traffic to Group
- Throughput
- This chart shows you the bitrate of traffic from all AWS cloud services to
the device group.
Metric Description AWS Client - AWS Bytes In The number of inbound bytes from AWS. This metric counts the size of the total packet payload. - Traffic
- This chart shows you how much data the device group received from all AWS
cloud services.
Metric Description AWS Client - AWS Bytes In The number of inbound bytes from AWS. This metric counts the size of the total packet payload. - Top Services
- This chart shows you how much data the device group received, broken out by
the top five AWS cloud services.
Metric Description Cloud Service - Bytes In by Service The number of inbound bytes from cloud services, listed by the cloud service provider. This metric counts the size of the total packet payload. - Top S3 Buckets
- This chart shows you how much data the device group received, broken out by
the top five S3 buckets.
Metric Description AWS Client - S3 Bytes In by S3 Bucket The number of bytes received from Amazon S3 (Simple Storage Service), listed by S3 bucket. This metric counts traffic between the device and S3 buckets. The count only includes the size of the encrypted TLS record.
AWS - Outbound Traffic From Group
- Throughput
- This chart shows you the bitrate of traffic from all AWS cloud service
traffic from the device group.
Metric Description AWS Client - AWS Bytes Out The number of outbound bytes to AWS. This metric counts the size of the total packet payload. - Traffic
- This chart shows you how much data from all AWS cloud services was sent from
the device group.
Metric Description AWS Client - AWS Bytes Out The number of outbound bytes to AWS. This metric counts the size of the total packet payload. - Top Services
- This chart shows you how much data was sent from the device group, broken
out by the top five AWS cloud services.
Metric Description Cloud Service - Bytes Out by Service The number of outbound bytes to cloud services, listed by the cloud service provider. This metric counts the size of the total packet payload. - Top S3 Buckets
- This chart shows you how much data was sent from the device group, broken
out by the top five S3 buckets.
Metric Description AWS Client - S3 Bytes Out by S3 Bucket The number of bytes sent to Amazon S3 (Simple Storage Service), listed by S3 bucket. This metric counts traffic between the device and S3 buckets. The count only includes the size of the encrypted TLS record.
Custom device metrics
Custom devices enable you to collect metrics for devices that are outside of your local network or when you have a group of devices that you want to aggregate metrics for as a single device.
Remote site metrics
You can collect any device metric about a custom device, but you can also collect remote site metrics to easily learn how remote locations consume services and to gain visibility into traffic between remote sites and a data center.
The following table describes all available remote site metrics for custom devices:
| Metric | Description |
|---|---|
| Custom Device - Bytes In By Conversation | The number of inbound bytes received by the custom device, listed by the IP addresses of the receiver and sender. |
| Custom Device - Bytes Out By Conversation | The number of outbound bytes sent by the custom device, listed by the IP addresses of the sender and receiver. |
| Custom Device - Bytes In By L7 Protocol By Conversation | The number of inbound bytes received by the custom device, listed by L7 Protocol and the IP addresses of the receiver and sender. L7 protocols support communication at the application level. |
| Custom Device - Bytes Out By L7 Protocol By Conversation | The number of outbound bytes sent by the custom device, listed by L7 Protocol and the IP addresses of the sender and receiver. L7 protocols support communication at the application level. |
| Custom Device - Bytes By Peer Device | The total amount of data throughput (measured in bytes or bits) sent and received between the custom device and a peer custom device, listed by the peer custom device. |
| Custom Device - Bytes In By Peer Device | The inbound data throughput of the custom device from a peer custom device, listed by the peer custom device. |
| Custom Device - Bytes Out By Peer Device | The outbound data throughput of the custom device to a peer custom device, listed by the peer custom device. |
| Custom Device - Bytes In By Receiver Ip Address | The number of inbound bytes received by the custom device, listed by the receiving IP address. |
| Custom Device - Bytes Out By Sender Ip Address | The number of outbound bytes sent by the custom device, listed by the sending IP address. |
| Custom Device - Rto In By Conversation | The number of retransmission timeouts (RTOs) caused by network congestion when peers sent data to the current custom device, listed by the IP addresses of the receiver and sender. An RTO is a 1-5 second stall in the TCP connection flow due to excessive retransmissions. |
| Custom Device - Rto Out By Conversation | The number of retransmission timeouts (RTOs) caused by network congestion when the custom device sent data to its peers, listed by the IP addresses of the sender and receiver. An RTO is a 1-5 second stall in the TCP connection flow due to excessive retransmissions. |
| Custom Device - Rtt By Conversation | The time elapsed between a custom device sending a packet and receiving an acknowledgment (ACK), listed by the IP addresses of the flow endpoints. Round trip time (RTT) is a measurement of network latency. Measured in milliseconds. |
| Custom Device - Zwnd In By Conversation | The number of zero windows that were sent to the custom device to stop the flow of data, listed by the IP addresses of the receiver and sender. A device advertises a Zero Window when incoming data is arriving too quickly to be processed. |
| Custom Device - Zwnd Out By Conversation | The number of zero windows that were sent from the custom device to stop the flow of data, listed by the IP addresses of the sender and receiver. A device advertises a Zero Window when incoming data is arriving too quickly to be processed. |
Application metrics
These metrics are about applications, which are user-defined containers.
Application Overview page
The Application Overview page includes interactive charts that provide an overview of a selected application.
Learn about charts on this page:
| Note: | This page reflects only built-in metrics. If there is additional traffic for custom metrics, that traffic will not appear on this page. You can view custom metrics on a dashboard. |
Application Overview
- Transactions
- This chart shows which protocols the application is communicating through the most.
- Errors
- This chart shows which protocols the application is encountering the most errors with.
- Server Processing Time (95th)
- This chart shows which protocols have the highest server processing times. Measured in milliseconds.
- Response Bytes
- This chart shows the protocols that the most data is being transmitted to the application through.
Transactions by Protocol
- Transactions
- This chart shows when the application was most active, broken out by protocol.
- Errors
- This chart shows when the application encountered errors, broken out by protocol.
- Server Processing Time (95th)
- This chart shows when the application experienced the highest server processing times, broken out by protocol. Measured in milliseconds.
Traffic by Protocol
- Response Bytes
- This chart how many response bytes associated with the application, broken out by protocol.
- Response Packets
- This chart how many response packets associated with the application, broken out by protocol.
Where to look next
Drill down on a metric: You can get more information about a metric by clicking the metric value or name and selecting an option from the Drill down by menu. For example, if you are looking at the total number of errors, click the number and select Servers to see which servers returned the errors.
Search the Metric Explorer: Built-in protocol pages include the most commonly referenced metrics for a protocol, but you can see additional metrics in the Metric Explorer. Click any chart title on a protocol page and select Create chart from.... When the Metric Explorer opens, click Add Metric in the left pane to display a drop-down menu of comprehensive metrics for the device. If you find an interesting metric, click Add to Dashboard to add the metric to a new or existing dashboard.
Create a custom metric: If you want to view a metric that is not included in the Metric Explorer, you can create a custom metric through a trigger. For more information, see the following resources:
Network & TCP application page
This page displays metric charts of network and TCP traffic associated with application containers on your network.
- Learn about charts on this page:
- Learn about working with metrics.
Throughput
- Throughput
- This chart displays L2 throughput over time.
Metric Description Request L2 Bytes The number of L2 bytes sent from clients to servers. Response L2 Bytes The number of L2 bytes sent from servers to clients. - Throughput
- This chart displays the rate of L2 throughput.
Metric Description Request L2 Bytes The number of L2 bytes sent from clients to servers. Response L2 Bytes The number of L2 bytes sent from servers to clients. - Throughput
- This chart displays the total L2 throughput.
Metric Description Request L2 Bytes The number of L2 bytes sent from clients to servers. Response L2 Bytes The number of L2 bytes sent from servers to clients.
TCP Summary
- Connections
- This chart displays L2 connections over time.
Metric Description Connected The number of connections initiated. Closed The number of connections closed. Closed connections are explicitly shut down by either the client or server. Expired The number of connections associated with this device for which tracking stopped because of inactivity. For most protocols, the time range for inactivity is between 16 and 60 seconds. For protocols associated with long-running sessions, such as ICA, the range can be up to 10 minutes. Aborts The number of established connections that were unexpectedly closed when a device sent a TCP reset (RST).
Network Latency
- Round Trip Time
- This chart displays percentiles for the TCP round trip time, measured in milliseconds.
High round trip times indicate that the application is communicating over slow
networks.
Metric Description Round Trip Time The time between when a client or server sent a packet requiring immediate acknowledgment and when the acknowledgment was received. - Round Trip Time
- This chart displays the 95th and 5th percentiles for the TCP round trip time, measured
in milliseconds.
Metric Description Round Trip Time The time between when a client or server sent a packet requiring immediate acknowledgment and when the acknowledgment was received.
Host Stalls
- Client Stalls
- This chart shows when clients were either sending more data than servers could process
or receiving more data than the clients could process.
Metric Description Request Zero Windows The number of zero window advertisements sent by clients. A device advertises a Zero Window when incoming data is arriving too quickly to be processed. A large number of incoming Zero Windows indicates that a peer device was too slow to process the amount of data received.
Request Receive Throttle The total number of times that the receive window, which determines the amount of data that a client can send before requiring an ACK, advertised by a server limited the throughput of requests that clients were sending. - Total Client Stalls
- This chart shows the total number of request zero windows and request receive throttle
in the selected time period.
Metric Description Request Zero Windows The number of zero window advertisements sent by clients. A device advertises a Zero Window when incoming data is arriving too quickly to be processed. A large number of incoming Zero Windows indicates that a peer device was too slow to process the amount of data received.
Request Receive Throttle The total number of times that the receive window, which determines the amount of data that a client can send before requiring an ACK, advertised by a server limited the throughput of requests that clients were sending. - Server Stalls
- This chart shows when servers were either sending more data than clients could process
or receiving more data than the servers could process.
Metric Description Response Zero Windows The number of zero window advertisements sent by servers. A device advertises a Zero Window when incoming data is arriving too quickly to be processed. A large number of incoming Zero Windows indicates that a peer device was too slow to process the amount of data received.
Response Receive Throttle The total number of times that the receive window, which determines the amount of data that a client can send before requiring an ACK, advertised by a server limited the throughput of responses that clients were receiving. - Total Server Stalls
- This chart shows the total number of request zero windows and request receive throttle
in the selected time period.
Metric Description Response Zero Windows The number of zero window advertisements sent by servers. A device advertises a Zero Window when incoming data is arriving too quickly to be processed. A large number of incoming Zero Windows indicates that a peer device was too slow to process the amount of data received.
Response Receive Throttle The total number of times that the receive window, which determines the amount of data that a client can send before requiring an ACK, advertised by a server limited the throughput of responses that clients were receiving.
Network Stalls
- Request Congestion
- This chart compares request goodput bitrates with response RTOs so you can see how
much data was being transmitted when the network experienced stalls.
Metric Description Request Goodput Bitrate The goodput associated with requests sent from clients to servers. Goodput refers to the throughput of the original data transferred and excludes other throughput such as protocol headers or retransmitted packets. Request RTOs The number of retransmission timeouts (RTOs) that occurred while sending request data. An RTO is a 1-5 second stall in the TCP connection flow due to excessive retransmissions. If you see a large number of incoming RTOs, a device did not send an acknowledgment to the server quickly enough, or the network might be too slow to support the current level of activity. Depending on the timeout value configured in the operating system, this delay can be anywhere from 1 to 8 seconds.
- Response Congestion
- This chart compares response goodput bitrates with response RTOs so you can see how
much data was being transmitted when the network experienced stalls.
Metric Description Response Goodput Bitrate The goodput associated with responses sent from servers to clients. Goodput refers to the throughput of the original data transferred and excludes other throughput such as protocol headers or retransmitted packets. Response RTOs The number of retransmission timeouts (RTOs) that occurred while sending response data. An RTO is a 1-5 second stall in the TCP connection flow due to excessive retransmissions. If you see a large number of incoming RTOs, a device did not send an acknowledgment to the server quickly enough, or the network might be too slow to support the current level of activity. Depending on the timeout value configured in the operating system, this delay can be anywhere from 1 to 8 seconds.
TCP Efficient Network Utilization
- Nagle Delays
- This chart shows when connections were delayed due to bad interactions between Nagle's
Algorithm and delayed ACKs. In some cases, disabling Nagle's Algorithm can mitigate the
problem. On the BIG-IP Application Delivery Controller, the Nagle setting in the TCP
profile should be disabled and ack_on_push should be enabled.
Metric Description Request Nagle Delays The number of connection delays due to a bad interaction between Nagle's algorithm and delayed ACKs as requests are sent from clients to servers. Response Nagle Delays The number of connection delays due to a bad interaction between Nagle's algorithm and delayed ACKs as responses are sent from servers to clients. - Total Nagle Delays
- This chart shows how many connections were delayed due to bad interactions between
Nagle's Algorithm and delayed ACKs.
Metric Description Request Nagle Delays The number of connection delays due to a bad interaction between Nagle's algorithm and delayed ACKs as requests are sent from clients to servers. Response Nagle Delays The number of connection delays due to a bad interaction between Nagle's algorithm and delayed ACKs as responses are sent from servers to clients.
Network Metric Totals
- Connections
-
Metric Description Accepted or Connected The number of connections initiated. Closed The number of connections closed. Closed connections are explicitly shut down by either the client or server. Expired The number of connections associated with this device for which tracking stopped because of inactivity. For most protocols, the time range for inactivity is between 16 and 60 seconds. For protocols associated with long-running sessions, such as ICA, the range can be up to 10 minutes. Established A snapshot count of the number of open connections. Established Max The largest number of open connections observed for the application during the selected time interval. Aborts The number of established connections that were unexpectedly closed when a device sent a TCP reset (RST). - Request Metrics
-
Metric Description Request Zero Windows The number of zero window advertisements sent by clients. A device advertises a Zero Window when incoming data is arriving too quickly to be processed. A large number of incoming Zero Windows indicates that a peer device was too slow to process the amount of data received.
Request Receive Throttle The total number of times that the receive window, which determines the amount of data that a client can send before requiring an ACK, advertised by a server limited the throughput of requests that clients were sending. Request Nagle Delays The number of connection delays due to a bad interaction between Nagle's algorithm and delayed ACKs as requests are sent from clients to servers. RTOs The number of retransmission timeouts (RTOs) that occurred while sending request data. An RTO is a 1-5 second stall in the TCP connection flow due to excessive retransmissions. If you see a large number of incoming RTOs, a device did not send an acknowledgment to the server quickly enough, or the network might be too slow to support the current level of activity. Depending on the timeout value configured in the operating system, this delay can be anywhere from 1 to 8 seconds.
L2 Bytes The number of L2 bytes sent from clients to servers. Goodput Bytes The goodput associated with requests sent from clients to servers. Goodput refers to the throughput of the original data transferred and excludes other throughput such as protocol headers or retransmitted packets. Packets The number of packets sent from clients to servers. - Response Metrics
-
Metric Description Request Zero Windows The number of zero window advertisements sent by servers. A device advertises a Zero Window when incoming data is arriving too quickly to be processed. A large number of incoming Zero Windows indicates that a peer device was too slow to process the amount of data received.
Request Receive Throttle The total number of times that the receive window, which determines the amount of data that a client can send before requiring an ACK, advertised by a server limited the throughput of responses that clients were receiving. Request Nagle Delays The number of connection delays due to a bad interaction between Nagle's algorithm and delayed ACKs as responses are sent from servers to clients. RTOs The number of retransmission timeouts (RTOs) that occurred while sending response data. An RTO is a 1-5 second stall in the TCP connection flow due to excessive retransmissions. If you see a large number of incoming RTOs, a device did not send an acknowledgment to the server quickly enough, or the network might be too slow to support the current level of activity. Depending on the timeout value configured in the operating system, this delay can be anywhere from 1 to 8 seconds.
L2 Bytes The number of L2 bytes sent from servers to clients. Goodput Bytes The goodput associated with responses sent from servers to clients. Goodput refers to the throughput of the original data transferred and excludes other throughput such as protocol headers or retransmitted packets. Packets The number of packets sent from servers to clients.
Network metrics
These metrics are about the wire network or flow network data feeds to the ExtraHop system and include VLANs and flow network interfaces.
Network Overview page
Network Properties
- Name
- The primary name for the network.
- Devices
- The number of devices discovered on the network.
- VLANs
- The number of VLANs on the network.
- Description
- A user-defined description of the network.
- Type
- The type of network.
- API ID
- The ID that identifies the network in the REST API.
- Capture IP
- The IP address of the ExtraHop system responsible for the network capture.
- Capture MAC
-
The MAC address of the ExtraHop system responsible for the network capture.
Network Overview
- Throughput
- This chart shows you when data was sent over the network, measured in bits.
Metric Description Throughput The total throughput of the network capture in bytes. - Maximum Throughput
- This chart shows you the highest rate that data was sent over the network during the
selected time interval.
Metric Description Throughput The total throughput of the network capture in bytes. - Average Throughput
- This chart shows you the average rate that data was sent over the network during the
selected time interval.
Metric Description Throughput The total throughput of the network capture in bytes.
Cloud Services
- Top Cloud Services - Traffic In
- This chart shows you when data was sent into the network from a cloud service, broken
out by cloud service provider.
Metric Description Bytes In by Cloud Service The number of inbound bytes from cloud services, listed by the cloud service provider. This metric counts the size of the total packet payload. - Top Cloud Services - Traffic In
- This chart shows you the total amount of data sent into the network from a cloud
service, broken out by cloud service provider.
Metric Description Bytes In by Cloud Service The number of inbound bytes from cloud services, listed by the cloud service provider. This metric counts the size of the total packet payload. - Top Cloud Services - Traffic Out
- This chart shows you when data was sent out of the network to a cloud service, broken
out by cloud service provider.
Metric Description Bytes Out by Cloud Service The number of outbound bytes to cloud services, listed by the cloud service provider. This metric counts the size of the total packet payload. - Top Cloud Services - Traffic Out
- This chart shows you the total amount of data sent out of the network to a cloud
service, broken out by cloud service provider.
Metric Description Bytes Out by Cloud Service The number of outbound bytes to cloud services, listed by the cloud service provider. This metric counts the size of the total packet payload.
L7 Protocols
- Top L7 Protocols
- This chart shows you when data was sent over the network, broken out by L7
protocol.
Metric Description Bytes by L7 Protocol The byte count for a specific L7 protocol within the currently selected network. L7 protocols support communication at the application level. - Top L7 Protocols
- This chart shows you the total amount of data sent over the network, broken out by L7
protocol.
Metric Description Bytes by L7 Protocol The byte count for a specific L7 protocol within the currently selected network. L7 protocols support communication at the application level.
IP Protocols
- Top IP Protocols
- This chart shows you when data was sent over the network, broken out by IP
protocol.
Metric Description Throughput The total throughput of the network capture in bytes. - Top IP Protocols
- This chart shows you the total amount of data sent over the network, broken out by IP
protocol.
Metric Description Throughput The total throughput of the network capture in bytes. - Packet Fragmentation
- This chart shows you when IP datagrams that were sent over the network were fragmented
in transit and required reassembly. This chart does not appear on flow sensors.
Metric Description IP Fragments The total number of sent and received IP fragments. IP fragmentation occurs when an IP datagram is larger than the current maximum transmission unit (MTU). To enable the packet to send, the sender breaks the datagram into smaller pieces called fragments, each with its own header information. If you see a sustained spike in this number, make sure that devices are sending expected traffic and that MTU settings are not too low. - Packet Fragmentation
- This chart shows you how many IP datagrams that were sent over the network were
fragmented in transit and required reassembly. This chart does not appear on flow
sensors.
Metric Description IP Fragments The total number of sent and received IP fragments. IP fragmentation occurs when an IP datagram is larger than the current maximum transmission unit (MTU). To enable the packet to send, the sender breaks the datagram into smaller pieces called fragments, each with its own header information. If you see a sustained spike in this number, make sure that devices are sending expected traffic and that MTU settings are not too low.
DSCP Types (Quality of Service)
This region does not appear on flow sensors.- Top DSCP Types
- This chart shows you when data was sent over the network, broken out by differentiated
services code point (DSCP) type.
Metric Description Throughput The total throughput of the network capture in bytes. - Top DSCP Types
- This chart shows you the total amount of data sent over the network, broken out by
DSCP type.
Metric Description Throughput The total throughput of the network capture in bytes.
Packet Types
This region does not appear on flow sensors.- Packet Types
- This chart shows you when data was sent over the network, broken out by byte
type.
Metric Description Unicast Bytes The number of bytes sent to a single destination on the network. Multicast Bytes The number of bytes sent to a group of devices on the network. Broadcast Bytes The number of bytes sent to every device on the network. - Packet Types
- This chart shows you the total amount of data sent over the network, broken out by
byte type.
Metric Description Unicast Bytes The number of bytes sent to a single destination on the network. Multicast Bytes The number of bytes sent to a group of devices on the network. Broadcast Bytes The number of bytes sent to every device on the network. - Top Multicast Groups - Bytes
- This chart shows you when data was sent to a group of devices over the network, broken
out by multicast group.
Metric Description Unicast Bits The number of bytes sent to a single destination on the network. Multicast Bits The number of bytes sent to a group of devices on the network. Broadcast Bits The number of bytes sent to every device on the network. - Top Multicast Groups - Bytes
- This chart shows you the total amount of data sent to a group of devices over the
network, broken out by multicast group.
Metric Description Unicast Bits The number of bytes sent to a single destination on the network. Multicast Bits The number of bytes sent to a group of devices on the network. Broadcast Bits The number of bytes sent to every device on the network.
Where to look next
Drill down on a metric: You can get more information about a metric by clicking the metric value or name and selecting an option from the Drill down by menu. For example, if you are looking at the total number of errors, click the number and select Servers to see which servers returned the errors.
Search the Metric Explorer: Built-in protocol pages include the most commonly referenced metrics for a protocol, but you can see additional metrics in the Metric Explorer. Click any chart title on a protocol page and select Create chart from.... When the Metric Explorer opens, click Add Metric in the left pane to display a drop-down menu of comprehensive metrics for the device. If you find an interesting metric, click Add to Dashboard to add the metric to a new or existing dashboard.
Create a custom metric: If you want to view a metric that is not included in the Metric Explorer, you can create a custom metric through a trigger. For more information, see the following resources:
Network Packets page
Packet Summary
- Packet Rate
- This chart shows you when packets were sent over the network.
Metric Description Packets The total packets of the network capture. - Maximum Packet Rate
- This chart shows you the highest rate that packets were sent over the network during
the selected time interval.
Metric Description Packets The total packets of the network capture. - Average Packet Rate
- This chart shows you the average rate that packets were sent over the network during
the selected time interval.
Metric Description Packets The total packets of the network capture.
L7 Protocols
- Top L7 Protocols - Packets
- This chart shows you when packets were sent over the network, broken out by L7
protocol.
Metric Description Packets by L7 Protocol The packet count for a specific L7 protocol within the currently selected network. L7 protocols support communication at the application level. - Top L7 Protocols - Packets
- This chart shows you the total number of packets sent over the network, broken out by
L7 protocol.
Metric Description Packets by L7 Protocol The packet count for a specific L7 protocol within the currently selected network. L7 protocols support communication at the application level.
IP Protocols
- Top IP Protocols - Packets
- This chart shows you when packets were sent over the network, broken out by IP
protocol.
Metric Description Packets The total packets of the network capture. - Top IP Protocols - Packets
- This chart shows you the total number of packets sent over the network, broken out by
IP protocol.
Metric Description Packets The total packets of the network capture. - Packet Fragmentation
- This chart shows you when IP datagrams that were sent over the network were fragmented
in transit and required reassembly. This chart does not appear on flow sensors.
Metric Description IP Fragments The total packets of the network capture. - Packet Fragmentation
- This chart shows you how many IP datagrams that were sent over the network were
fragmented in transit and required reassembly. This chart does not appear on flow
sensors.
Metric Description IP Fragments The total number of sent and received IP fragments. IP fragmentation occurs when an IP datagram is larger than the current maximum transmission unit (MTU). To enable the packet to send, the sender breaks the datagram into smaller pieces called fragments, each with its own header information. If you see a sustained spike in this number, make sure that devices are sending expected traffic and that MTU settings are not too low.
DSCP Types (Quality of Service)
This region does not appear on flow sensors.- Top DSCP Types - Packets
- This chart shows you when packets were sent over the network, broken out by
differentiated services code point (DSCP) type.
Metric Description Packets The total packets of the network capture. - Top DSCP Types -Packets
- This chart shows you the total number of packets sent over the network, broken out by
DSCP type.
Metric Description Packets The total packets of the network capture.
Packet Types
This region does not appear on flow sensors.- Packet Types
- This chart shows you when packets were sent over the network, broken out by packet
type.
Metric Description Unicast Packets The number of information packets sent to a single destination on the network. Multicast Packets The number of information packets sent to a group of devices on the network. Broadcast Packets The number of information packets sent to every device on the network. - Packet Types
- This chart shows you the total number of packets sent over the network, broken out by
packet type.
Metric Description Unicast Packets The number of information packets sent to a single destination on the network. Multicast Packets The number of information packets sent to a group of devices on the network. Broadcast Packets The number of information packets sent to every device on the network. - Top Multicast Groups - Packets
- This chart shows you when packets were sent to a group of devices on the network,
broken out by multicast group.
Metric Description Multicast Packets The number of information packets sent to a group of devices on the network. - Top Multicast Groups - Packets
- This chart shows you the total number of packets that were sent to a group of devices
on the network, broken out by multicast group.
Metric Description Multicast Packets The number of information packets sent to a group of devices on the network.
Where to look next
Drill down on a metric: You can get more information about a metric by clicking the metric value or name and selecting an option from the Drill down by menu. For example, if you are looking at the total number of errors, click the number and select Servers to see which servers returned the errors.
Search the Metric Explorer: Built-in protocol pages include the most commonly referenced metrics for a protocol, but you can see additional metrics in the Metric Explorer. Click any chart title on a protocol page and select Create chart from.... When the Metric Explorer opens, click Add Metric in the left pane to display a drop-down menu of comprehensive metrics for the device. If you find an interesting metric, click Add to Dashboard to add the metric to a new or existing dashboard.
Create a custom metric: If you want to view a metric that is not included in the Metric Explorer, you can create a custom metric through a trigger. For more information, see the following resources:
Network frames page
Frame Sizes
- Frame Sizes
- This chart shows you when frames were sent over the network, broken out by frame
size.
Metric Description 64-Byte Frames The number of L2 Ethernet frames containing a maximum of 64 bytes of payload. 128-Byte Frames The number of L2 Ethernet frames containing a maximum of 128 bytes of payload. 256-Byte Frames The number of L2 Ethernet frames containing a maximum of 256 bytes of payload. 512-Byte Frames The number of L2 Ethernet frames containing a maximum of 512 bytes of payload. 1024-Byte Frames The number of L2 Ethernet frames containing a maximum of 1024 bytes of payload. 1513-Byte Frames The number of L2 Ethernet frames containing a maximum of 1513 bytes of payload. 1518-Byte Frames The number of L2 Ethernet frames containing a maximum of 1518 bytes of payload. Jumbo Frames The number of L2 Ethernet frames containing more than 1500 and up to 9000 bytes of payload. - Frame Sizes
- This chart shows you the total number of frames that were sent over the network,
broken out by frame size.
Metric Description 64-Byte Frames The number of L2 Ethernet frames containing a maximum of 64 bytes of payload. 128-Byte Frames The number of L2 Ethernet frames containing a maximum of 128 bytes of payload. 256-Byte Frames The number of L2 Ethernet frames containing a maximum of 256 bytes of payload. 512-Byte Frames The number of L2 Ethernet frames containing a maximum of 512 bytes of payload. 1024-Byte Frames The number of L2 Ethernet frames containing a maximum of 1024 bytes of payload. 1513-Byte Frames The number of L2 Ethernet frames containing a maximum of 1513 bytes of payload. 1518-Byte Frames The number of L2 Ethernet frames containing a maximum of 1518 bytes of payload. Jumbo Frames The number of L2 Ethernet frames containing more than 1500 and up to 9000 bytes of payload.
Frame Types
- Frame Types
- This chart shows you when frames were sent over the network, broken out by frame
size.
Metric Description ARP Frames An Ethernet frame containing an Address Resolution Protocol (ARP) datagram. ARP is a link-level protocol used for resolving IP addresses into MAC addresses. IEEE 802.1x Frames An Ethernet frame defined by port-based network access control (PNAC). IEEE 802.1x provides an authentication mechanism to devices that attach to a LAN or WLAN. IPv4 Frames An Ethernet frame containing an Internet Protocol version 4 (IPv4) datagram. IPv6 Frames An Ethernet frame containing an Internet Protocol version 6 (IPv6) datagram. IPX Frames An Ethernet frame containing an Internetwork Packet Exchange (IPX) datagram. IPX is a networking protocol that interconnects networks that use Novell's NetWare clients and servers. LACP Frames An Ethernet frame containing a Link Aggregation Control Protocol (LACP) datagram. LACP controls the bundling of several physical ports to form a single logical channel. MPLS Frames An Ethernet frame containing a Multiprotocol Label Switching (MPLS) datagram. MPLS is a packet-forwarding technology that uses labels to make data forwarding decisions. It is frequently used to enable the following network services: Virtual Private Networking (VPN), Traffic Engineering (TE), and Quality of Service (QoS). Other Frames An Ethernet frame containing an unspecified datagram. STP Frames An Ethernet frame containing a Spanning Tree Protocol (STP) datagram. STP creates a spanning tree within a network of connected L2 bridges and disables links that are not part of the spanning tree, leaving a single active path between any two network nodes. - Frame Types
- This chart shows you the total number of frames that were sent over the network,
broken out by frame type.
Metric Description ARP Frames An Ethernet frame containing an Address Resolution Protocol (ARP) datagram. ARP is a link-level protocol used for resolving IP addresses into MAC addresses. IEEE 802.1x Frames An Ethernet frame defined by port-based network access control (PNAC). IEEE 802.1x provides an authentication mechanism to devices that attach to a LAN or WLAN. IPv4 Frames An Ethernet frame containing an Internet Protocol version 4 (IPv4) datagram. IPv6 Frames An Ethernet frame containing an Internet Protocol version 6 (IPv6) datagram. IPX Frames An Ethernet frame containing an Internetwork Packet Exchange (IPX) datagram. IPX is a networking protocol that interconnects networks that use Novell's NetWare clients and servers. LACP Frames An Ethernet frame containing a Link Aggregation Control Protocol (LACP) datagram. LACP controls the bundling of several physical ports to form a single logical channel. MPLS Frames An Ethernet frame containing a Multiprotocol Label Switching (MPLS) datagram. MPLS is a packet-forwarding technology that uses labels to make data forwarding decisions. It is frequently used to enable the following network services: Virtual Private Networking (VPN), Traffic Engineering (TE), and Quality of Service (QoS). Other Frames An Ethernet frame containing an unspecified datagram. STP Frames An Ethernet frame containing a Spanning Tree Protocol (STP) datagram. STP creates a spanning tree within a network of connected L2 bridges and disables links that are not part of the spanning tree, leaving a single active path between any two network nodes. - VLAN Tagged Frames
- This chart shows you when frames containing VLAN tags were sent over the
network.
Metric Description VLAN Tagged The number of frames containing VLAN tags observed. - VLAN Tagged Frames
- This chart shows you how many frames containing VLAN tags were sent over the network
during the selected time interval.
Metric Description VLAN Tagged The number of frames containing VLAN tags observed.
Where to look next
Drill down on a metric: You can get more information about a metric by clicking the metric value or name and selecting an option from the Drill down by menu. For example, if you are looking at the total number of errors, click the number and select Servers to see which servers returned the errors.
Search the Metric Explorer: Built-in protocol pages include the most commonly referenced metrics for a protocol, but you can see additional metrics in the Metric Explorer. Click any chart title on a protocol page and select Create chart from.... When the Metric Explorer opens, click Add Metric in the left pane to display a drop-down menu of comprehensive metrics for the device. If you find an interesting metric, click Add to Dashboard to add the metric to a new or existing dashboard.
Create a custom metric: If you want to view a metric that is not included in the Metric Explorer, you can create a custom metric through a trigger. For more information, see the following resources:
VLAN Overview page
VLAN Properties
- Name
- The primary name for the VLAN.
- Parent Network
- The primary name for the parent network of the VLAN.
- Description
- A user-defined description of the VLAN.
- Type
- The type of network.
- API ID
- The ID that identifies the VLAN in the REST API.
VLAN Overview
This region does not appear on flow sensors.- Average Throughput
- This chart shows you the average rate that data was sent over the VLAN over time,
measured in bits.
Metric Description Throughput The total throughput of the network capture in bytes. - Total Traffic
- This chart shows you the total amount of data that was sent over the VLAN during the
selected time interval.
Metric Description Throughput The total throughput of the network capture in bytes. - Average Throughput
- This chart shows you the average rate that data was sent over the VLAN during the
selected time interval.
Metric Description Throughput The total throughput of the network capture in bytes.
L7 Protocols
- Top L7 Protocols
- This chart shows you when data was sent over the VLAN, broken out by L7
protocol.
Metric Description Bytes by L7 Protocol The byte count for a specific L7 protocol within the currently selected VLAN. L7 protocols support communication at the application level. - Top L7 Protocols
- This chart shows you the total amount of data sent over the VLAN, broken out by L7
protocol.
Metric Description Bytes by L7 Protocol The byte count for a specific L7 protocol within the currently selected VLAN. L7 protocols support communication at the application level.
IP Protocols
This region does not appear on flow sensors.- Top IP Protocols
- This chart shows you when data was sent over the VLAN, broken out by IP
protocol.
Metric Description Bytes by IP Protocol The incoming and outgoing byte count for each L3 protocol type. - Top IP Protocols
- This chart shows you the total amount of data sent over the VLAN, broken out by IP
protocol.
Metric Description Bytes by IP Protocol The incoming and outgoing byte count for each L3 protocol type. - Packet Fragmentation
- This chart shows you when IP datagrams that were sent over the VLAN were fragmented in
transit and required reassembly.
Metric Description IP Fragments The total number of sent and received IP fragments. IP fragmentation occurs when an IP datagram is larger than the current maximum transmission unit (MTU). To enable the packet to send, the sender breaks the datagram into smaller pieces called fragments, each with its own header information. If you see a sustained spike in this number, make sure that devices are sending expected traffic and that MTU settings are not too low. - Packet Fragmentation
- This chart shows you how many IP datagrams that were sent over the VLAN were
fragmented in transit and required reassembly.
Metric Description IP Fragments The total number of sent and received IP fragments. IP fragmentation occurs when an IP datagram is larger than the current maximum transmission unit (MTU). To enable the packet to send, the sender breaks the datagram into smaller pieces called fragments, each with its own header information. If you see a sustained spike in this number, make sure that devices are sending expected traffic and that MTU settings are not too low.
DSCP Types (Quality of Service)
This region does not appear on flow sensors.- Top DSCP Types
- This chart shows you when data was sent over the VLAN, broken out by differentiated
services code point (DSCP) type.
Metric Description Throughput The total throughput of the network capture in bytes. - Top DSCP Types
- This chart shows you the total amount of data sent over the VLAN, broken out by DSCP
type.
Metric Description Throughput The total throughput of the network capture in bytes.
Packet Types
This region does not appear on flow sensors.- Packet Types
- This chart shows you when data was sent over the VLAN, broken out by byte type.
Metric Description Unicast Bytes The number of bytes sent to a single destination on the network. Multicast Bytes The number of bytes sent to a group of devices on the network. Broadcast Bytes The number of bytes sent to every device on the network. - Packet Types
- This chart shows you the total amount of data sent over the VLAN, broken out by byte
type.
Metric Description Unicast Bytes The number of bytes sent to a single destination on the network. Multicast Bytes The number of bytes sent to a group of devices on the network. Broadcast Bytes The number of bytes sent to every device on the network. - Top Multicast Groups - Bitrate
- This chart shows you when data was sent to a group of devices over the VLAN, broken
out by multicast group.
Metric Description Unicast Bits The number of bytes sent to a single destination on the network. Multicast Bits The number of bytes sent to a group of devices on the network. Broadcast Bits The number of bytes sent to every device on the network. - Top Multicast Groups - Bytes
- This chart shows you the total amount of data sent to a group of devices over the
VLAN, broken out by multicast group.
Metric Description Unicast Bits The number of bytes sent to a single destination on the network. Multicast Bits The number of bytes sent to a group of devices on the network. Broadcast Bits The number of bytes sent to every device on the network.
Where to look next
Drill down on a metric: You can get more information about a metric by clicking the metric value or name and selecting an option from the Drill down by menu. For example, if you are looking at the total number of errors, click the number and select Servers to see which servers returned the errors.
Search the Metric Explorer: Built-in protocol pages include the most commonly referenced metrics for a protocol, but you can see additional metrics in the Metric Explorer. Click any chart title on a protocol page and select Create chart from.... When the Metric Explorer opens, click Add Metric in the left pane to display a drop-down menu of comprehensive metrics for the device. If you find an interesting metric, click Add to Dashboard to add the metric to a new or existing dashboard.
Create a custom metric: If you want to view a metric that is not included in the Metric Explorer, you can create a custom metric through a trigger. For more information, see the following resources:
VLAN Packets page
Packet Summary
This region does not appear on flow sensors.- Packet Rate
- This chart shows you when packets were sent over the VLAN.
Metric Description Packets The total packets of the network capture. - Total Packets
- This chart shows you the total number of packets that were sent over the VLAN during
the selected time interval.
Metric Description Packets The total packets of the network capture. - Average Packet Rate
- This chart shows you the average rate that packets were sent over the VLAN during the
selected time interval.
Metric Description Packets The total packets of the network capture.
L7 Protocols
- Top L7 Protocols - Packets
- This chart shows you when packets were sent over the VLAN, broken out by L7
protocol.
Metric Description Packets by L7 Protocol The packet count for a specific L7 protocol within the currently selected network. L7 protocols support communication at the application level. - Top L7 Protocols - Packets
- This chart shows you the total number of packets sent over the VLAN, broken out by L7
protocol.
Metric Description Packets by L7 Protocol The packet count for a specific L7 protocol within the currently selected network. L7 protocols support communication at the application level.
IP Protocols
This region does not appear on flow sensors.- Top IP Protocols - Packets
- This chart shows you when packets were sent over the VLAN, broken out by IP
protocol.
Metric Description Packets The total packets of the network capture. - Top IP Protocols - Packets
- This chart shows you the total number of packets sent over the VLAN, broken out by IP
protocol.
Metric Description Packets The total packets of the network capture. - Packet Fragmentation
- This chart shows you when IP datagrams that were sent over the VLAN were fragmented in
transit and required reassembly.
Metric Description IP Fragments The total packets of the network capture. - Packet Fragmentation
- This chart shows you how many IP datagrams that were sent over the VLAN were
fragmented in transit and required reassembly.
Metric Description IP Fragments The total number of sent and received IP fragments. IP fragmentation occurs when an IP datagram is larger than the current maximum transmission unit (MTU). To enable the packet to send, the sender breaks the datagram into smaller pieces called fragments, each with its own header information. If you see a sustained spike in this number, make sure that devices are sending expected traffic and that MTU settings are not too low.
DSCP Types (Quality of Service)
This region does not appear on flow sensors.- Top DSCP Types - Packets
- This chart shows you when packets were sent over the VLAN, broken out by
differentiated services code point (DSCP) type.
Metric Description Packets The total packets of the network capture. - Top DSCP Types -Packets
- This chart shows you the total number of packets sent over the VLAN, broken out by
DSCP type.
Metric Description Packets The total packets of the network capture.
Packet Types
This region does not appear on flow sensors.- Packet Types
- This chart shows you when packets were sent over the VLAN, broken out by packet
type.
Metric Description Unicast Packets The number of information packets sent to a single destination on the network. Multicast Packets The number of information packets sent to a group of devices on the network. Broadcast Packets The number of information packets sent to every device on the network. - Packet Types
- This chart shows you the total number of packets sent over the VLAN, broken out by
packet type.
Metric Description Unicast Packets The number of information packets sent to a single destination on the network. Multicast Packets The number of information packets sent to a group of devices on the network. Broadcast Packets The number of information packets sent to every device on the network. - Top Multicast Groups - Packets
- This chart shows you when packets were sent to a group of devices on the VLAN, broken
out by multicast group.
Metric Description Multicast Packets The number of information packets sent to a group of devices on the network. - Top Multicast Groups - Packets
- This chart shows you the total number of packets that were sent to a group of devices
on the VLAN, broken out by multicast group.
Metric Description Multicast Packets The number of information packets sent to a group of devices on the network.
Where to look next
Drill down on a metric: You can get more information about a metric by clicking the metric value or name and selecting an option from the Drill down by menu. For example, if you are looking at the total number of errors, click the number and select Servers to see which servers returned the errors.
Search the Metric Explorer: Built-in protocol pages include the most commonly referenced metrics for a protocol, but you can see additional metrics in the Metric Explorer. Click any chart title on a protocol page and select Create chart from.... When the Metric Explorer opens, click Add Metric in the left pane to display a drop-down menu of comprehensive metrics for the device. If you find an interesting metric, click Add to Dashboard to add the metric to a new or existing dashboard.
Create a custom metric: If you want to view a metric that is not included in the Metric Explorer, you can create a custom metric through a trigger. For more information, see the following resources:
VLAN Frames page
Frame Sizes
- Frame Sizes
- This chart shows you when frames were sent over the VLAN, broken out by frame
size.
Metric Description 64-Byte Frames The number of L2 Ethernet frames containing a maximum of 64 bytes of payload. 128-Byte Frames The number of L2 Ethernet frames containing a maximum of 128 bytes of payload. 256-Byte Frames The number of L2 Ethernet frames containing a maximum of 256 bytes of payload. 512-Byte Frames The number of L2 Ethernet frames containing a maximum of 512 bytes of payload. 1024-Byte Frames The number of L2 Ethernet frames containing a maximum of 1024 bytes of payload. 1513-Byte Frames The number of L2 Ethernet frames containing a maximum of 1513 bytes of payload. 1518-Byte Frames The number of L2 Ethernet frames containing a maximum of 1518 bytes of payload. Jumbo Frames The number of L2 Ethernet frames containing more than 1500 and up to 9000 bytes of payload. - Frame Sizes
- This chart shows you the total number of frames that were sent over the VLAN, broken
out by frame size.
Metric Description 64-Byte Frames The number of L2 Ethernet frames containing a maximum of 64 bytes of payload. 128-Byte Frames The number of L2 Ethernet frames containing a maximum of 128 bytes of payload. 256-Byte Frames The number of L2 Ethernet frames containing a maximum of 256 bytes of payload. 512-Byte Frames The number of L2 Ethernet frames containing a maximum of 512 bytes of payload. 1024-Byte Frames The number of L2 Ethernet frames containing a maximum of 1024 bytes of payload. 1513-Byte Frames The number of L2 Ethernet frames containing a maximum of 1513 bytes of payload. 1518-Byte Frames The number of L2 Ethernet frames containing a maximum of 1518 bytes of payload. Jumbo Frames The number of L2 Ethernet frames containing more than 1500 and up to 9000 bytes of payload.
Frame Types
- Frame Types
- This chart shows you when frames were sent over the VLAN, broken out by frame
size.
Metric Description ARP Frames An Ethernet frame containing an Address Resolution Protocol (ARP) datagram. ARP is a link-level protocol used for resolving IP addresses into MAC addresses. IEEE 802.1x Frames An Ethernet frame defined by port-based network access control (PNAC). IEEE 802.1x provides an authentication mechanism to devices that attach to a LAN or WLAN. IPv4 Frames An Ethernet frame containing an Internet Protocol version 4 (IPv4) datagram. IPv6 Frames An Ethernet frame containing an Internet Protocol version 6 (IPv6) datagram. IPX Frames An Ethernet frame containing an Internetwork Packet Exchange (IPX) datagram. IPX is a networking protocol that interconnects networks that use Novell's NetWare clients and servers. LACP Frames An Ethernet frame containing a Link Aggregation Control Protocol (LACP) datagram. LACP controls the bundling of several physical ports to form a single logical channel. MPLS Frames An Ethernet frame containing a Multiprotocol Label Switching (MPLS) datagram. MPLS is a packet-forwarding technology that uses labels to make data forwarding decisions. It is frequently used to enable the following network services: Virtual Private Networking (VPN), Traffic Engineering (TE), and Quality of Service (QoS). Other Frames An Ethernet frame containing an unspecified datagram. STP Frames An Ethernet frame containing a Spanning Tree Protocol (STP) datagram. STP creates a spanning tree within a network of connected L2 bridges and disables links that are not part of the spanning tree, leaving a single active path between any two network nodes. - Frame Types
- This chart shows you the total number of frames that were sent over the VLAN, broken
out by frame type.
Metric Description ARP Frames An Ethernet frame containing an Address Resolution Protocol (ARP) datagram. ARP is a link-level protocol used for resolving IP addresses into MAC addresses. IEEE 802.1x Frames An Ethernet frame defined by port-based network access control (PNAC). IEEE 802.1x provides an authentication mechanism to devices that attach to a LAN or WLAN. IPv4 Frames An Ethernet frame containing an Internet Protocol version 4 (IPv4) datagram. IPv6 Frames An Ethernet frame containing an Internet Protocol version 6 (IPv6) datagram. IPX Frames An Ethernet frame containing an Internetwork Packet Exchange (IPX) datagram. IPX is a networking protocol that interconnects networks that use Novell's NetWare clients and servers. LACP Frames An Ethernet frame containing a Link Aggregation Control Protocol (LACP) datagram. LACP controls the bundling of several physical ports to form a single logical channel. MPLS Frames An Ethernet frame containing a Multiprotocol Label Switching (MPLS) datagram. MPLS is a packet-forwarding technology that uses labels to make data forwarding decisions. It is frequently used to enable the following network services: Virtual Private Networking (VPN), Traffic Engineering (TE), and Quality of Service (QoS). Other Frames An Ethernet frame containing an unspecified datagram. STP Frames An Ethernet frame containing a Spanning Tree Protocol (STP) datagram. STP creates a spanning tree within a network of connected L2 bridges and disables links that are not part of the spanning tree, leaving a single active path between any two network nodes.
Where to look next
Drill down on a metric: You can get more information about a metric by clicking the metric value or name and selecting an option from the Drill down by menu. For example, if you are looking at the total number of errors, click the number and select Servers to see which servers returned the errors.
Search the Metric Explorer: Built-in protocol pages include the most commonly referenced metrics for a protocol, but you can see additional metrics in the Metric Explorer. Click any chart title on a protocol page and select Create chart from.... When the Metric Explorer opens, click Add Metric in the left pane to display a drop-down menu of comprehensive metrics for the device. If you find an interesting metric, click Add to Dashboard to add the metric to a new or existing dashboard.
Create a custom metric: If you want to view a metric that is not included in the Metric Explorer, you can create a custom metric through a trigger. For more information, see the following resources:
Flow Network Summary page
Learn about charts on this page:
Charts for a flow network display metric values collected from all of the flow interfaces the flow network contains.
Overview
- Average Throughput
- This chart shows NetFlow throughput over time by showing when bytes were
transmitted.
Metric Description NetFlow Bytes The number of L3 bytes associated with flow technologies. - Throughput
- This chart shows the rate that NetFlow bytes are being transmitted.
Metric Description NetFlow Bytes The number of L3 bytes associated with flow technologies.
Protocols
- Top Protocols (Average Throughput)
- This chart shows which NetFlow protocols were most active over time by
showing the rate that bytes were transmitted, broken out by protocol and
port number.
Metric Description NetFlow Bytes by Protocol and Port The number of packets associated with flow technologies, listed by protocol and port number. - Top Protocols
- This chart shows which NetFlow protocols were most active, broken out by
protocol and port number.
Metric Description NetFlow Bytes by Protocol and Port The number of packets associated with flow technologies, listed by protocol and port number.
Endpoints
- Top Talkers (Average Throughput)
- This chart shows which IP addresses sent and received the most NetFlow data
over time.
Metric Description NetFlow Bytes by IP The number of L3 bytes associated with flow technologies, listed by IP address. - Top Talkers
- This chart shows which IP addresses sent and received the most NetFlow
data.
Metric Description NetFlow Bytes by IP The number of L3 bytes associated with flow technologies, listed by IP address. - Top Senders (Average Throughput)
- This chart shows which IP addresses sent the most NetFlow data over
time.
Metric Description NetFlow Bytes by Sender IP The number of L3 bytes associated with flow technologies, listed by the IP address of the sender. - Top Senders
- This chart shows which IP addresses sent the most NetFlow data.
Metric Description NetFlow Bytes by Sender IP The number of L3 bytes associated with flow technologies, listed by the IP address of the sender. - Top Receivers (Average Throughput)
- This chart shows which IP addresses received the most NetFlow data over
time.
Metric Description NetFlow Bytes by Receiver IP Le nombre d'octets L3 associés avec des technologies de flux, répertoriées par l'adresse IP du récepteur. - Top Receivers
- This chart shows which IP addresses received the most NetFlow data.
Metric Description NetFlow Bytes by Receiver IP Le nombre d'octets L3 associés avec des technologies de flux, répertoriées par l'adresse IP du récepteur. - Top Conversations (Average Throughput)
- This chart shows which IP address pairs exchanged the most NetFlow data over
time.
Metric Description NetFlow Bytes by Conversation The number of L3 bytes associated with flow technologies, listed by the IP addresses of the flow endpoints. - Top Conversations
- This chart shows which IP address pairs exchanged the most NetFlow
data.
Metric Description NetFlow Bytes by Conversation The number of L3 bytes associated with flow technologies, listed by the IP addresses of the flow endpoints.
Where to look next
Drill down on a metric: You can get more information about a metric by clicking the metric value or name and selecting an option from the Drill down by menu. For example, if you are looking at the total number of errors, click the number and select Servers to see which servers returned the errors.
Search the Metric Explorer: Built-in protocol pages include the most commonly referenced metrics for a protocol, but you can see additional metrics in the Metric Explorer. Click any chart title on a protocol page and select Create chart from.... When the Metric Explorer opens, click Add Metric in the left pane to display a drop-down menu of comprehensive metrics for the device. If you find an interesting metric, click Add to Dashboard to add the metric to a new or existing dashboard.
Create a custom metric: If you want to view a metric that is not included in the Metric Explorer, you can create a custom metric through a trigger. For more information, see the following resources:
Metrics Appendix
The following topics provide descriptions of concepts that are common to a number of metrics.
Round Trip Time
RTT metrics are a good indicator of how your network is performing. If you see high transfer or processing times, but the RTT is low, the issue is probably at the device-level. However, if the RTT, processing, and transfer times are all high, network latency might be affecting the transfer and processing times, and the issue might be with the network.
The ExtraHop system calculates the RTT value by measuring the time between the first packet of a request and the acknowledgment from the server, as shown in the following figure:
The RTT metric can help identify the source of the problem because it only measures how long an immediate acknowledgment takes to be sent from the client or server; it does not wait until all packets are delivered.
Learn more about how the ExtraHop system calculates round trip time on the ExtraHop blog.
Software frame deduplication
The ExtraHop system removes duplicate L2 and L3 frames and packets when metrics are collected and aggregated from your network activity by default.
The System Health dashboard contains charts that display L2 and L3 duplicate packets that were removed by the ExtraHop system. Deduplication works across 10Gbps ports by default.
L2 deduplication
L2 deduplication removes identical Ethernet frames, where the Ethernet header and payload must match. The ExtraHop system checks for duplicates and removes only the immediately-previous packet globally if the duplicate arrives within 1 millisecond of the original packet. L2 duplication usually only exists if the exact same packet is seen through the data feed, which is typically related to an issue with port mirroring.
L3 deduplication
L3 deduplication removes TCP or UDP packets with identical IP address ID fields on the same flow, where only the IP packet must match. The contents of any headers that precede the IP header being checked might be different. L3 deduplication currently is supported only for IPv4, not IPv6. The ExtraHop system checks for duplicates and removes only the immediately-previous packet on the flow if the duplicate arrives within 1 millisecond of the original packet and if the packet is traveling in the same direction. For a packet to be deduplicated, there can be no other packets received between the two duplicate packets. In addition, packets must have the same length and the same IP address ID field, and TCP packets also must have the same TCP checksum.
By default, flows across VLANs is enabled, and since L3 deduplication operates on a per-flow basis, L3 deduplication removes the same packet traversing different VLANs. L3 deduplication is often the result of mirroring the same traffic across multiple interfaces of the same router, and this traffic can show up as extraneous TCP retransmissions in the ExtraHop system.
Thank you for your feedback. Can we contact you to ask follow up questions?