Detections
The ExtraHop system applies machine learning techniques and rule-based monitoring to your wire data to identify unusual behaviors and potential risks to the security and performance of your network.
Before you begin
Users must be granted privileges to view detections.When anomalous behavior is identified, the ExtraHop system generates a detection and displays the available data and options. Controls on the Detections page help you group, filter, and sort your view of detections, so you can quickly triage issues with critical systems first.
- Collect high-quality, actionable data to find the root causes behind network issues.
- Find unknown issues with performance, security, or infrastructure.
- Identify malicious behavior that is associated with different attack categories or MITRE techniques.
- View related detections or create your own investigation to group detections and track potential attack campaigns.
- Flag suspicious IP addresses, hostnames, and URIs identified by threat intelligence.
| Important: | Although detections can inform you about security risks and performance issues, detections do not replace decision-making or expertise about your network. Always review security and performance detections to determine the root cause of unusual behavior and when to take action. |
Navigating detections
Detection cards appear in a sortable list that can be further grouped and filtered by multiple criteria on the main Detections page. Click any detection card to navigate to the detection detail page.
Detection cards
Each detection card identifies the cause of the detection, the detection category, when the detection occurred, and the victim and offender participants. Security detections include a risk score.
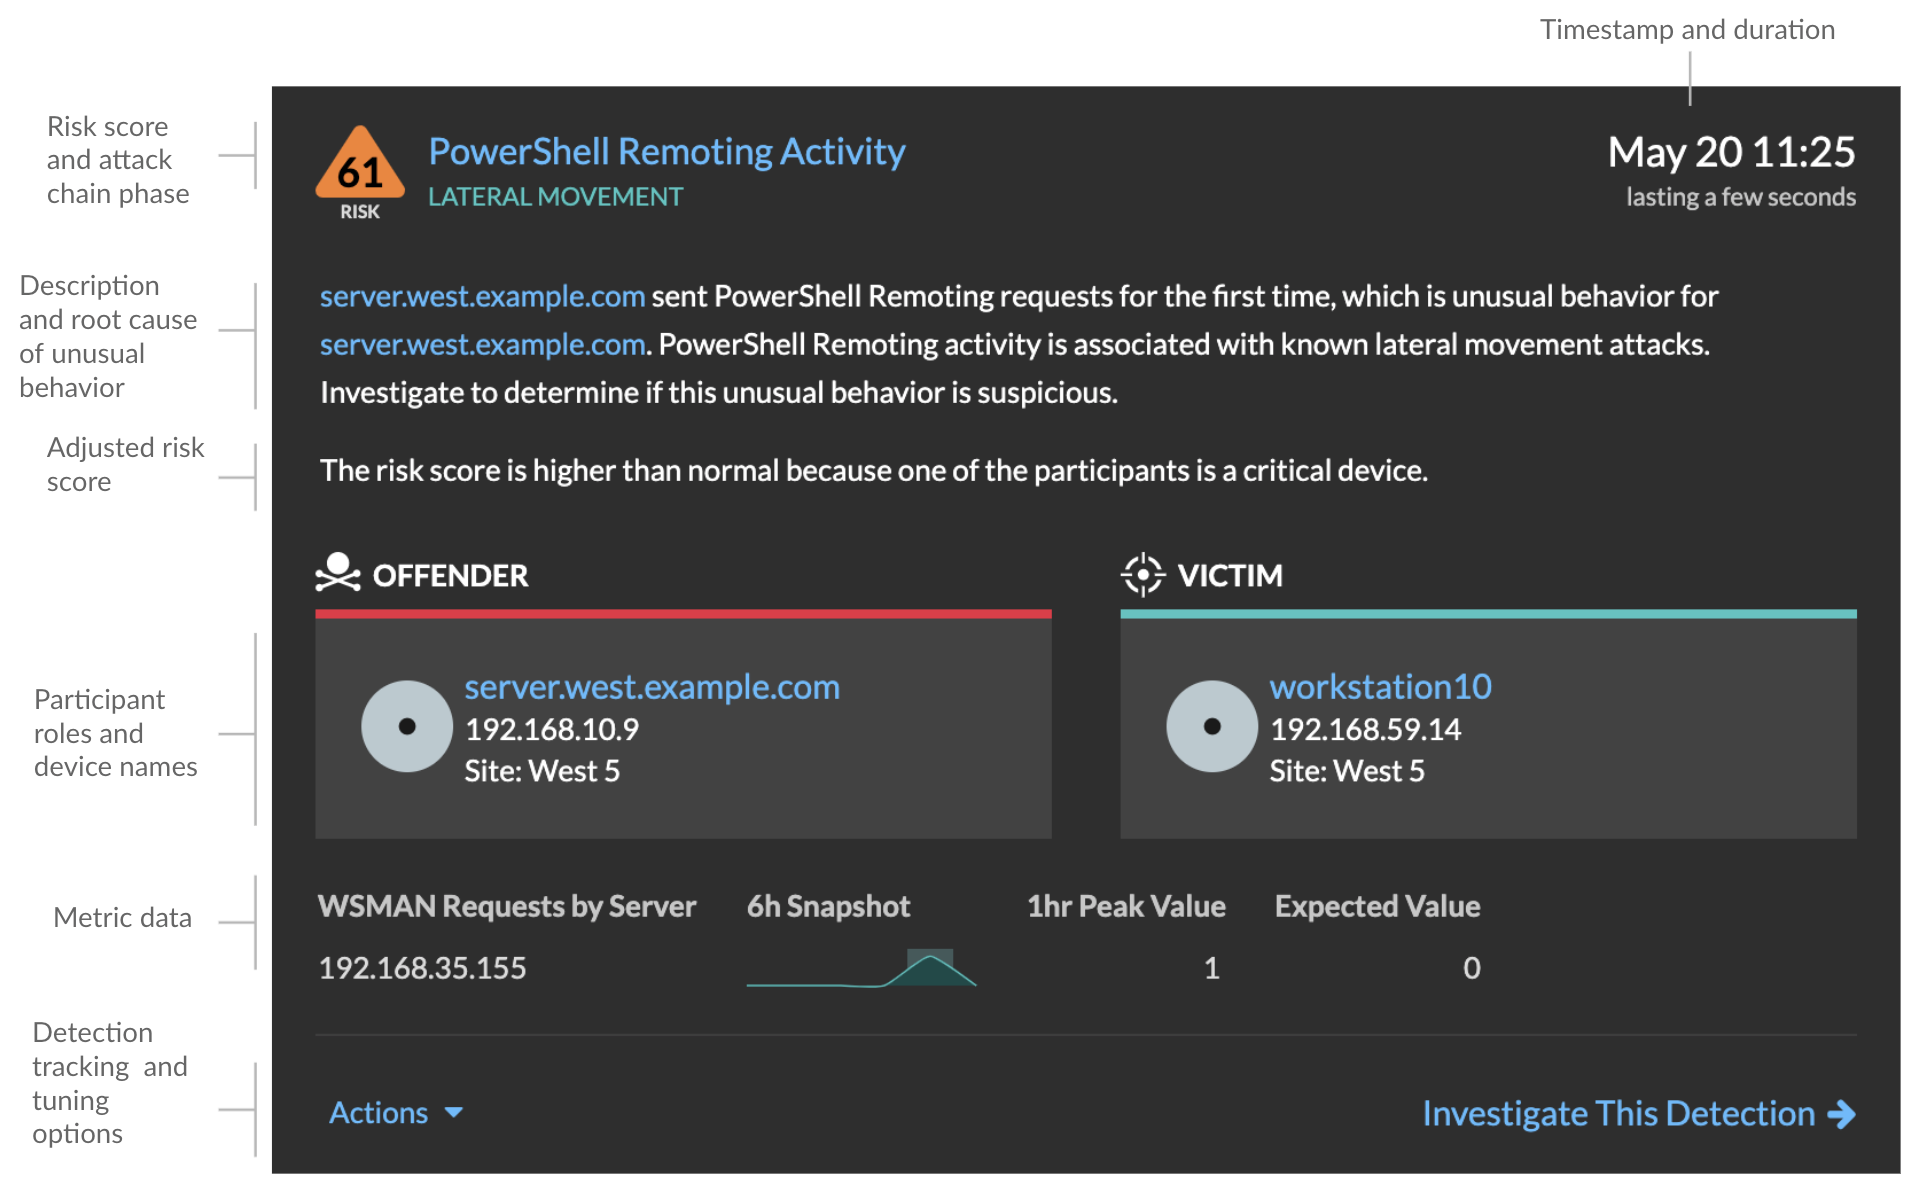
- Risk score
- Measures the likelihood, complexity, and business impact of a security detection. This score provides an estimate based on factors about the frequency and availability of certain attack vectors against the necessary skill levels of a potential hacker and the consequences of a successful attack. The icon is color coded by severity as red (80-99), orange (31-79), or yellow (1-30).
- Participants
- Identifies each participant (offender and victim) involved in the detection by
hostname or IP address. Hover over a participant to view basic details and access links.
Internal endpoints display a link to the Device Overview page; external endpoints
display the geolocation of the IP address and links to the ARIN Whois website and IP
address detail page.
When grouping the Detection page by Types, a participant summary appears under the detection type that breaks down detections by offender and victim and enables you to quickly apply participant filters.
When grouping the Detection page by Sources, internal device role icons are highlighted red if the device was an offender in a detection and teal if the device was a victim. You can click Details under the source name to view a summary of detections where that source was a participant. These device details are displayed next to the detection card on wide screens (1900 pixels or greater).
- Duration
- Identifies how long the unusual behavior was detected or displays ONGOING if the behavior is currently occurring. The minimum duration of a detection is 30 seconds.
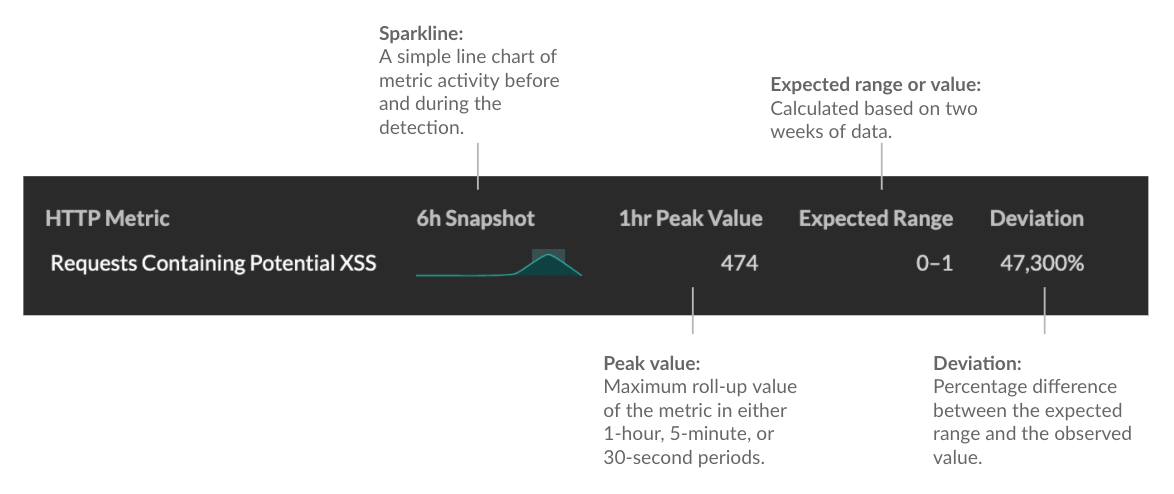
- Metric data
- Identifies additional metric data when the unusual behavior is associated with a
specific metric or key. If metric data is unavailable for the detection, the type of
anomalous protocol activity appears.
- Detection management
- You can track or tune the detection from the Actions dropdown list, or click View Detection Details to navigate to the detection detail page.
Detection detail page
Most of the data that you need to understand and validate a detection appears on the detection detail page: tables of relevant metric data, record transactions, and links to raw packets.
The detection card information is followed by all available sections for the detection. These sections vary depending on the type of the detection.
- Decryption badge
- When the ExtraHop system identifies suspicious behavior or a potential attack in
decrypted traffic records, the detection detail page displays a decryption badge to the
right of the detection name.
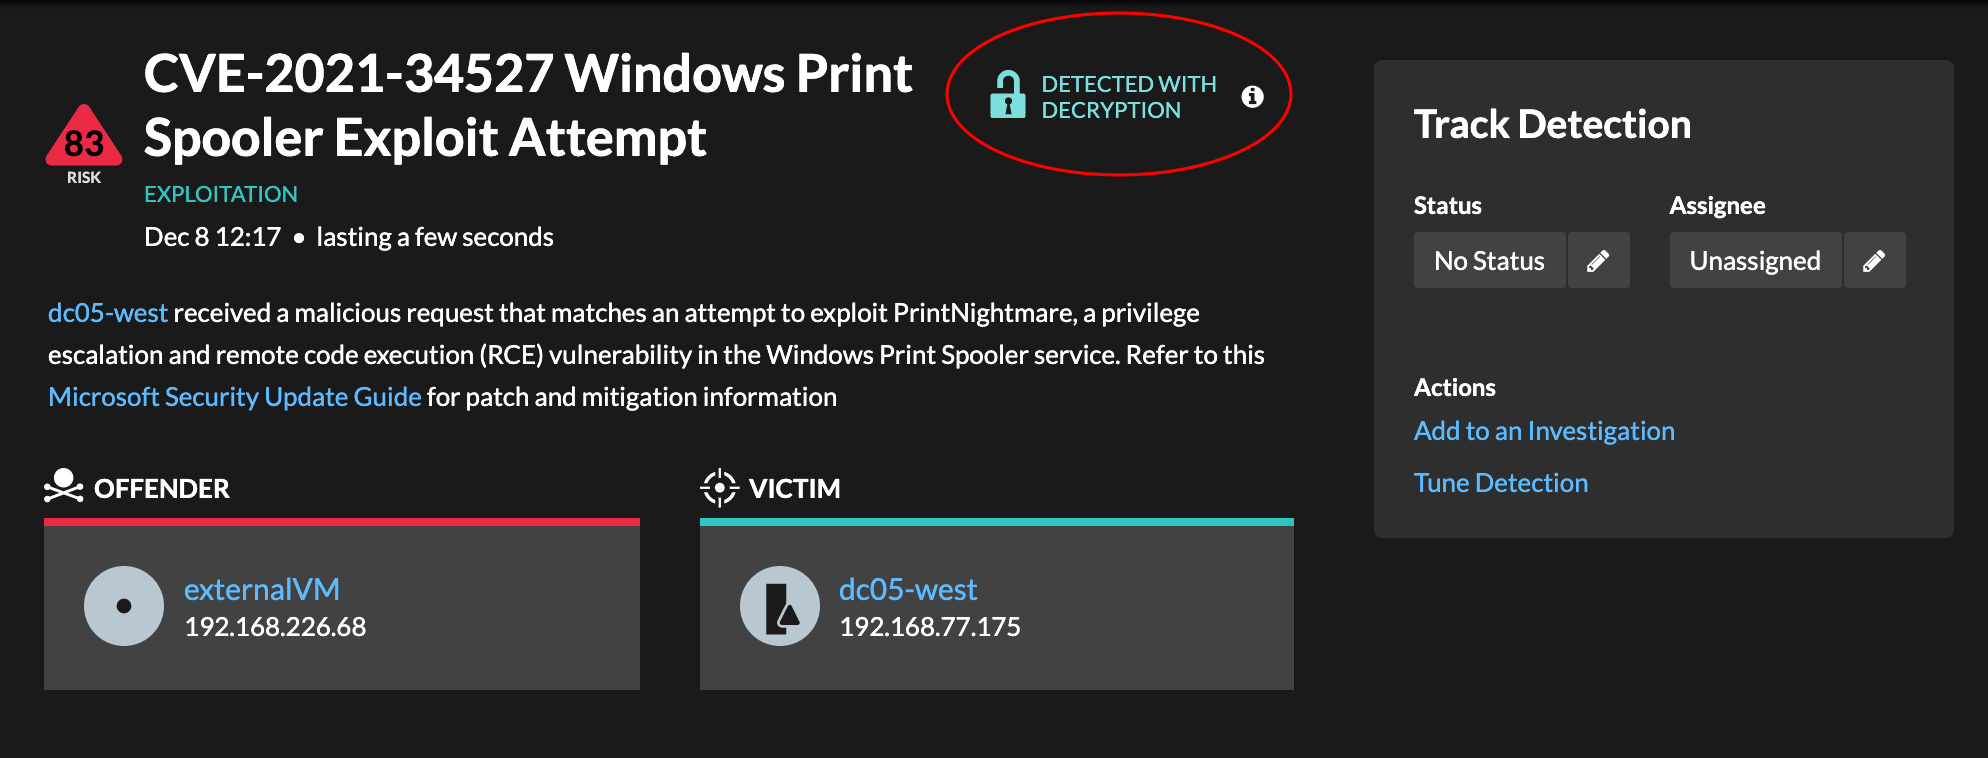
Learn more about SSL/TLS decryption and decrypting traffic with a Windows domain controller.
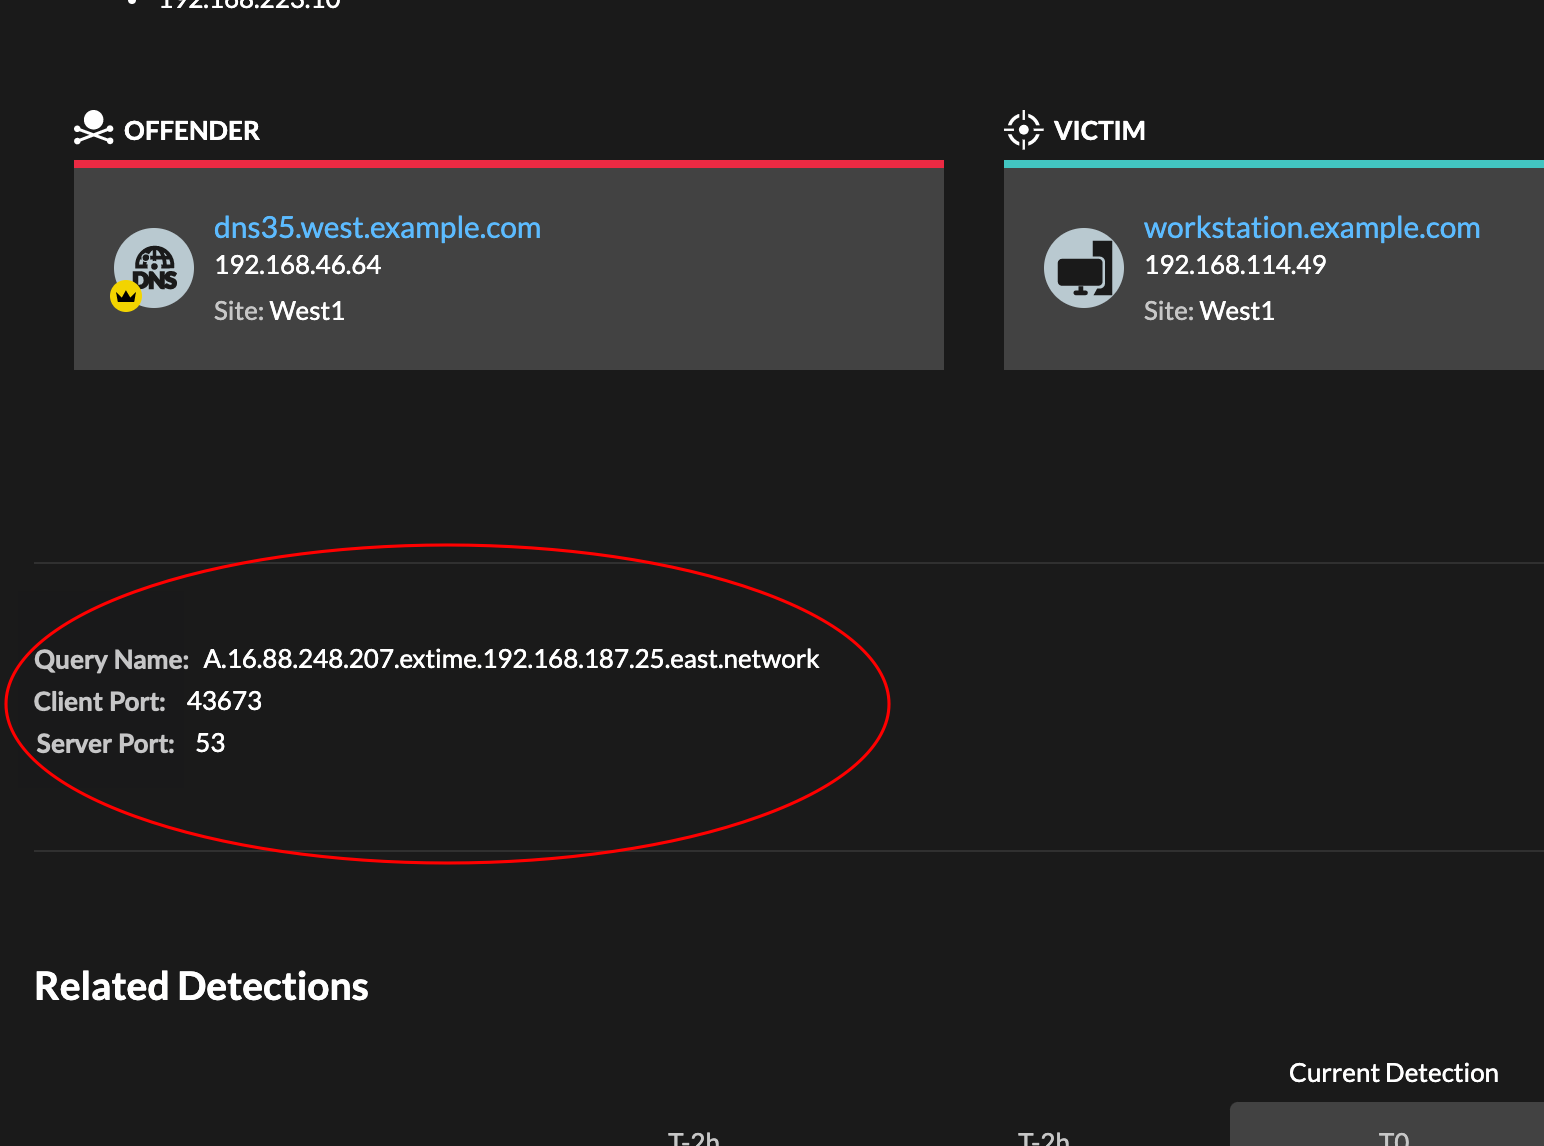
- Detection properties
- Provides a list of properties that are relevant to the detection. For example,
detection properties can include a query, URI, or hacking tool that is central to the
detection.
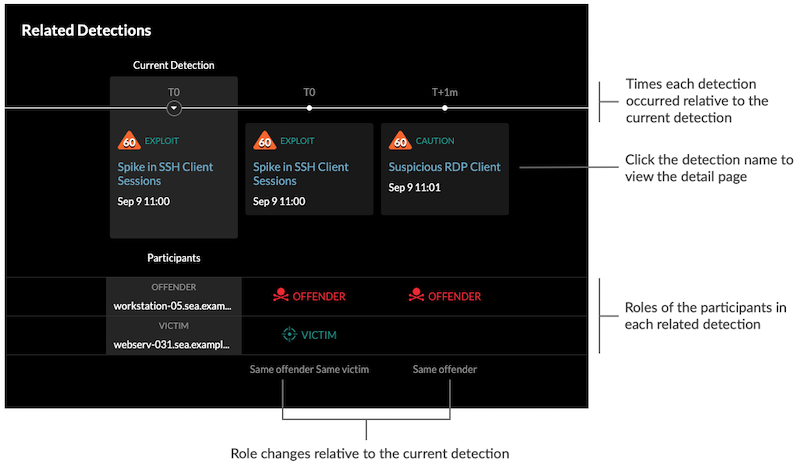
- Related detections
- Provides a timeline of detections related to the current detection that can help you
identify a larger attack campaign. Related detections include the participant role,
duration, timestamp, and any role changes if the offender in one detection becomes the
victim in a different detection. Click any related detection in the timeline to view the
details page for that detection.
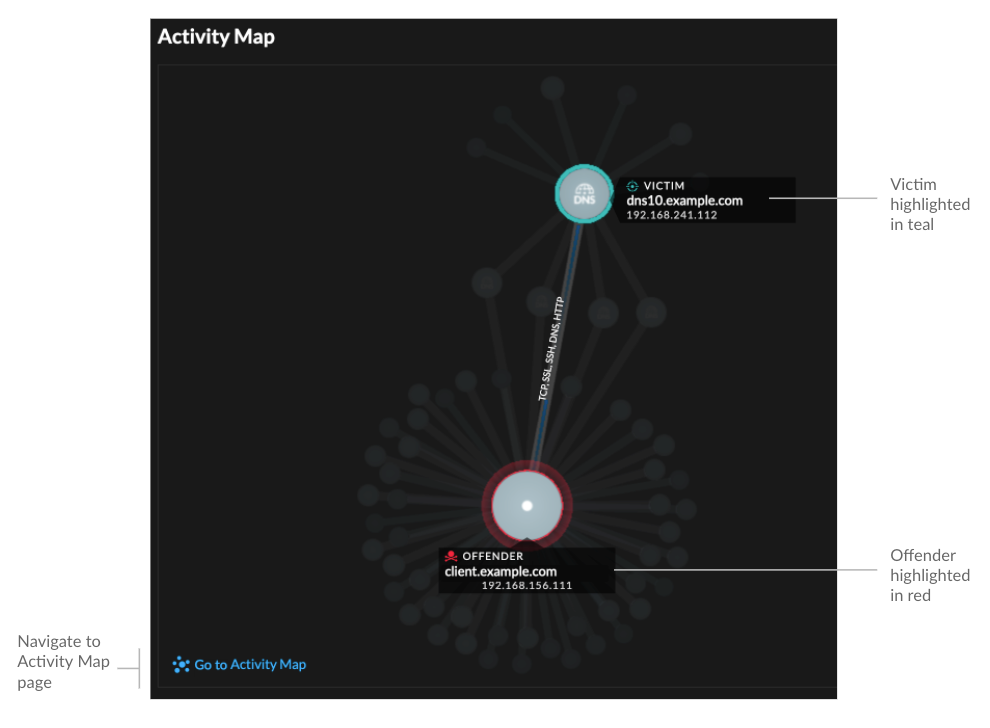
- Activity map
-
Provides an activity map that highlights the participants involved in the detection. The activity map displays east-west traffic of the protocol associated with the detection to help you assess the scope of malicious activity. Click the victim or offender to access a drop-down menu with links to the Device Overview page and other detections where the device is a participant.
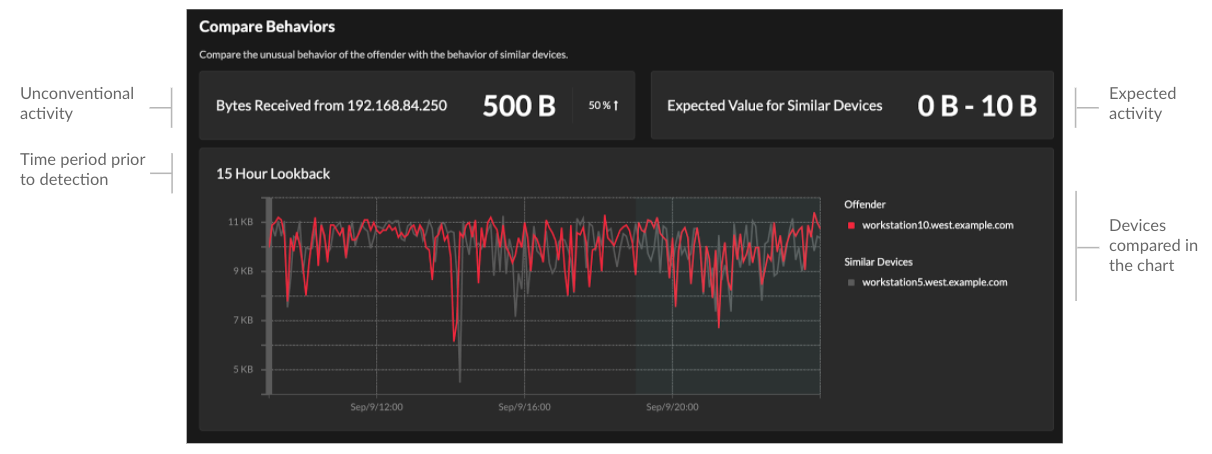
- Compare behaviors
-
Provides a chart that displays the activity of the offender next to the activity of similar devices over the time period when the detection occurred. The chart appears for detections related to unconventional activity by a device, and highlights unexpected behavior by displaying it next to the behavior of devices on the network with similar properties.
- Detection data and links
- Provides all available data about the detection, such as metrics from the targeted
servers and clients and their record
transactions. Click the icon
 to view the raw packets associated with the detection.
 - Detection details
- Provides an expanded description of the detection, such as associated MITRE
techniques, risk factors, attack backgrounds and diagrams, mitigation options, and
reference links to security organizations such as MITRE.
These details are displayed next to the detection card on wide screens (1900 pixels or greater), or you can access them by clicking Details under the detection title when grouping the Detection page by Types.
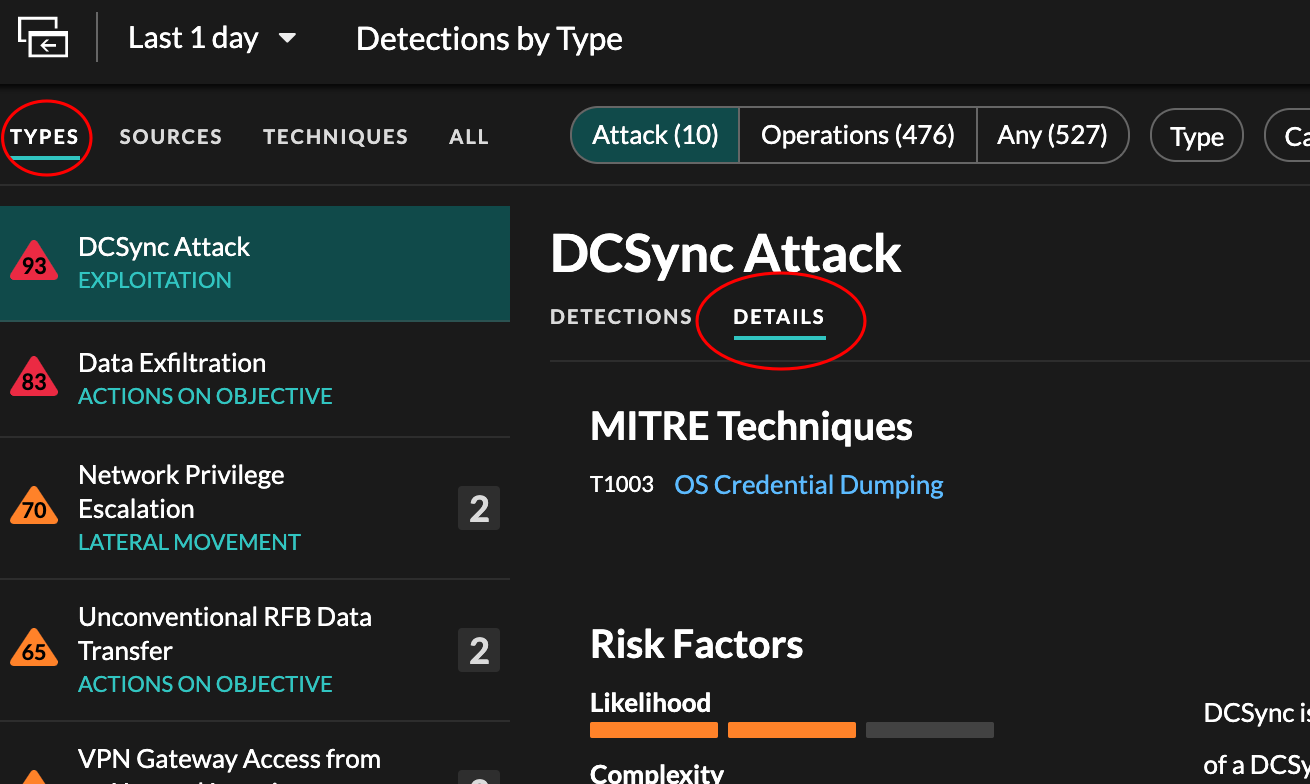
Tip: You can share detection detail pages with other ExtraHop users.
Grouping, filtering, and sorting detections
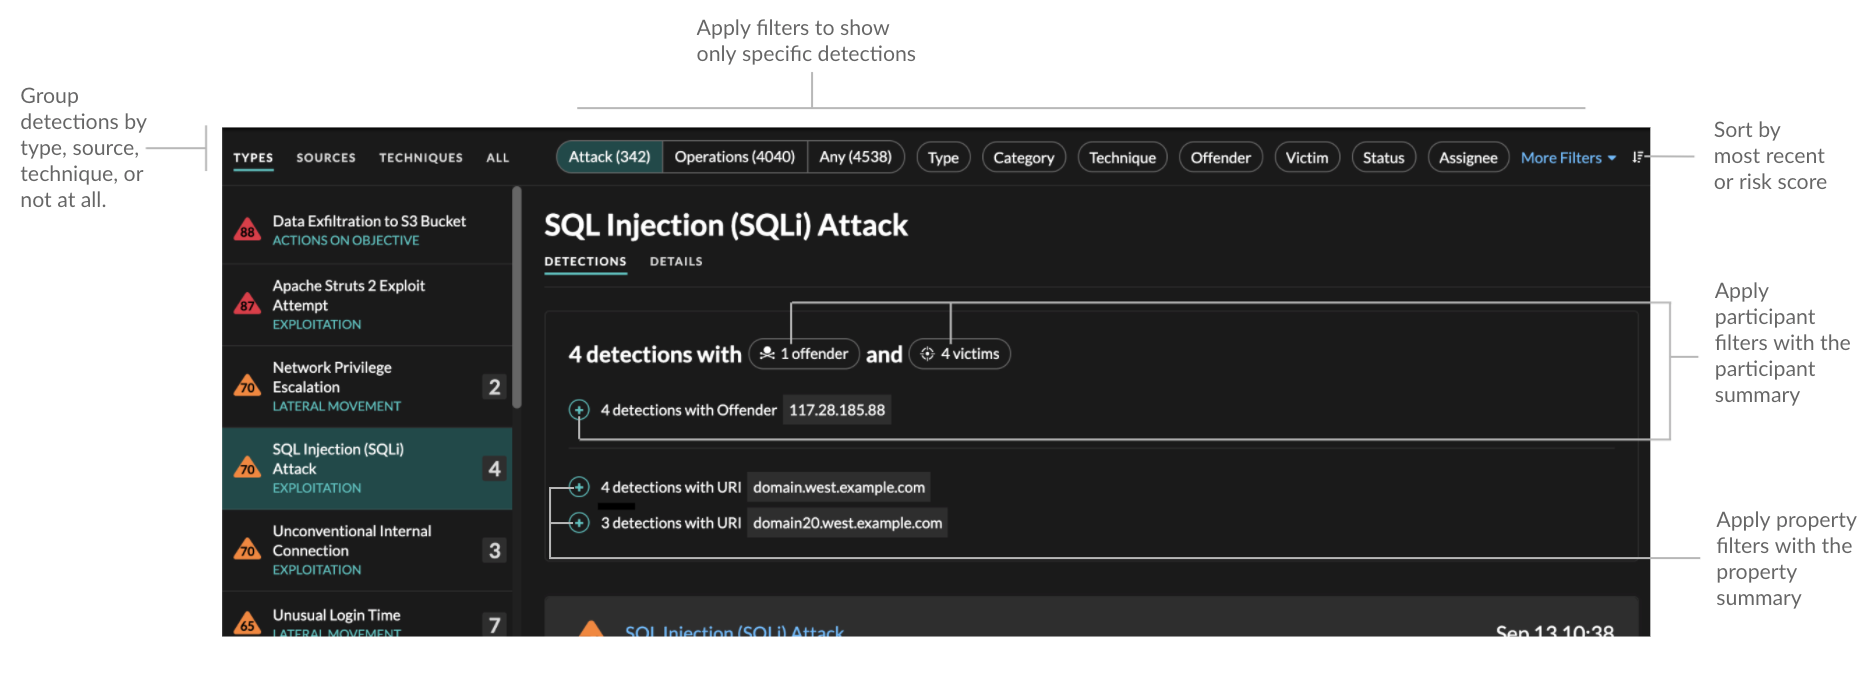
By default, detections are grouped by Types and sorted by risk on the Detections page. There are three types of controls at the top of the page that modify your page view: groups, filters, and sort.
Grouping detections
You can group detections to organize the page by Types of detection (such as Spike in SSH Sessions), by detection Sources (offender or victim hostname or IP address), by MITRE Techniques (a common attack classification framework), or show All detections for the current time interval.
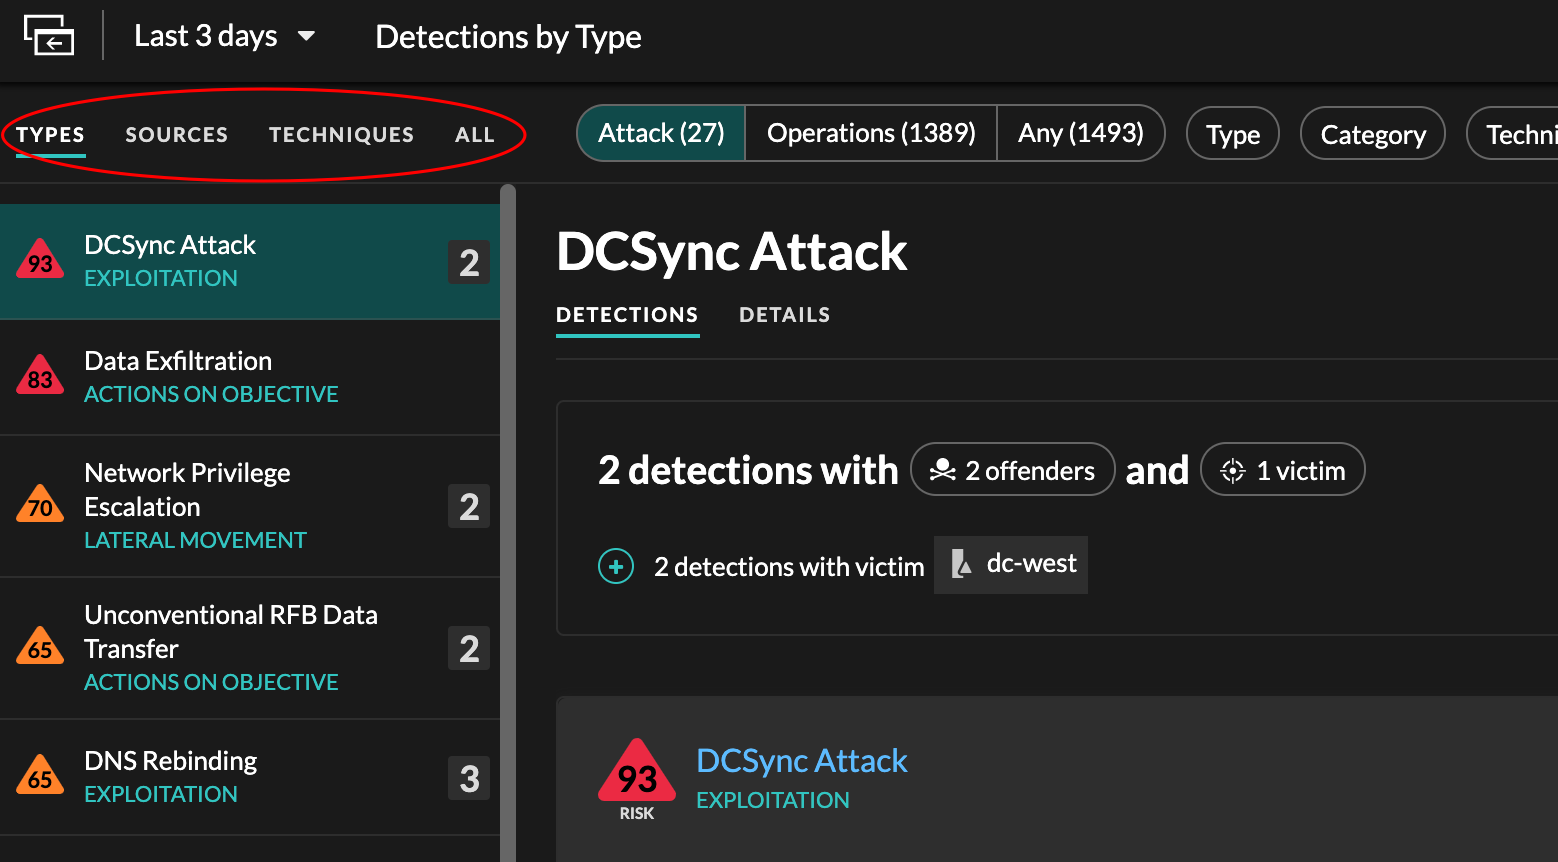
When grouping the Detection page by Types, the participant summary appears under the detection type. You can click filters in the summary title and select a single participant, or apply multiple participant filters by clicking the plus (+) icon.
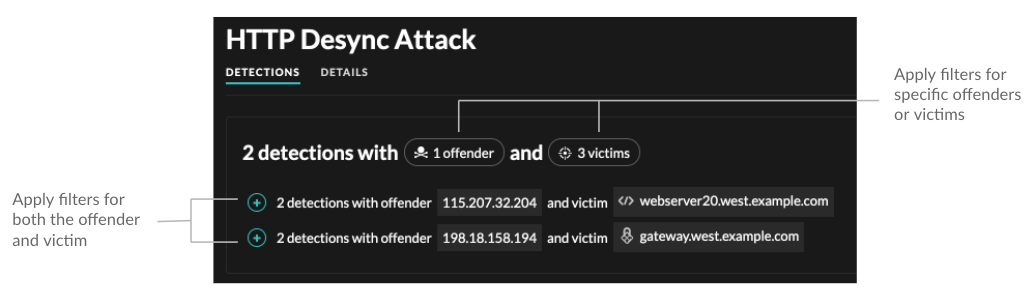
For certain detections, a property summary is available when grouping by Types. Click a property filter to show other detections that match the property.
When grouping by Techniques, you see attack techniques organized
in a matrix according to the MITRE ATT&CK® Matrix for Enterprise. Each tile in the
matrix represents a MITRE technique. If a tile is highlighted, that means that a
detection associated with that technique occurred during the selected time interval.
Click on any tile to see detections that match that technique.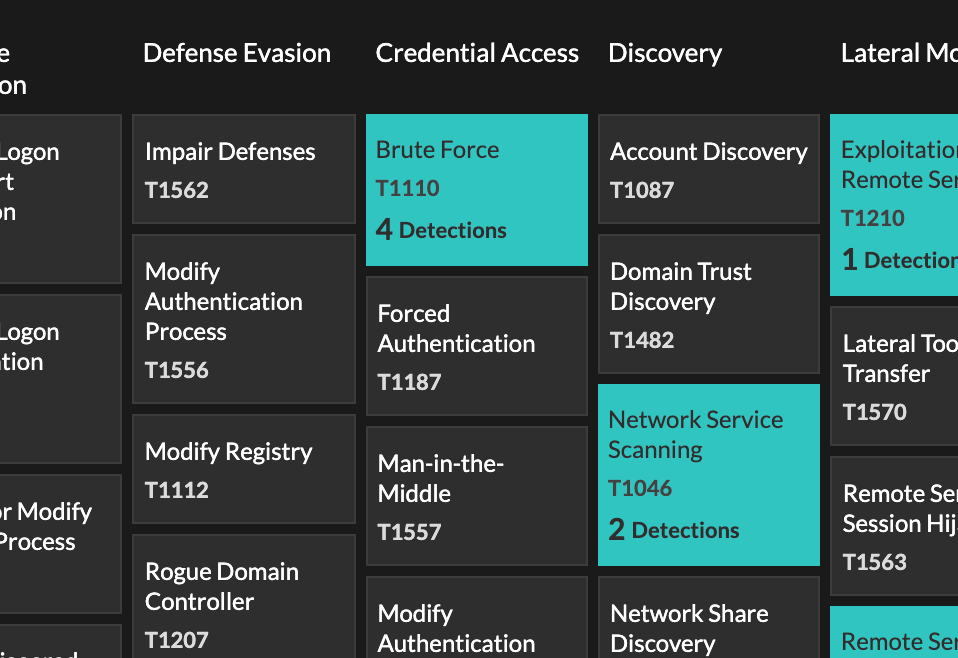
Timeline
- Click and drag to highlight an area on the chart to zoom in on a specific time range. Detections are listed for the new time interval.
- Hover over a bar to view the detection title.
- Click a bar to navigate directly to the detection detail page.
Security
Most network attacks tend to follow familiar patterns or phases. All security detections are assigned an attack category that corresponds with one of these phases.When you group by All on the Detections page, a flow chart displays the number of detections that are associated with each attack category. Categories are assembled into an attack chain that characterizes the progression of steps an attacker takes to ultimately achieve their objective, such as stealing sensitive data.
Filtering detections
You can filter the Detections page to display only the detections that match your specified criteria. For example, you might only be interested in exfiltration detections that occur over HTTP, or detections associated with participants that are important servers.
Attack
Show only detections that are associated with an attack category. Combine this filter with the Category filter to only show detections from a specific attack category.
Operations
Show only detections that are associated with network, application, and infrastructure problems. Combine this filter with the Category filter to show only detections within a specific performance or IT operations category.
Type
Filter your detection list by a specific detection type, such as Data Exfiltration or Expired SSL Server Certificates. You can also type a CVE identification number into this filter to only show detections for a specific public security vulnerability.
Category
Attack and Operations detections have categories that can further refine your view of the Detections page.
Attack detections include the following categories that match phases of the attack chain.
- Command & Control
- An external server that has established and maintained connection to a compromised device on your network. C&C servers can send malware, commands, and payloads to support the attack. These detections identify when an internal device is communicating with a remote system that appears to be acting as a C&C server.
- Reconnaissance
- An attacker is seeking high-value targets and weaknesses to exploit. These
detections identify scans and enumeration techniques.
Note: Detections might identify a known vulnerability scanner such as Nessus and Qualys. Click the device name to confirm if the device is already assigned a Vulnerability Scanner role in the ExtraHop system. To learn how to hide detections related to these devices, see Tune detections. - Exploitation
- An attacker is taking advantage of a known vulnerability on your network to actively exploit your assets. These detections identify unusual and suspicious behaviors associated with exploitation techniques.
- Lateral Movement
- An attacker has infiltrated your network and is moving from device to device in search of higher-value targets. These detections identify unusual device behavior associated with east-west corridor data transfers and connections.
- Actions on Objective
- The attacker is close to achieving their objective, which can vary from stealing sensitive data to encrypting files to ransom. These detections identify when an attacker is close to completing a campaign objective.
Operation detections include the following categories.
- Caution
- Highlight security policies and standards that should be enforced to mitigate risk. These detections identify areas of risk on your network that might require attention, such as expiring certificates or software that should be patched.
- Authentication & Access Control
- Highlight unsuccessful attempts by users, clients, and servers to log in or access resources. These detections identify potential WiFi issues over authentication, authorization, and audit (AAA) protocols, excessive LDAP errors, or uncover resource-constrained devices.
- Database
- Highlight access problems for applications or users based on analysis of database protocols. These detections identify database issues, such as database servers that are sending an excessive number of response errors that might cause slow or failed transactions.
- Desktop & App Virtualization
- Highlight long load times or poor quality sessions for end users. These detections identify application issues, such as an excessive number of Zero Windows, which indicates that a Citrix server is overwhelmed.
- Network Infrastructure
- Highlight unusual events over the TCP, DNS, and DHCP protocols. These detections might show DHCP issues that are preventing clients from obtaining an IP address from the server, or reveal that services were unable to resolve hostnames due to excessive DNS response errors.
- Service Degradation
-
Highlight service issues or performance degradation associated with Voice over IP (VoIP), file transfer, and email communications protocols. These detections might show service degradations where VoIP calls have failed and provide the related SIP status code, or show that unauthorized callers have attempted to make several call requests.
- Storage
- Highlight problems with user access to specific files and shares found when evaluating network file system traffic. These detections might show that users were prevented from accessing files on Windows servers due to SMB/CIFS issues, or that network-attached storage (NAS) servers could not be reached due to NFS errors.
- Web Application
- Highlight poor web server performance or issues observed during traffic analysis over the HTTP protocol. These detections might show that internal server issues are causing an excessive number of 500-level errors, preventing users from reaching the applications and services they need.
Technique
Highlight detections that match specific MITRE technique IDs. The MITRE framework is a widely recognized knowledgebase of attacks.
Offender and Victim
The offender and victim endpoints associated with a detection are known as participants. You can filter your detection list to only show detections for a specific participant, such as an offender that is an unknown remote IP address, or a victim that is an important server.
Status
Show detections with a specific detection status, such as Acknowledged, In Progress, or Closed.
More Filters
- Device roles
- Source
- Site (Command appliance only)
- Ticket ID filter (Third-party ticketing systems only)
- Minimum Risk Score
Detection Catalog
The Detection Catalog provides a complete list of all detection types available in the ExtraHop system. You can also manage custom detection types from the Detection Catalog page.
You can access the Detection Catalog page by clicking the System Settings icon
![]() .
.
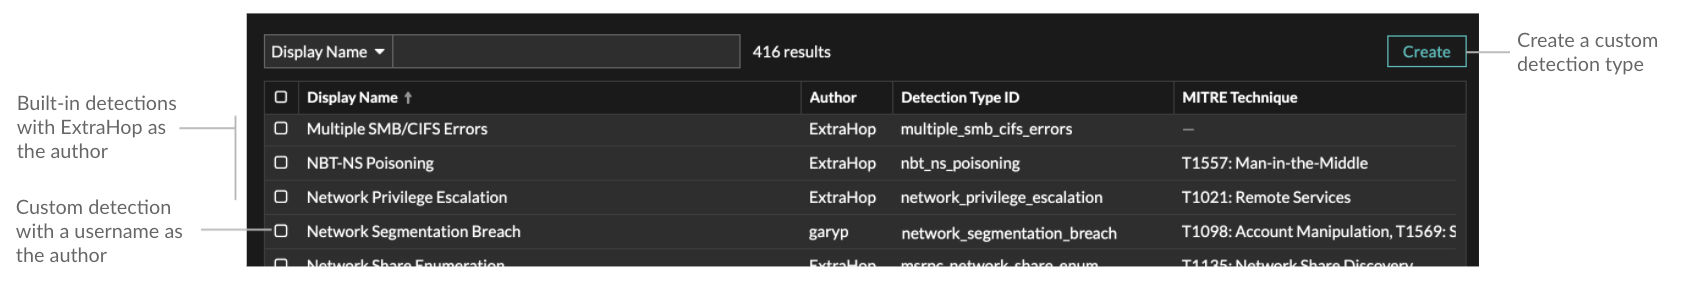
In addition to the display name and author, you can filter the detection type list by detection type ID, MITRE techniques associated with the detection type, and detection types that support data from flow sensors.
To learn more about a built-in detection, click on the detection, and then click Detection Type Details in the Detection Type Settings panel.
Custom detections
- To create a custom detection type, click Create in the upper right corner of the page. The detection type ID for the new detection type must match the ID included in the custom detection trigger. Learn more about creating a custom detection.
- To edit a custom detection, click the detection and edit the display name, author, and associated MITRE techniques in the Detection Type Settings panel. You cannot edit built-in detections where ExtraHop is listed as the author.
- To delete a custom detection, click the detection, and then click Delete from the Detection Type Settings panel.
Investigations
Investigations enable you to add and view multiple detections in a single timeline and map. Viewing a map of connected detections can help you determine whether suspicious behavior is a valid threat and if a threat is from a single attack, or part of a larger attack campaign.
You can create and add to investigations from a detection detail page or from the Actions menu on each detection card.
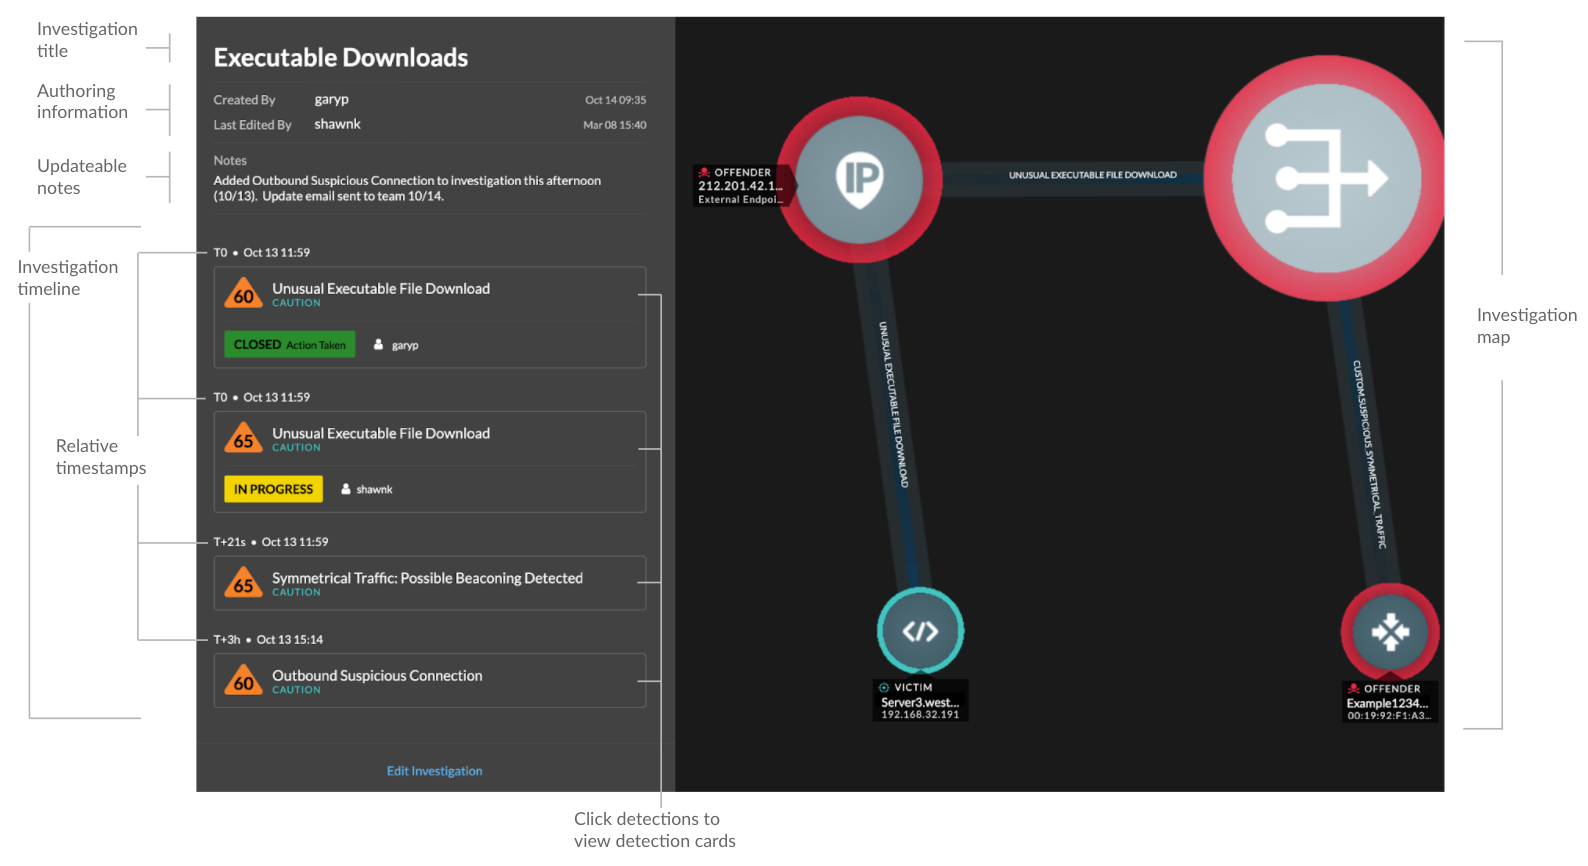
- Investigation Timeline
-
The timeline appears on the left side of the page and lists the added detections in chronological order. New detections that are added appear in the timeline according to the time and date the detection occurred and relative to the earliest detection, which is labeled T0. Detection tracking information, such as assignee and status, is displayed for each detection.
Click a detection in the timeline to view the detection card and highlight the detection participants in the investigation map. Click a participant on the card or in the investigation map to view basic details and links to the Device Overview page and other detections where the device is a participant.
In the upper right corner of the detection card click the go to
 icon to view the
detection detail page, or the x icon
to close the detection and return to the investigation timeline.
icon to view the
detection detail page, or the x icon
to close the detection and return to the investigation timeline. 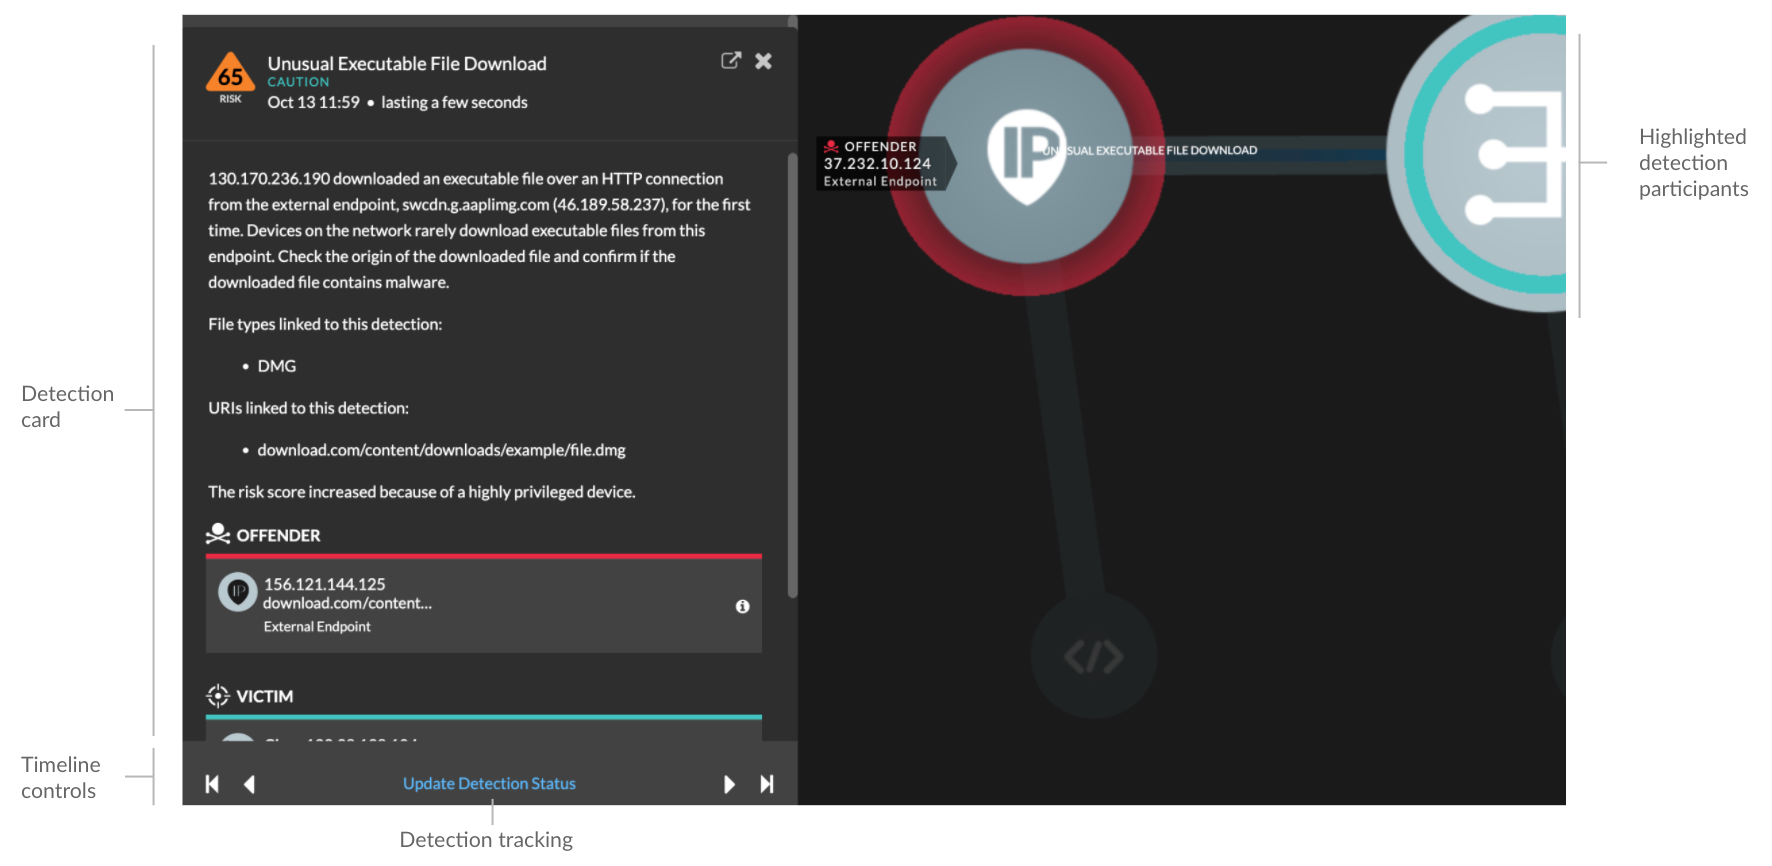
Below the detection card, click Update Detection Status to edit detection tracking information. You can click the timeline controls to view other detections in the investigation.
- Investigation Map
- The investigation map displays the offender and victim from every detection
in the investigation. . The participants are connected by lines that are
labeled with the detection type, and device roles are represented by an
icon.
- Click a detection in the investigation timeline to highlight participants. Circles are highlighted red if the device is the offender and teal if the device is the victim. Highlights are updated when you click a different detection to help you identify when a participant changes from victim to offender.
- Click a circle to view details such as the device hostname, IP address, or MAC address, or to navigate to associated detections or the Device Overview page.
- Hover over any circle or line to display the label.
- Notes
- Click Edit Investigation to add notes or change the investigation name. You can continue to track individual detections after you add them to an investigation.
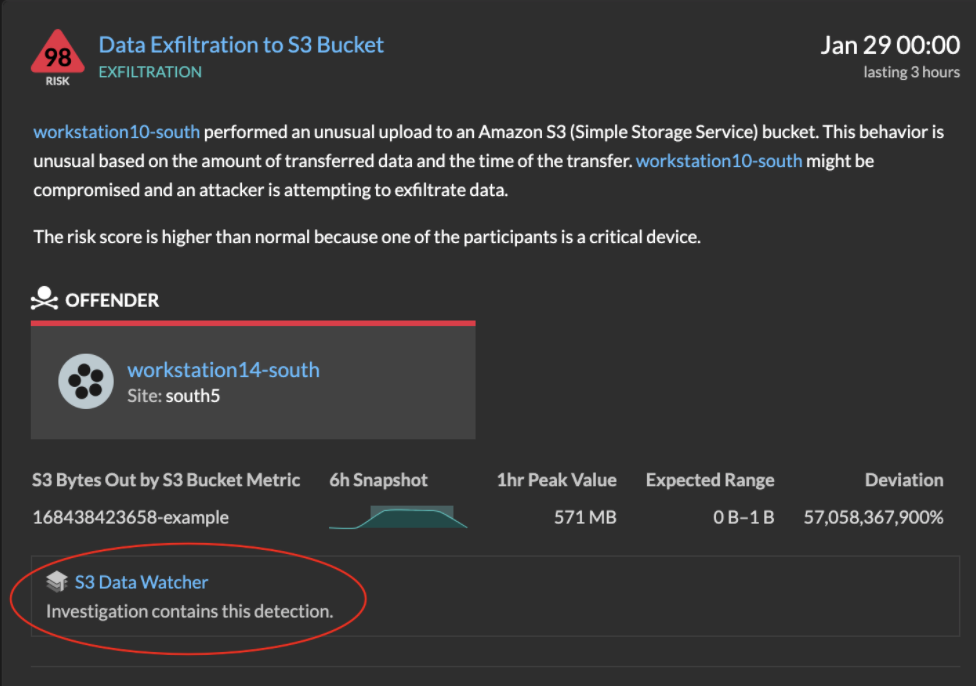
Navigating investigations
After a detection is added to an investigation, a link to the investigation appears at the bottom of the detection card and on the detection detail page.
Click the name to open the investigation and then click the name of the detection on the
investigation page to return to the detection detail page.
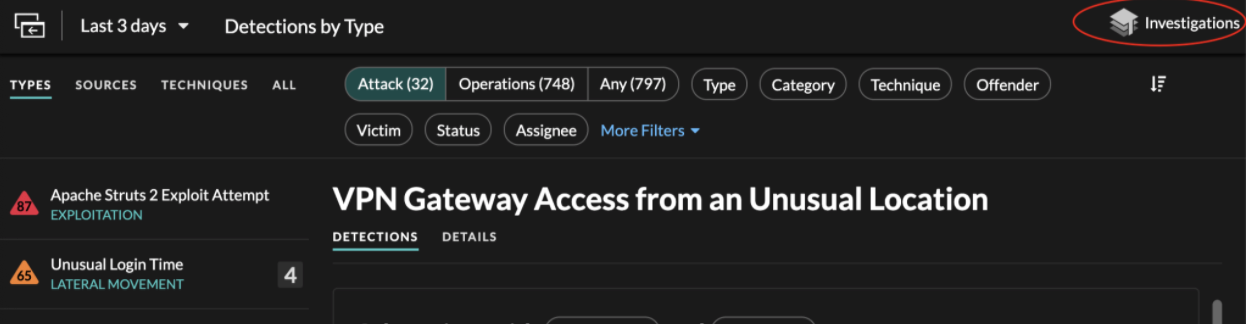
By clicking the Investigations icon in the upper right corner of
the Detections page you can view a list of all investigations on the system.
Learn how to create an investigation.
Finding detections in the ExtraHop system
While the Detections page provides quick access to all detections, there are indicators and links to detections throughout the ExtraHop system.
| Note: | Detections remain in the system for a minimum of five weeks and then are removed if the system is no longer storing metrics related to the detection. |
- From a Device Overview page, click Detections to view a list of associated detections. Click the link for an individual detection to view the detection details page.
- From a Device Group Overview page, click the Detections link to go to the Detections page. The detections list is filtered to the device group as the source.
- From a device or device group protocol page, click the Detections link to go to the Detections page. The detections list is filtered to the source and protocol.
- On an activity map, click a device that displays animated pulses around the circle label to view a list of associated detections. Click the link for an individual detection to view detection details.
- From a chart on a dashboard or protocol page, hover over a detection marker to display the title of the associated detection or click the marker to view detection details.
Thank you for your feedback. Can we contact you to ask follow up questions?