Activity maps
An activity map is a dynamic visual representation of the L4-L7 protocol activity between devices in your network. You can see a 2D or 3D layout of device connections in real-time to learn about the traffic flow and relationships between devices.
Activity maps can help you with the following use cases:
- Complete a data center or cloud migration
- As part of your migration strategy, you must determine which services can be turned off and when. An activity map helps you identify which devices are still connected so you can prevent unexpected service disruptions during the migration process. For more information, see the Plan and monitor your migration with activity maps walkthrough.
- Identify the root cause behind a slow application
- Applications often depend on multiple tiers of services within a network. An activity map can help you identify the delivery chain of traffic to your slow application server. Click a device to investigate related metrics, which can shed more light onto the root cause of the slow-down.
- Track suspicious devices or unexpected connections
- During a security event, an activity map can help you identify affected devices by tracking the real-time east-west traffic associated with a suspicious device. As part of a daily security monitoring strategy, you can create an activity map to confirm that devices are not making unexpected connections with other devices.
Here are some important considerations about activity maps:
- You can create activity maps for devices in Advanced, Standard, and L2 Parent Analysis. You cannot create an activity map for devices in Discovery Mode. For more information, see Analysis priorities.
- If you create an activity map for a device or device group that has no protocol activity during the selected time interval, the map appears without any data. Change the time interval or your origin selection and try again.
- You can create an activity map in a Command appliance or in Reveal(x) 360 to view device connections across all of your sensors (Discover appliances).
- You can save and share an activity map , granting view or edit access to other system users or groups. You can also load a saved activity map to modify map properties.
For more information about activity maps, see the Activity Maps FAQ.
Navigate activity maps
After creating an activity map, you can start investigating data. The following sections provide details about how to interact with an activity map and find information about the data you are viewing.
Layout
Devices are represented by circles and connections are represented by lines.
The placement of devices is optimized to display information. The layout can change as data about device activity is updated in real-time. For example, the layout is updated as new connections are observed or devices become inactive.
| Note: | When the time interval in the upper left corner of the page is set to Last 30 minutes, Last 6 hours, or Last 1 day, activity map data continually updates every minute with real-time data. Set a custom time interval with a specific start and end time to stop real-time layout updates. |
2D or 3D layout
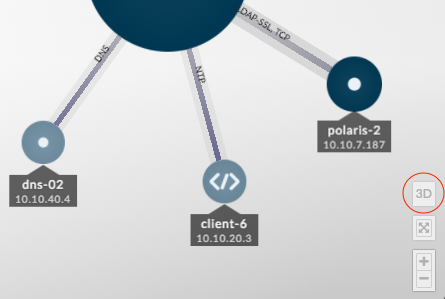
By default, activity maps are displayed in a 2D layout, but you can click 3D to change the display to a rotating 3D model. For example, you might want to showcase 3D maps on a large screen in a network or security operations center.
Reposition, rotate, and zoom
Zoom in and out of a map with controls located in the bottom right corner of the page or zoom with your mouse wheel. Click-and-drag your mouse to reposition a 2D map or rotate a 3D map.
Labels and icons
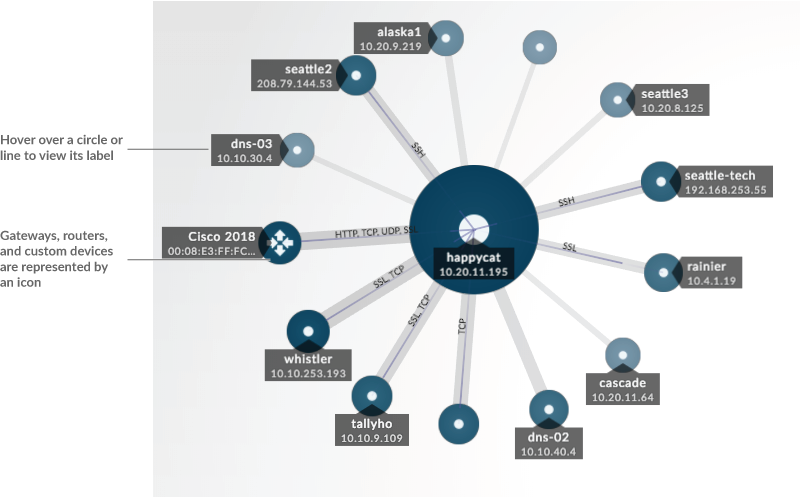
Circle labels contain details such as the device hostname, IP address, or MAC address.
Line labels contain protocol names associated with the device connection and the direction of traffic flowing between the devices, which is displayed as animated pulses. Specific device roles are represented by an icon.
To optimize the display of information, not every label is displayed. Hover over any circle or line to display its label, as shown in the following figure.
| Note: | Device roles are automatically assigned to a device based on the type of traffic the ExtraHop system observes for that device. For more information, see Change a device role. |
Circle and line size
The size of objects in the map corresponds with a metric value, which helps to highlight
areas of increased activity, such as the number of bytes, or traffic volume, associated with a
device connection.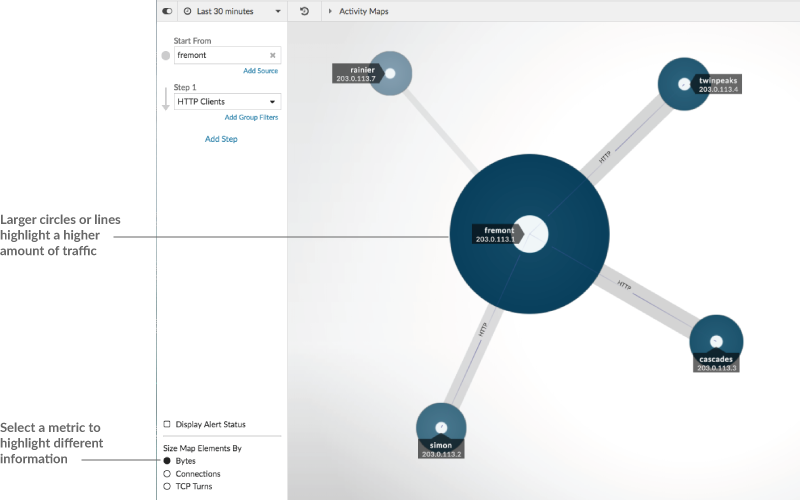
At the bottom of the left pane, you can select a different metric for map elements:
Bytes: See all of the devices transmitting or receiving data during the time interval.
Connections: See only the devices that have established a new connection at least once during the time interval.
TCP Turns: See only the devices that switched between transmitting and receiving data at least once during the time interval.
Color
Blue and gray are default colors for circles and lines. These default colors are optimized to display information in a map. However, you can apply different colors to your map to highlight the severity level of an alert or show when a device connection was established.
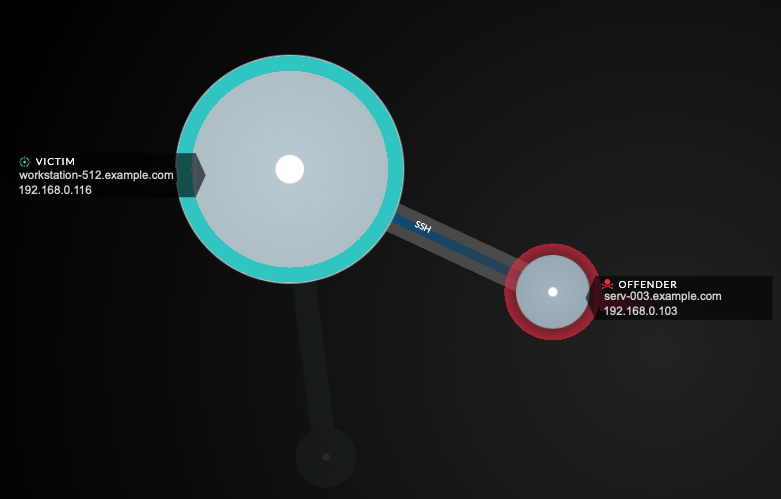
Detections
Detections associated with a device on the map appear around the circle as animated pulses, known as detection markers. The color of the pulse is red if the device is the offender and teal if the device is the victim of the detection. The participant status also appears on the device label.
| Note: | Machine learning detections require a connection to ExtraHop Cloud Services. |
Click a circle with a detection marker to view and navigate to associated detections or the Device Overview page.
If detection markers do not appear on your activity maps as expected, detection markers might be disabled. You can enable or disable detection markers from the User menu.
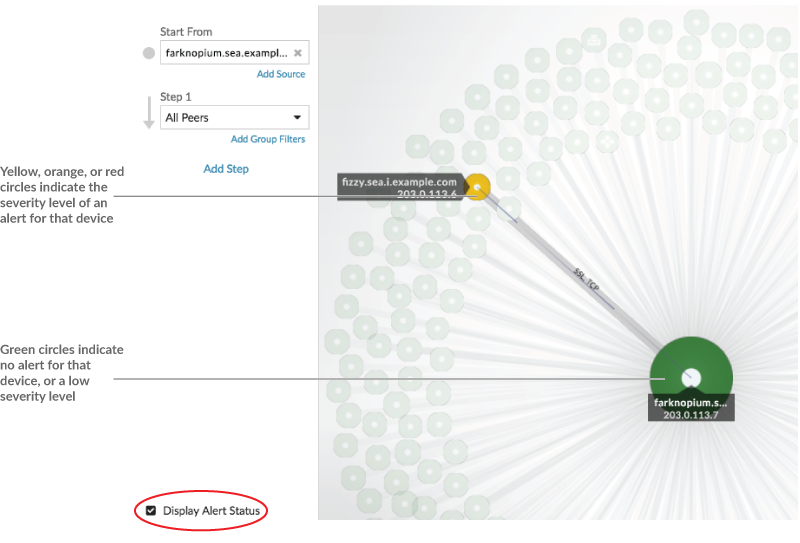
Alert status
To see the severity level of an alert for a device in your map, select Display alert status in the lower left corner or the page, as shown in the following figure. The circle color then corresponds to the most severe status for all alerts assigned to a device during the time interval. If there is no alert assigned to a device or the alert level is informational, the default circle color is green.
To investigate the alert, click the circle and then select the device name in the Go to Device… section. On the device's protocol page, scroll down to view the Alerts page.
Time interval comparison
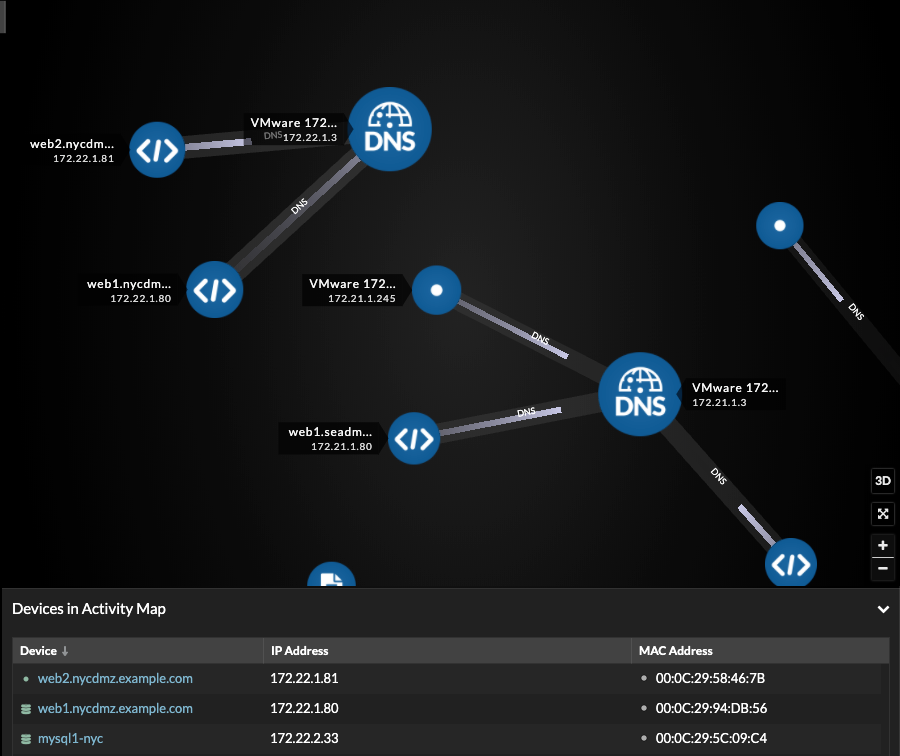
When you compare two time intervals to find metric deltas, different colors in the map help you determine when device connections were established or when the protocol activity for a device changed. For example, after creating a comparison between Yesterday and the Last 30 minutes, new device connections or activity that only appear in the more recent time interval appear green. Previous device connections or activity that only appear in the earlier time interval are red. Devices connections that did not change between time intervals are blue. In the following figure, new connections that were established in the last thirty minutes are represented by green circles and lines.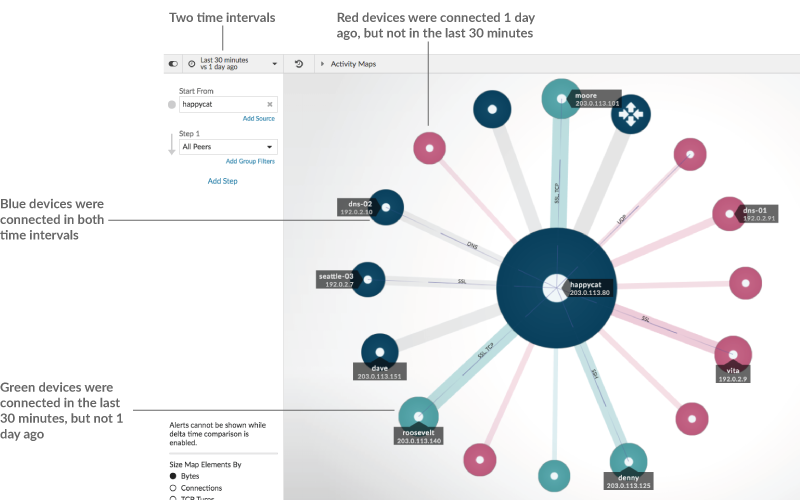
| Note: | If all the devices are a single color, such as green, this means that the query did not produce results in the earlier time interval. For example, the origin device did not have any protocol activity in the earlier time interval. |
Add steps and filters to a map
A step is a level of connections between devices. Devices in each step have a
relationship to devices in previous step. These relationship are defined by their protocol
activity. 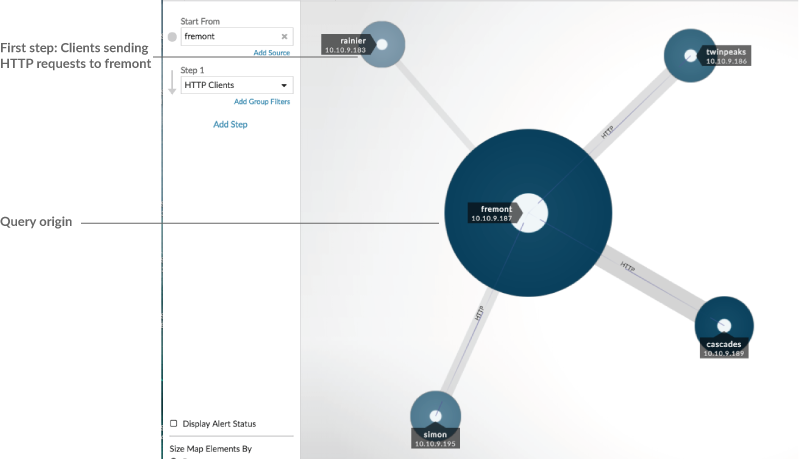
Add a new step to an activity map to add another layer of information to your map. Click the drop-down list for a particular step, and then select a protocol activity.
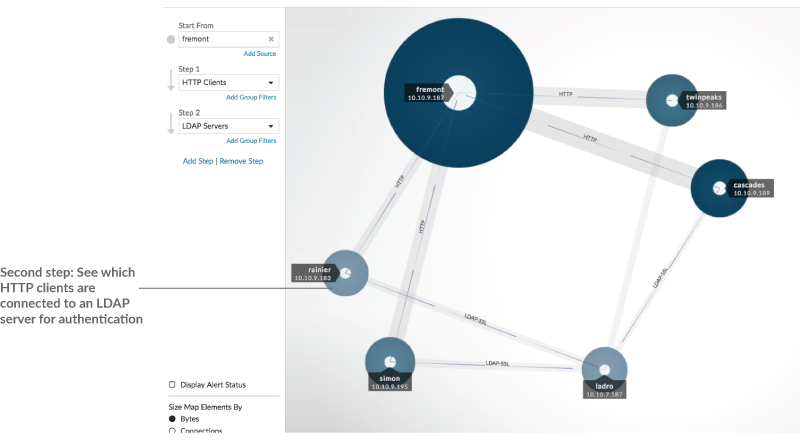
You can also filter devices in a step by their group membership. For example, if you select HTTP Servers but only want to see your test servers in the map, you can filter HTTP Servers by a device group, such as My Test Servers.
For more information on how to add steps and filters to a map, see Create an activity map.
Manage activity maps
The following options for managing your activity map are available from the command menu in the upper right corner:
- Save and share an activity map
- Load and manage a saved activity map
- Export activity map as a PDF, PNG, or SVG file
Best practices for investigating activity map data
If you find a device on your map that is worth investigating, you have several options to gather more information about that device.
- Find recently-connected devices
-
Click the time interval in the top left corner of the page and click Compare. You can see how device connections changed between two different time intervals.
For more information, see Time interval comparison.
- Navigate to protocol pages to find related metric activity
-
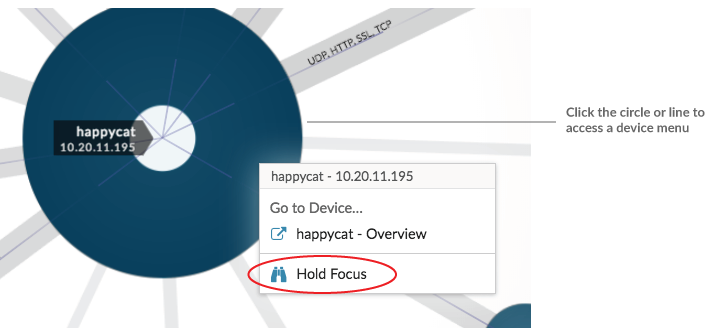
Click a circle or line to access a drop-down menu as shown in the following figure.
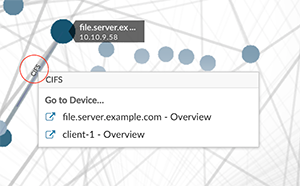
Select the device name from the menu to view the Device Overview page. From the left pane, click a protocol name to view the protocol page, which contains a summary of important protocol metrics that were observed and associated with the device. From a protocol page, you can find related metrics such as errors, requests, responses, and server processing time. You can also drill down on a metric from a protocol page to view metric details, such as server IP address, client IP address, status codes, methods, and URIs.
- Navigate to detections identified on the device
- Devices on an activity map that have associated detections are displayed as animated
pulses around the circle label. Click a circle with this detection marker to access a
drop-down menu, as shown in the following figure.
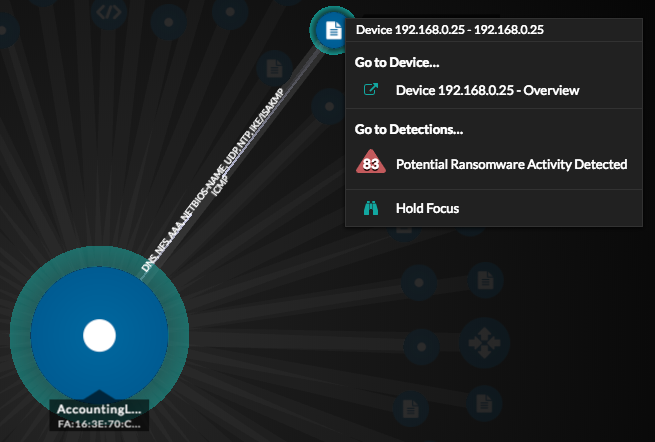
Select a detection name from the menu to navigate to the detail page for that detection. The detail page contains information about the type of detection that occurred and what it means, as well as when the detection occurred and the duration of the issue. For more information, see Detection detail page.
- Search for transaction records associated with a connection (Requires an Explore appliance or other supported recordstore)
- Click a circle or line to access the drop-down menu. Click Records. A records query page opens and displays all the records from each connected device, including all record types associated with the device connection protocols.
Thank you for your feedback. Can we contact you to ask follow up questions?