Initiate precision packet captures to analyze zero window conditions
In TCP metrics, window size specifies the amount of data that a device can receive and process during a flow. When the window size is zero, transmissions are halted until the device signals that it has the space to receive data again.
Zero window conditions that last 1 or 2 seconds are not too unusual, especially during periods of heavy traffic. However, longer-lasting zero window conditions can indicate a more serious problem and cause performance issues.
You can create a dashboard or configure alert notifications to track zero window occurrences, but the cause can be hard to determine. For example, CPU, memory, and NIC usage might be normal, and you don't know if the issue is with the network, the servers, or the application. But you can always find the truth in the packet!
In this walkthrough, you will create a trigger that captures packets with zero window conditions on HTTP transactions. Then, you will download the captures so that you can upload the data to a packet analyzer to help you determine the state of the client and server on a flow when zero window conditions occurred.
Prerequisites
- You must have either system and access administration privileges or full write privileges with packet access enabled.
- You must enable packet capture through the Administration page.
- You must have a packet analyzer, such as WireShark or Microsoft Network Monitor.
- Familiarize yourself with Triggers concepts and the procedures in Build a trigger.
Write the precision capture trigger
In the following steps, you will write a trigger that initiates a precision packet capture each time a zero window condition occurs on an HTTP transaction.
-
Click the System Settings icon
 and then click
Triggers.
and then click
Triggers.
View debug output in the debug log
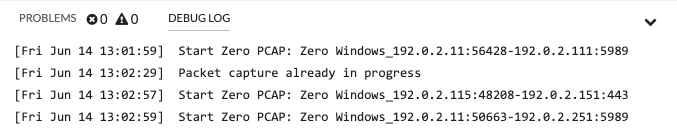
In the following steps, you will view the trigger debug output to confirm that the trigger is running and capturing packets. After you assign the trigger to your data sources, the system runs the trigger when HTTP traffic occurs, and if any transactions contain a zero window, the system sends debug results to the debug log.
-
Click the System Settings icon , and then click Triggers.
-
Click the Debug Log tab.
The debug log displays results similar to the following figure:
Download and view packet captures
In the following steps, you will download packet captures.
- Log in to the ExtraHop system through https://<extrahop-hostname-or-IP-address>.
- From the top menu, click Records.
- Click View Records.
- From the Record Type drop-down list, select Packet Capture.
-
After the records associated with your packet capture appear, click the Packets
icon
 , and then click
Download PCAP.
, and then click
Download PCAP.
Thank you for your feedback. Can we contact you to ask follow up questions?