Metrics FAQ
This document provides answers to frequently asked questions about how metrics work in the ExtraHop system.
| Video: | See the related training: Choosing a Metric |
What is the metric explorer?
The Metric Explorer is a tool for creating and editing charts. The metric explorer can show you how metric data changes over time. With the Metric Explorer, you can add metrics to a chart and immediately visualize how metric data behaves for the selected time interval. The preview pane dynamically updates as you make metric and chart type selections. You have the option to then save your chart to a dashboard.Are there 1-second metrics available in the ExtraHop system?
Yes, the following metrics have 1-second granularity:
- Network Bytes
- Network Packets
- Network Bytes In and Out for a device
- Network Packets In and Out for a device
- Maximum Network Bytes per Millisecond
- Maximum Network Packets per Millisecond
- Custom metrics that are configured to have 1-second granularity
Select a time interval of less than 6 minutes to view 1-second granularity for these metrics. For more information, see Change chart data granularity.
What is the resolution of timing metrics?
Timing metrics (such as Round Trip Time and Server Processing Time) have a microsecond-level resolution. Timing metrics are represented as a mean, median, or percentile. For example, Round Trip Time is stored as 20.232 milliseconds instead of 20 milliseconds.What is the Metric Catalog?
The Metric Catalog enables you to look up information about a custom or built-in metric. To view the Metric Catalog, click the System Settings iconEnter the name of a metric that you are looking for in the search field. The Metric Catalog will display an entry for each metric that provides information about metric parameters, such as the source type, metric type, and detail relationships. This information can be useful for writing API queries and adding metric variables in a text box widget. You also can delete and edit custom metrics through the Metric Catalog. Learn more about types of metrics.
What is the difference between top-level and detail metrics?
Top-level metrics and detail metrics provide different views about network activity. Top-level metrics provide you with a big-picture value to help identify what is happening on your network. You can then drill down on a top-level metric to view detail metrics. Detail metrics provide you with a value for a specific key (such as a client or server IP address), which gives you insight into how a specific device, method, or resource is affecting the network.On the Dashboard page, you can configure charts to display either top-level or detail metrics. On protocol pages, you can view top-level metrics and then drill down to view detail metrics.
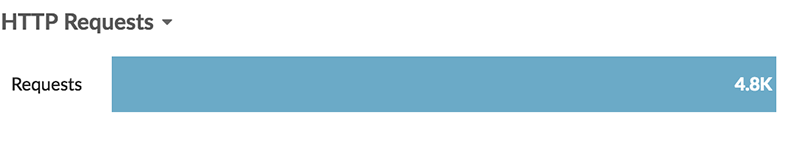
A top-level, or base, metric gives you a sum of data for a specified time period. The ExtraHop system provides you with real-time updates about top-level metrics. For example, you can view the total number of HTTP requests sent by a device for the last 30 minutes.
In the following figure, a bar chart displays the top-level metric for the total number of HTTP requests that were sent to a web server during a specific time period.
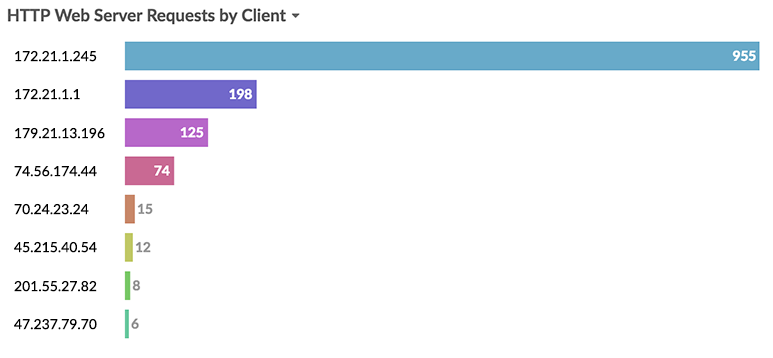
Detail metrics provide you with a metric value for a specific key, such as a client IP address, server IP address, URI, hostname, referrer, certificate, or method. For example, you can drill down on the total number of HTTP requests to break out the number of requests sent per client. When you drill down, the ExtraHop system provides you with a topnset of detail metrics. A topnset is the top 1,000 key-value pairs calculated for the time interval you specify in the Time Selector. A topnset is not a complete data set because a topnset only represents the key-values that are recorded for a specific aggregation roll up (based on a specified time interval), and is limited to up to 1,000 keys per topnset.
In the following figure, a Bar chart displays detail metric values by client (which is a key) after drilling down on the top-level metric for HTTP requests. Specifically, the chart displays eight clients that sent the most requests to the web server during a specific time period. You can configure charts to show you either a specific key or a specific number of keys from a topnset.
| Note: | When drilling down to detail metrics from protocol pages, you might encounter a chart that includes more than 1,000 keys. Some charts in the ExtraHop system combine topnsets for multiple detail metrics into one table. You can then sort keys by detail metrics. For example, when you navigate to Assets > Applications > All Activity > HTTP and drill down by URI, the page displays both a topnset of URIs for HTTP Responses and a topnset of URIs for Server Processing Time. |
Thank you for your feedback. Can we contact you to ask follow up questions?