Display a rate or count in a chart
You can visualize errors, responses, requests, and other count metric data in a chart as a per second rate or as a total number of events over time. For high-precision Network Bytes and Network Packets metrics, you have the additional options to view the maximum, minimum, and average rate per second in a chart.
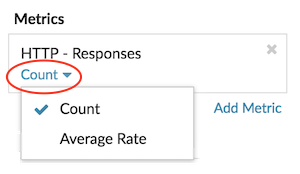
When editing a chart in the Metric Explorer, you can select a count or rate by clicking the drop-down link below the metric name, as shown in the following figure.
In addition, you can select from the following options for displaying rates and counts. Note that the type of metric you select affects which rate or count is automatically displayed.
- Average rate
- Calculates the average metric value per second for the selected time interval. For network-related metrics, such as Response L2 Bytes or NetFlow Bytes, the average rate per second is automatically displayed.
- Count
- Displays the total count of events for the selected time interval. For the majority of count metrics, such as errors, requests and responses, the count is automatically displayed.
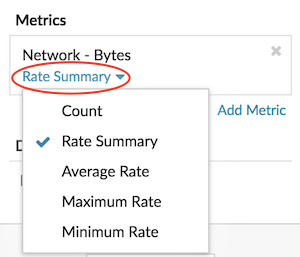
- Rate summary
- Calculates the maximum, minimum, and average metric value per second. For high-precision metrics, such as Network Bytes and Network Packets, these three rates are automatically displayed in the chart as a summary. You can also select to view only the maximum, minimum, or average rate in a chart. High-precision metrics are collected with a 1-second level of granularity and are only available when you configure your chart with a network or device source.
Display the average rate in a chart
If you configured a chart with an error, response, request, or other type of count metric, then the total number of events over time is automatically displayed. You can further edit the chart to display an average rate per second for your data.
Before you begin
Create a chart and select a count metric, such as errors, requests, or responses, as your source. Save your chart to a dashboard.-
Click Count below the metric name.
Display the maximum rate in a chart
To display a maximum rate per second of a metric in a chart, you must configure a chart with a high-precision metric.
The following steps show you how to configure a chart that displays a maximum rate:
-
Complete one of the following steps:
- To create a new chart, click the command menu
 in the upper right
corner of the page and then select Create
chart.
in the upper right
corner of the page and then select Create
chart. - To edit an existing chart, click Dashboards at the top of the page. From the dashboard dock, select a dashboard containing the chart that you want to edit. Click the chart title and select Edit.
- To create a new chart, click the command menu
-
Click Rate Summary below the metric name.
Thank you for your feedback. Can we contact you to ask follow up questions?