Records
Records are structured information about transaction, message, and network flows that are generated and sent from the ExtraHop system to a recordstore. After your records are collected and stored, you can query for them throughout the ExtraHop system.
Records are collected at two protocol levels: L3 and L7. L3 (or flow) records show network-layer transactions between two devices over the IP protocol. L7 records show transactions that are message-based (such as ActiveMQ, DNS, and DHCP), transactional (such as HTTP, CIFS, and NFS), and session-based (such as SSL and ICA).
| Video: | See the related training: Records |
Before you begin
- You must have a configured recordstore, such as an ExtraHop recordstore, Splunk, Google BigQuery, or CrowdStrike Falcon LogScale.
- You can only configure one recordstore for the ExtraHop system.
- Your ExtraHop system must be configured to collect and store flow records or L7 records.
Navigating records
The main Records page displays several ways to query for stored records. Click Records from the top menu to get started.
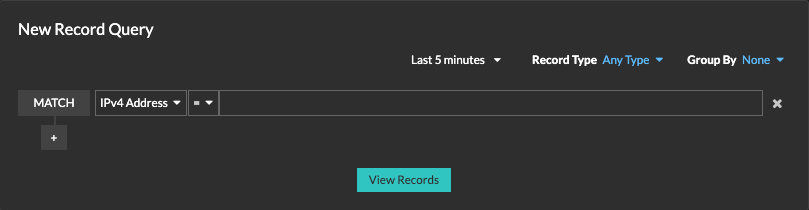
- Standard search
- Query for records with a standard search to build a complex filter by combining 'AND' and 'OR' operators with additional filter options such as record type and time interval. Learn more about querying records with a standard search.
-
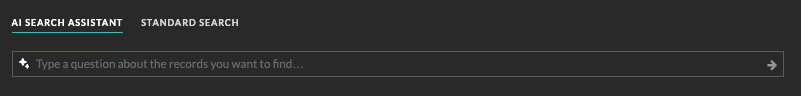
- AI Search Assistant
- AI Search Assistant helps you search for records with questions written in
natural, everyday language to quickly build complex queries as compared to
building a standard search query with the same criteria. AI Search Assistant
must be enabled by your ExtraHop Administrator.Learn more
about querying for records with AI Search Assistant.
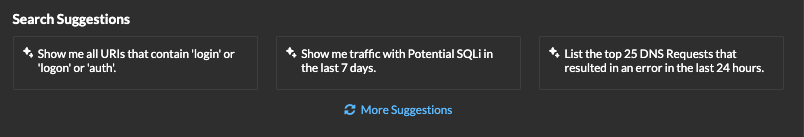
- Search suggestions
- The ExtraHop system provides several suggested searches with pre-built filters
that help you perform common record searches more efficiently. Click a search
suggested to apply the query and immediately view records or click
More Suggestions for more options.
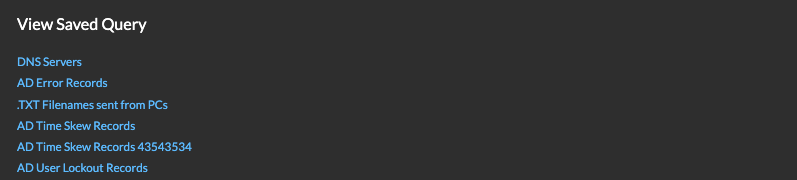
- Saved queries
- You can also select a previously-saved query from the list on the Records page
and immediately view records or you can click the folder icon
 in the
top-right corner of the page to view all saved queries.
in the
top-right corner of the page to view all saved queries. -
| Note: | To create a record query for a custom metric, you must first define the record relationship by linking the custom metric to a record type. |
Viewing record query results
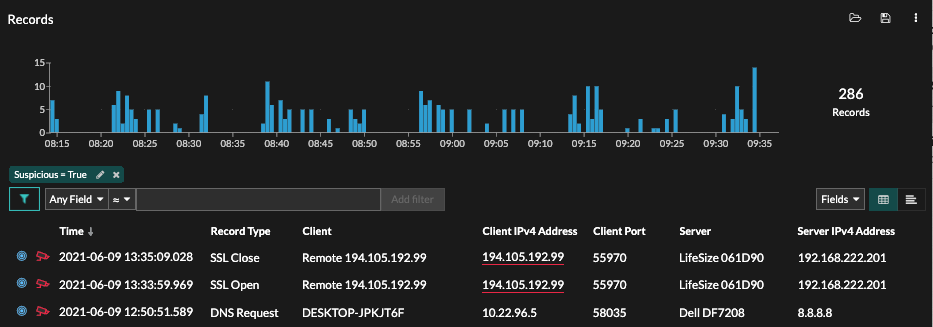
After you submit the query, results appear on the main Records page.
| Note: | A query can return millions of records based on the time interval and filter criteria. If a query exceeds the maximum number of query results, a truncated number of records appear (ExtraHop recordstore only). For example, queries from the default Any Field filter often result in a very large number of results and might impact performance. |
Here are some ways you can drill down on record query results:
- From the records chart, hover over a time interval to view the number of records, or click-and-drag across the chart to narrow the record query results to a specific time interval.
- Click a hostname or IP address to view device or external endpoint details.
- Records that contain suspicious IP addresses, hostnames, and URIs appear with a red camera icon. Click the camera icon to view threat intelligence for the record. Learn more about threat intelligence in records.
- Click a packet icon to start a packet query that is filtered by this record.
- Record results appear in a table by default. Click the Table View or Verbose
View
 icons to toggle the display.
 - A query automatically pauses if the number of record bytes scanned or returned is extremely large. If paused, the query displays the most recent records. Click Continue Query to resume searching.
- Click the Fields drop-down list to add additional record information to the record view.
- In table view, click-and-drag column headers to arrange the record information.
- Apply simple or advanced filters to find potential issues, such as overly-long processing times or unusual response sizes.
Refine your record query filter
There are a number of ways you can refine your record query filter to find the exact records you are looking for. The sections below describe each method and show examples you can start with to familiarize yourself.
Filtering record results from the left pane
After all of the available records for your selected time interval appear on the Records page, you can then filter from the left pane to refine your results.
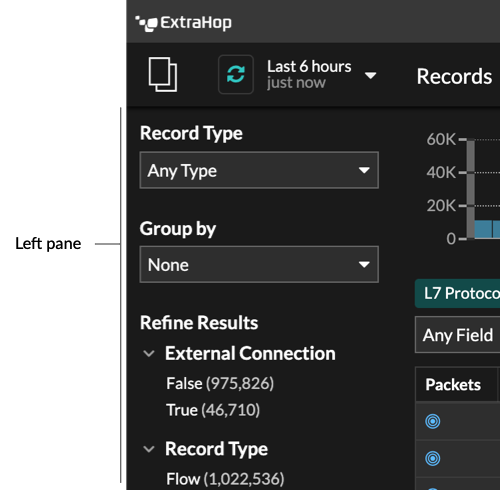
The Record Type drop-down menu displays a list of all of the record types that your ExtraHop system is configured to collect and store. A record type determines what data is collected and stored in the recordstore.
| Note: | Because you must write a trigger to collect records, you need a way to identify the type of data you will collect. There are built-in record types, which collect all of the available known fields for a protocol. You can start with a built-in record type (such as HTTP) and write a trigger to collect only the fields for that protocol that matter to you (such as URI and status code). Or, advanced users can create a custom record type if they need to collect proprietary information that is not available through a built-in record type. |
The Group By drop-down gives you a list of fields to further filter the record type by.
The Refine Results section shows you a list of common record filters for the selected record type with the number of records that match the filter in parenthesis.
Filtering record results through the trifield
Click the pencil icon ![]() to edit an existing filter or click the Add Advance
Filter button
to edit an existing filter or click the Add Advance
Filter button ![]() to add
a new filter.
to add
a new filter.
In the Filter Display Name field, you can specify a descriptive name to identify the general purpose of the query.
Select a criteria option from the drop-down menu (the default option is IPv4 Address), select an operator (such as the equal sign (=)), and then type the search value. Click Add filter, and the filter is added above the filter bar.
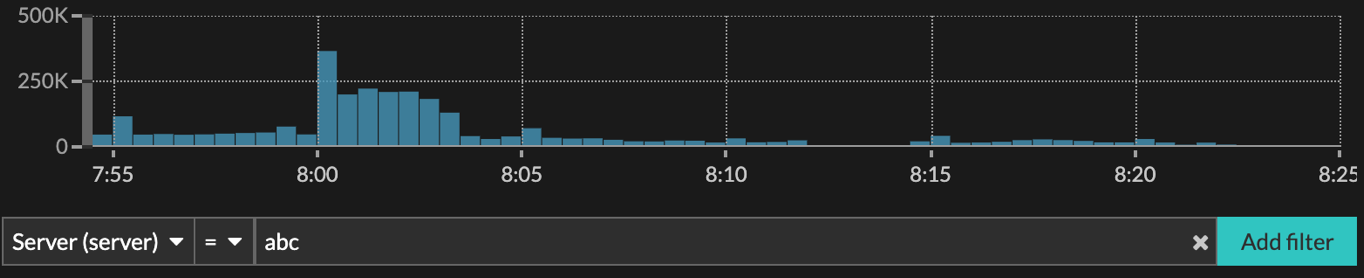
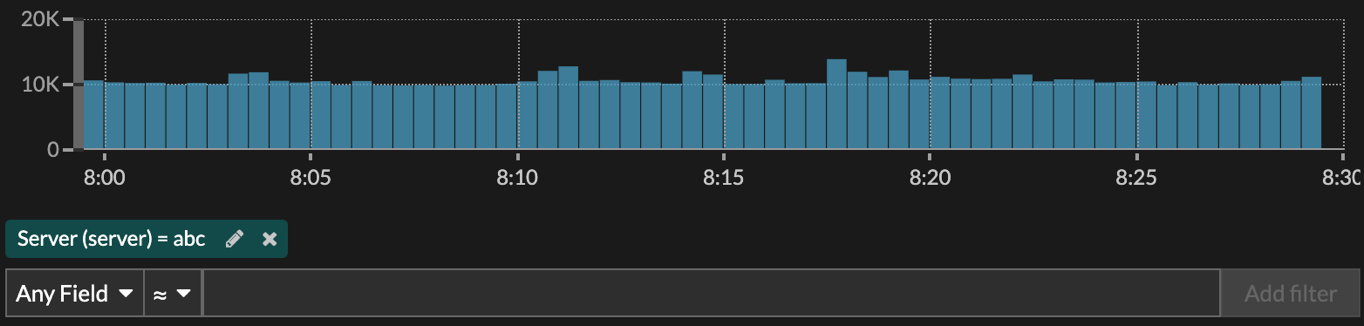
Your results only show records that match the filter.
The following operators can be selected, based on the selected field name:
| Operator | Description |
|---|---|
| = | Equals |
| ≠ | Does not equal |
| ≈ | Includes If records are stored on an ExtraHop recordstore, the includes operator matches whole words delineated by spaces and punctuation. For example, a search for "www.extra" would match "www.extra.com" but not "www.extrahop.com". For all other recordstores, the includes operator matches substrings, including spaces and punctuation. For example, a search for "www.extra" would match "www.extrahop.com", but a search for "www extra" would not match "www.extrahop.com". Regex and wildcard characters are not supported. |
| ≈/ | Excludes If records are stored on an ExtraHop recordstore, the excludes operator matches whole words delineated by spaces and punctuation. For example, a search for "extra" would exclude "www.extra.com" but not "www.extrahop.com". For all other recordstores, the excludes operator matches substrings, including spaces and punctuation. For example, a search for "www.extra" would exclude "www.extrahop.com", but a search for "www extra" would not exclude "www.extrahop.com". Regex and wildcard characters are not supported. |
| < | Less than |
| ≤ | Less than or equal to |
| > | Greater than |
| ≥ | Greater than or equal to |
| starts with | Starts with |
| exists | Exists |
| does not exit | Does not exist |
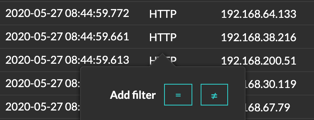
Filtering directly from record results
You can select any field entry displayed in either table view or verbose view in your record results and then click the pop-up operator to add the filter. Filters are displayed below the chart summary (except for the record type field, which is changed in the left pane).
Finding records in the ExtraHop system
- Type a search term in the global search field at the top of the screen and click Search Records to start a query across all stored records.
- From a device overview page, click Records to start a query filtered by that device.
- From a device group overview page, click View Records to start a query filtered by that device group.
- From a detection card, click View records to start a query filtered with the transactions associated with the detection.
- Click the Records icon
 from a chart widget, as shown in the following figure.
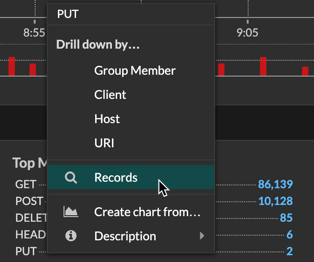
- Click the Records icon next to a detail metric after drilling down on a
top-level metric. For example, after drilling down on HTTP Responses by Server,
click the Records icon to create a query for records that contain a specific server
IP address.
Thank you for your feedback. Can we contact you to ask follow up questions?