Plan and monitor your migration with activity maps
Without proper planning and careful monitoring, painful disruptions to your business-critical workflows can occur during application or service migrations. After the migration is complete, there can be lingering questions about what was missed. Dependencies on the old environment could result in continued disruptions, security issues, and poor performance.
To make sure migration issues don't take you by surprise, you can create an activity map in the ExtraHop system. Activity maps display real-time device connections and protocol usage based on network activity. Get visibility into production traffic flows so you can quickly identify dependencies between devices before you decommission hardware or restart services.
In this walkthrough, we'll show you how to create activity maps to assist with migrating database servers. With an activity map, we can answer the following questions:
- What are the database dependencies across my network?
- What are the cross-tier dependencies on these databases?
- What are the dependencies for a single database server?
- Are there active connections before I decommission the server?
- Is the new database operating as expected?
Prerequisites
- You must have access to an ExtraHop system or to the ExtraHop Demo.
- You must have a user account with personal, limited, or full write privileges.
- Familiarize yourself with Activity maps.
Create an activity map to find all database dependencies
First, we'll create an activity map that displays all of the devices in the network that are sending database requests to servers hosting database instances.
-
In upper right corner of the page, click Activity
Map.
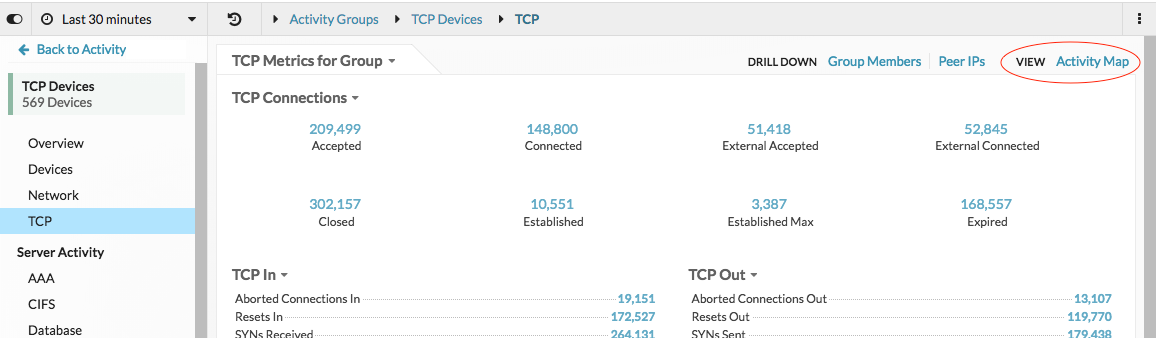
An activity map appears that displays all of the active connections across your network in the last 30 minutes, as shown in the following figure.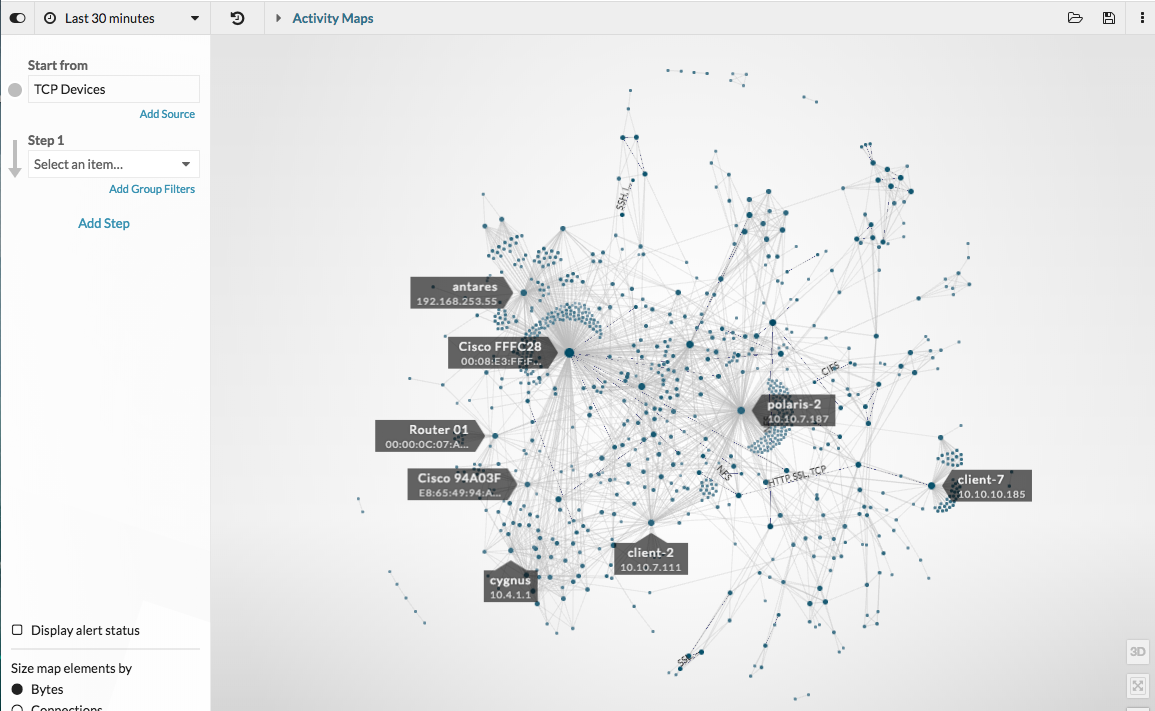
-
Click Database Clients and then click outside the
drop-down list to apply our selection.
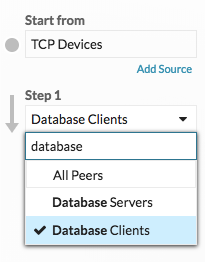
A map now displays all of the devices that are actively sending database requests to database servers, as shown in the following figure.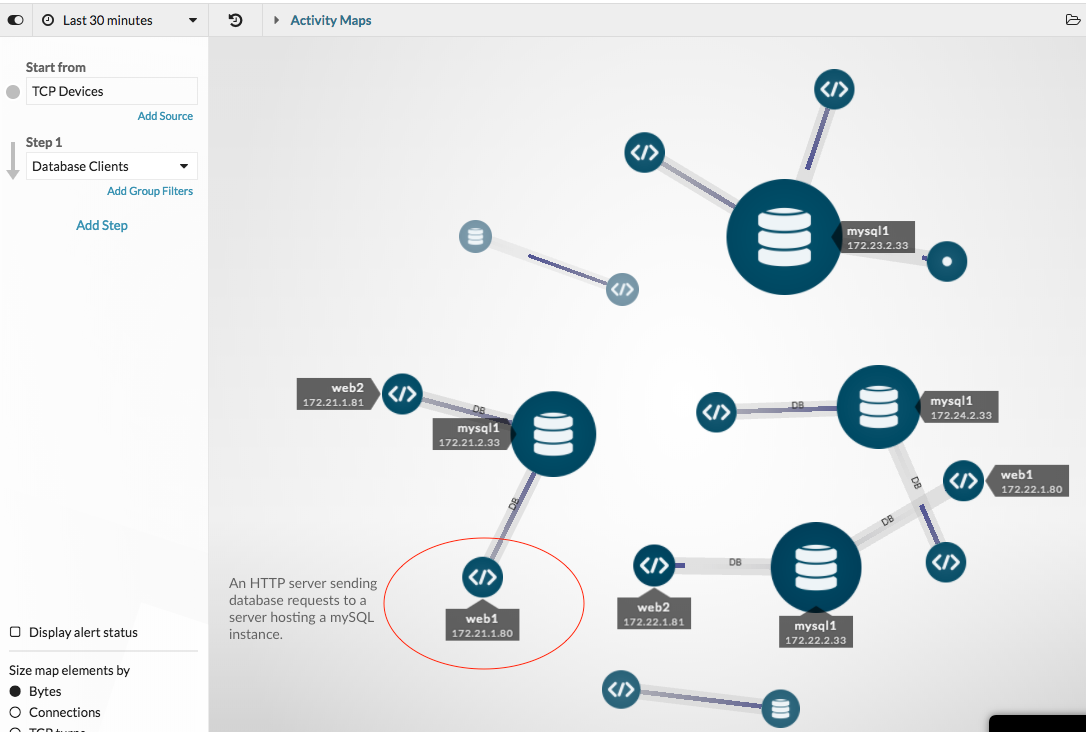
| Tip: | Click the global time selector in the upper left corner to change the time interval and see how database connections have changed over time. You can compare time intervals, which highlights the newest connections in green. |
Save the activity map
At this point, let's save this map for future reference. We can then continue to interact with and modify the map, and then load the original map at any time.
-
In the upper right corner of the page, click the Save
 icon.
icon.
- In the NAME section, type a name, such as Database Dependency Map.
- Skip the rest of the fields for now. You can always load your map to modify the description, permalink, and sharing options later.
- Click Save.
Find cross-tier dependencies
Let's add a step to the map to learn if there are dependencies from other web devices sending requests to our database clients, and then share our findings with other teams as needed.
-
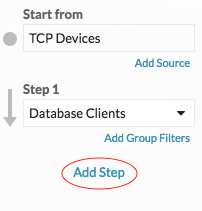
In the left pane, click Add Step. A drop-down list appears.
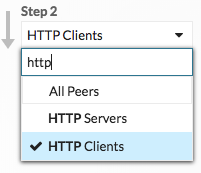
-
Click outside the drop-down list to apply our selection.
The map in the following figure shows additional HTTP clients and routers that might be affected by database outages. The larger circles and lines indicate a higher volume of traffic associated with those connections.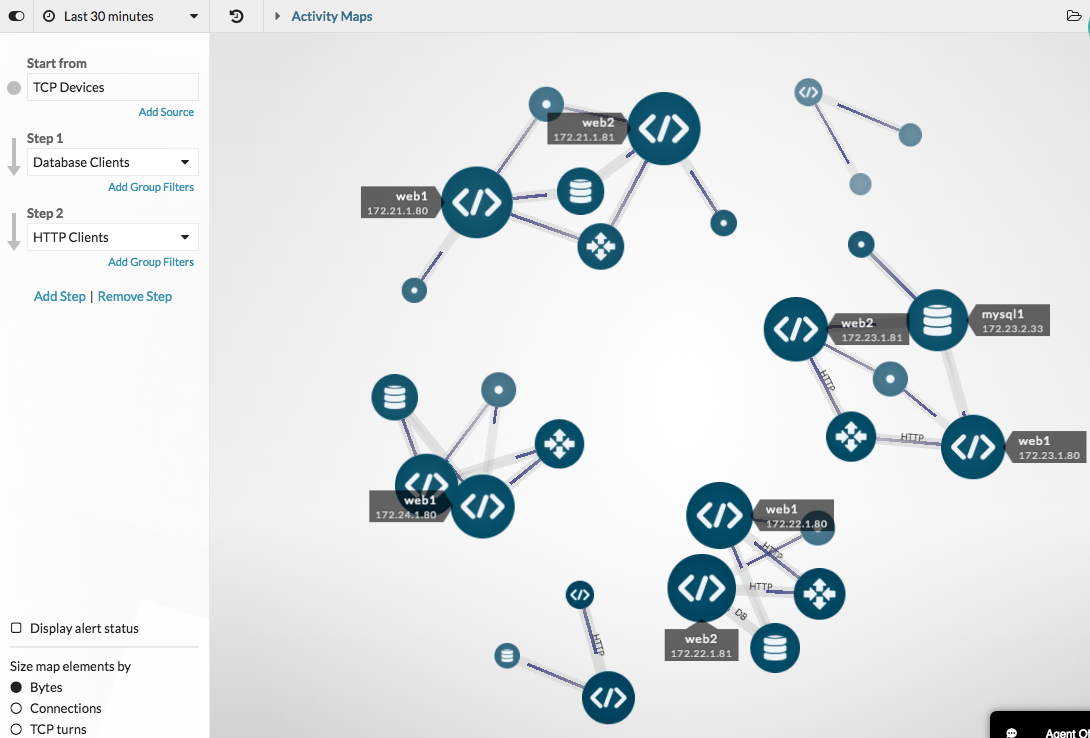
Tip: You can learn which of these HTTP clients are part of business-critical applications by applying device group filters. Create a device group that contains all the devices within an application, and then add a group filter in Step 2 of the activity map to only see the application devices. -
Hover over a device name to see its label.
Tip: Click the device name and then click Hold Focus to highlight the device in the map. 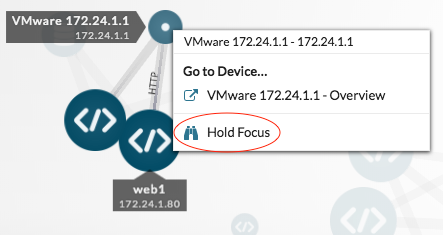
-
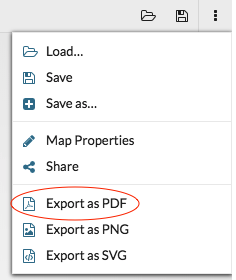
To help other teams understand the effect of the database migration on their
HTTP clients, let's create an image of the map that we can print or send as an
email attachment. Click the command menu in the upper right corner and select an
option, such as Export as PDF.
The file automatically downloads, which includes the hostname (if available) or IP address of every device in the activity map.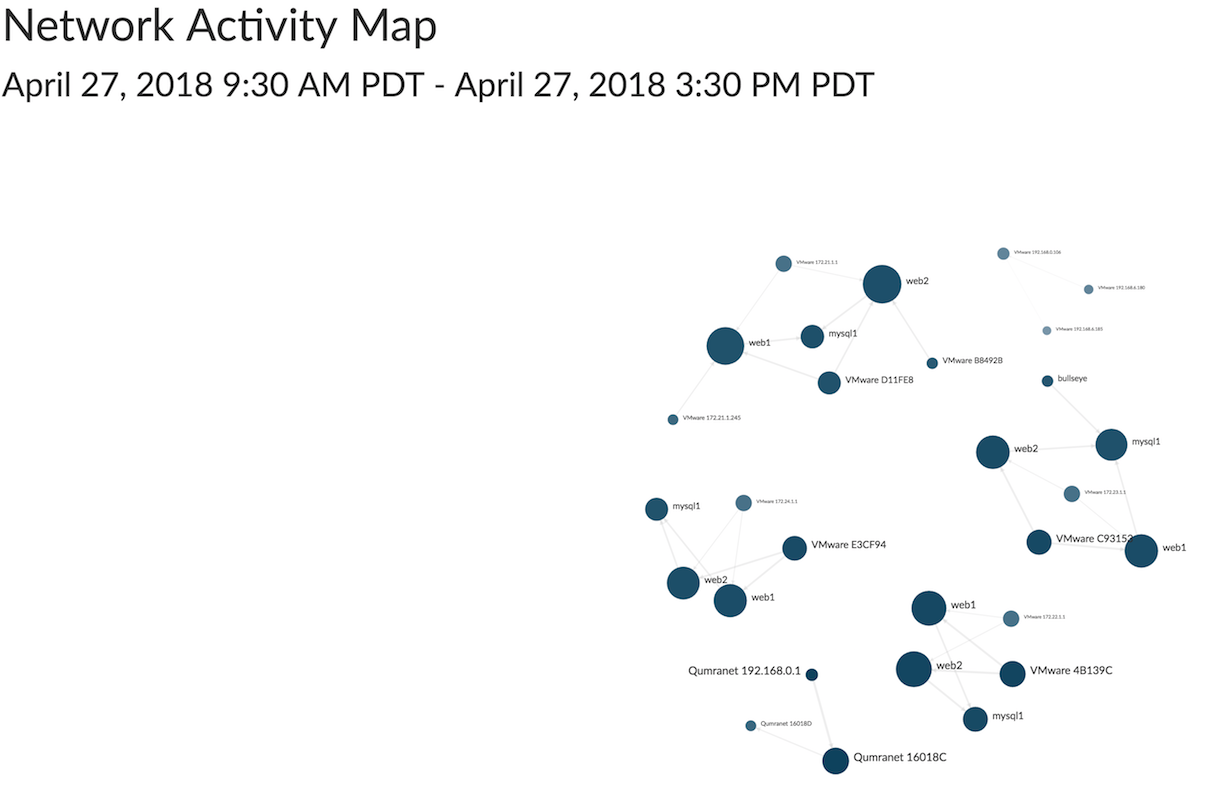
Tip: Save a version of this map for future reference by clicking the command menu and then clicking Save as. Type a unique name for the map, such as Database and Web Dependency Map. You can then share your map directly with ExtraHop users. 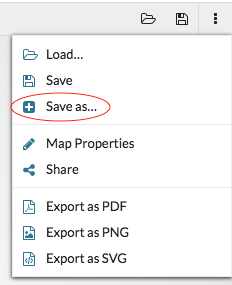
Find all dependencies for a single database server
Now that we have the big picture about database dependencies across the network, we can start mapping dependencies for each server hosting a database instance, including server connections to DNS servers, NTP servers, and load balancers.
-
In the Go to Device… section, click the device name.
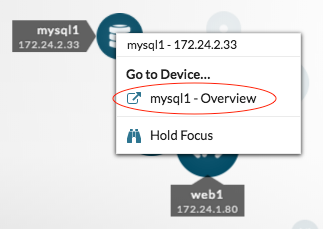
A protocol page for that device appears. -
In the upper right corner, click Activity Map. An
activity map appears that displays all active connections to that server.
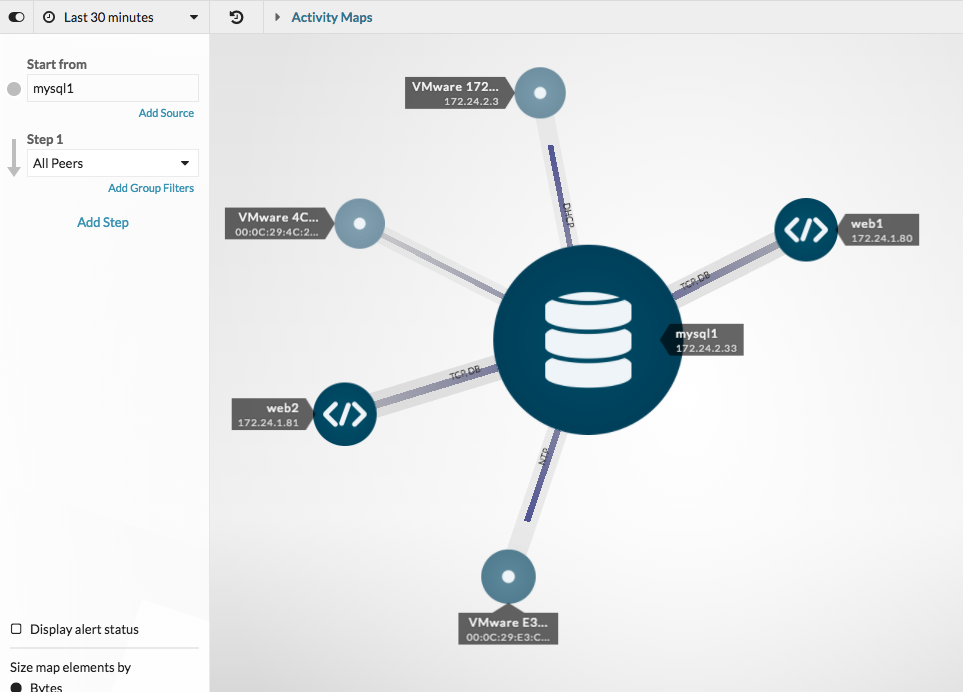
We can now save, export, or modify this map.
Double-check active connections before decommissioning the server
Migration day has arrived. Before we power down servers, let's double-check that all active connections to each server have been properly shut down. This step can minimize the risk of a service disruption.
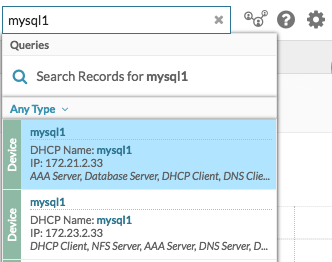
-
In the search field in the upper right corner, type the name of a database
server, such as mysql1.
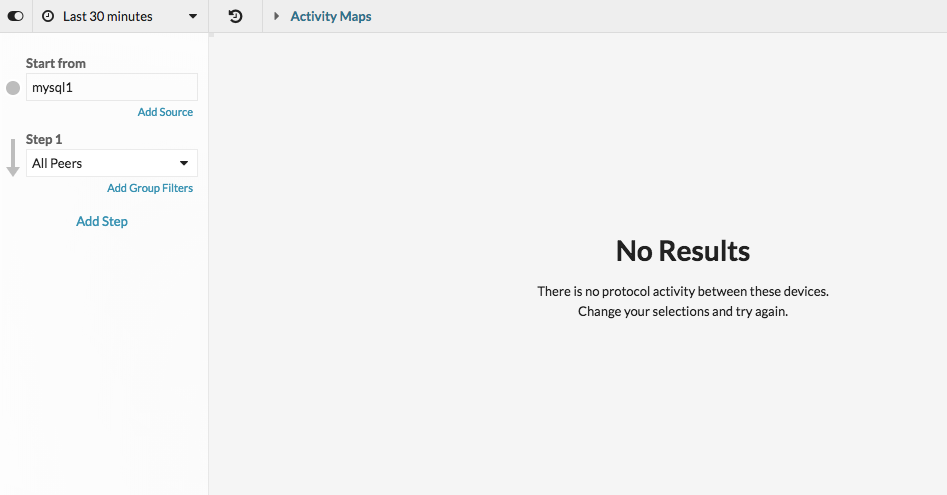
-
In the upper right corner of the page, click Activity
Map.
An activity map appears. The map will be empty if there are no active connections, as shown in the following figure.
Review connections with the new system
After the migration, we can create an activity map of database clients for each server with a database instance to confirm that the new system is working as expected. For example, you can compare new connections to old connections by reviewing PDF files of previous activity maps, or loading the Database Dependency Map and then adjusting the time interval.
Troubleshoot issues from an activity map
We're done! Activity maps can now help continuously monitor real-time traffic flows to migrated databases. If you find an issue, here are some ways you can troubleshoot and investigate data directly from an activity map.
| Potential Issue | How to Troubleshoot and Investigate |
|---|---|
| Investigate a suspicious device | If you find an unusual device connection that you want to investigate, click a circle for the suspicious device, and then select the device name from the Go to Device… section in the drop-down menu. You'll navigate to a protocol page that contains metrics observed for this device during that time interval. |
| Investigate high throughput connections | The larger the line that connects two devices, the higher number of bytes associated with this transaction. If you have a recordstore, you can investigate the transactions between devices. Click the line and then click Records. A record query opens and displays the entire transaction. |
| Display alert status for devices | If you have configured alerts, you can view which devices in the map have active alerts. Click the Display alert status checkbox in the lower left corner of the page. |
Thank you for your feedback. Can we contact you to ask follow up questions?