Schedule a dashboard report about Active Directory
Active Directory is a critical application that can be time-consuming to monitor and troubleshoot. In the ExtraHop Bundle for Active Directory, we've compiled dashboards that provide a comprehensive top-level view of Active Directory data that makes it easy to watch for potential problems.
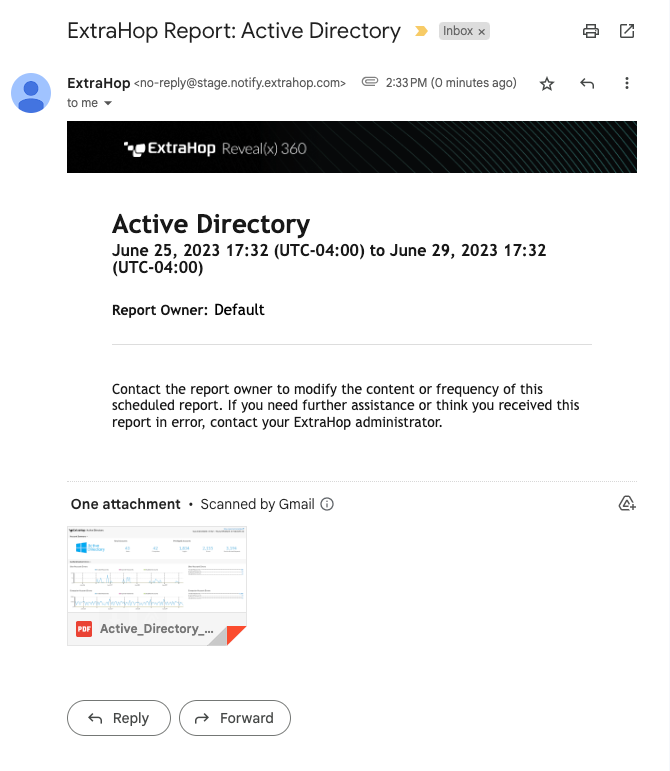
To help you easily monitor changes, you can schedule a report for your Active Directory dashboard. A dashboard report delivers a PDF file of dashboard data to any email recipient you specify.
In this walkthrough, we'll show you how to download and apply the bundle to your ExtraHop system, and how to schedule a bi-weekly dashboard report for your stakeholders about the health of your Active Directory environment.
| Note: | You can only schedule reports from a console. |
Prerequisites
- You must have access to a console.
- You must have a user account with limited or full write privileges to create a dashboard
Retrieve the ExtraHop Active Directory Bundle
Before you can upload the Active Directory Bundle to your ExtraHop system, you must retrieve the bundle from the ExtraHop Solution Bundle Index.
- Go to the Active Directory bundle page.
- If you have not already logged in to the ExtraHop website, click Login in the right pane and then specify a valid username and password.
- In the How to Obtain this Bundle section, click the link to create a service request to retrieve the bundle.
Upload and apply the Active Directory bundle to your ExtraHop system
In the following steps, you will upload and install the bundle you downloaded from the ExtraHop website on your console.
- Log in to the console through https://<extrahop-hostname-or-IP-address>.
- Click the System Settings icon in the upper right corner.
- Click Bundles.
- On the Bundles page, click Upload Bundle.
- Click Choose File, and then select the Active Directory .json file that you downloaded in the previous section.
-
In the Install Options section, select the following checkboxes:
- Click Install, and then click Done. Your bundle is installed and listed in the table!
Configure the Active Directory triggers
In the following steps, you will enable and configure a trigger to mirror the lockout and privileged account settings in your Active Directory environment.
-
Click the System Settings icon
 .
.
- Click Triggers.
-
Enable each trigger in the Active Directory v4 bundle by completing the
following steps.
- In the table, click a trigger name beginning with AD.
- Clear the Disable Trigger checkbox to enable the trigger.
- Click Save and Close.
-
Modify specific fields in the Kerberos trigger to match your Active Directory
accounts by completing the following steps.
Create, schedule, and save a dashboard report
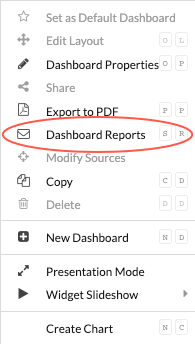
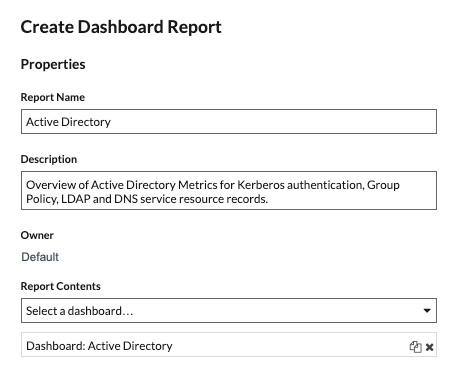
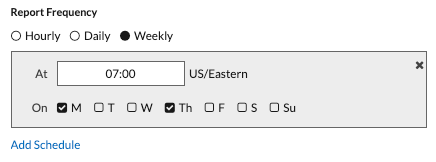
In the following steps, we'll show you how to schedule a weekly dashboard report that runs on Mondays and Thursdays at 7:00 am. We'll also show you how to send the dashboard report to a colleague, for example, someone who manages authentication services at your company.

| Note: | In the top right corner of the PDF file, click the View report on ExtraHop link to access the dashboard that generated the report. For ExtraHop users, the link opens the console and sets the dashboard to the time interval listed in the report. You can now investigate metrics in more detail from the dashboard. |
Add another email address to a saved report
If you want to make changes to a dashboard report, you can access it at any time. Let's add the email address for a new stakeholder to our Active Directory report.
Next steps
Over time, you might want to pause the delivery of the report by disabling a dashboard report. Or you might want to make changes to your dashboard to display different charts or data. For more information about changing a dashboard, check out these resources:- Edit a dashboard layout
- Using Dashboards to Organize and Present Data (Online training)
- Edit a dashboard chart with the Metric Explorer
- Edit a text box widget
Here are additional walkthroughs about building dashboards from scratch to monitor protocol metrics:
- Monitor website performance in a dashboard (Walkthrough)
- Monitor database health in a dashboard (Walkthrough)
- Monitor DNS errors in a dashboard (Walkthrough)


Thank you for your feedback. Can we contact you to ask follow up questions?