RevealX 360 Setup and Administration Guide
After you receive your initial email from ExtraHop Networks, there are a few procedures you must complete before you can start analyzing your traffic. This guide provides procedures for basic setup and administration of the RevealX 360 system.
| Video: | See the related training: RevealX 360 Administration Overview |
Activate your administrator account
The System and Access Administration privilege is granted to the email address that you provided during sign up.
- Open your Welcome to ExtraHop RevealX 360 email.
- Click the URL link to your RevealX 360 environment.
- At the login page, enter your email address and temporary password included in the email.
- Click Sign In.
- On the Change Password screen, enter a new password in both password fields and then click Send.
- From the Multi-Factor Authentication Setup page, scan the QR code or manually enter the code that appears into your authenticator app.
- Enter the code provided by your authentication app into the Code field and then click Complete Setup.
- On the Success page, click Continue.
Configure your firewall rules
If your ExtraHop system is deployed in an environment with a firewall, you must open access to ExtraHop Cloud Services. For RevealX 360 systems that are connected to self-managed sensors, you must also open access to the cloud-based recordstore included with RevealX Standard Investigation
Open access to Cloud Services
For access to ExtraHop Cloud Services, your sensors must be able to resolve DNS queries for *.extrahop.com and access TCP 443 (HTTPS) on one of the following IP addresses that corresponds to your sensor license:
- 35.161.154.247 (Portland, U.S.A.)
- 54.66.242.25 (Sydney, Australia)
- 52.59.110.168 (Frankfurt, Germany)
Open access for the ExtraHop recordstore
For access to the cloud-based recordstore included with RevealX Standard Investigation, your sensors must be able to access outbound TCP 443 (HTTPS) to these fully-qualified domain names:
- bigquery.googleapis.com
- bigquerystorage.googleapis.com
- oauth2.googleapis.com
- www.googleapis.com
- www.mtls.googleapis.com
- iamcredentials.googleapis.com
You can also review the public guidance from Google about computing possible IP address ranges for googleapis.com.
In addition to configuring access to these domains, you can also configure the global proxy server settings.
Add and manage users
-
From the Overview page, click System Settings
 and then click
User Access.
and then click
User Access.
Change user settings
Change user privileges
- In the Users section, click the name of the user you want to modify.
- In the left pane, select the new privilege level for the user and then click Save.
Reset multi-factor authentication
Delete a user
- In the Users section, click the name of the user you want to modify.
- Click Delete.
-
Select one of the following options:
- Transfer dashboards, collections, and activity maps owned by <username> to the following user: and then select a new user from the drop-down list.
- Delete all dashboards, collections, and activity maps owned by <username>
- Click Delete.
Manage global policies
Administrators can configure global policies that apply to all users who access the system.
-
From the Overview page, click System Settings
and then click
User Access.
-
From the Global Policies section, specify one or more of the following
options.
Option Description Device Group Edit Control Select to control whether all users with limited write privileges can create and edit device groups. When this policy is selected, all limited write users can create device groups and add other limited write users as editors to their device groups. Default Dashboard Specify the dashboard that users see when they log in to the system. Only dashboards shared with all users can be set as a global default. Users can override this default setting from the command menu of any dashboard. - Click Save Changes.
Configure an allow list
Configure a list of IPv4 addresses and CIDR blocks that are allowed to access RevealX 360.
-
From the Overview page, click System Settings
and then click
User Access.
- In the Allow List section click, Enable Allow List.
- Type a comma-separated list of the IPv4 addresses or CIDR blocks that are allowed to access the system. IPv6 addresses are not supported.
- Click Save. It can take several minutes for the allow list to become active.
Configure the system time
The System Time page displays the default system time settings and the default display time configured for your ExtraHop system.
Here are some considerations about system time settings in RevealX 360:
- You must have System Administrator privileges or better to make changes.
- The default system time is a global time zone applied to your ExtraHop system.
- The default display time for users is the time zone that all users see in the ExtraHop system unless a user manually changes their displayed time zone.
-
From the Overview page, click System Settings
and then click
All Administration.
- From the Console Settings section, click System Time.
- From the Default System Time drop-down list, select the time zone you want.
-
From the Default Display Time for Users section, select
one of the following options:
- Browser time
- System time
- UTC
- Click Save Changes.
Enable AI Search Assistant
The AI Search Assistant enables you to search for devices with questions, or prompts, written in natural, everyday language to quickly build complex queries.
The AI Search Assistant leverages a third-party LLM. User prompts are not provided for LLM training or stored by the LLM, but can be retained by the ExtraHop system for product improvement purposes. See the AI Search Assistant FAQ for more information.
Before you begin
- Your user account must have privileges on RevealX 360 for System and Access Administration.
- Your RevealX 360 system must be connected to ExtraHop Cloud Services.
-
From the Overview page, click the System Settings icon
and then
click All Administration.
- From the Console Settings section, click AI Search Assistant.
- Enable the AI Search Assistant by selecting I agree to enable AI search assistant and send natural language searches to ExtraHop Cloud Services.
- Click Save Changes.
Next steps
Find devices with AI Search AssistantConfigure device name precedence
Discovered devices are automatically named based on multiple sources of network data such as protocols, MAC or IP addresses, or device roles. When multiple names are found for a device, the order of device name precedence specifies which name is displayed by default in the ExtraHop system.
The ExtraHop system defaults to the following order of precedence:
- Custom Name
- Cloud Instance Name
- CDP Name
- DHCP Name
- DNS Name
- NetBIOS Name
- Default Name
Before you begin
- Device name precedence settings only apply to the console or sensor on which the settings are configured.
-
From the Overview page, click System Settings
and then click
All Administration.
Enable detection tracking
Detection tracking enables you to assign a detection to a user, set the status, and add notes. You can track detections directly in the ExtraHop system, with a third-party external ticketing system, or with both methods.
| Note: | You must enable ticket tracking on all connected sensors. |
Before you begin
- You must have access to an ExtraHop system with a user account that has Administration privileges.
- After you enable external ticket tracking, you must configure third-party ticket tracking by writing a trigger to create and update tickets on your ticketing system, then enable ticket updates on your ExtraHop system through the REST API.
- If you disable external ticket tracking, previously stored status and assignee ticket information is converted to ExtraHop detection tracking. If detection tracking from within the ExtraHop system is enabled, you will be able to view tickets that already existed when you disabled external ticket tracking, but changes to that external ticket will not appear in the ExtraHop system.
-
From the Overview page, click System Settings
and then click
All Administration.
- (Optional):
After you select the option to enable external integrations, specify the URL
template for your ticketing system and add the $ticket_id
variable at the appropriate location. For example, type a complete URL
such as https://jira.example.com/browse/$ticket_id. The
$ticket_id variable is replaced with the ticket ID
associated with the detection.
After the URL template is configured, you can click the ticket ID in a detection to open the ticket in a new browser tab.
Next steps
If you enabled external ticket tracking integrations, you must continue on to the following task:Configure third-party ticket tracking for detections
Ticket tracking enables you to connect tickets, alarms, or cases in your work-tracking system to ExtraHop detections. Any third-party ticketing system that can accept Open Data Stream (ODS) requests, such as Jira or Salesforce, can be linked to ExtraHop detections.
Before you begin
- You must have selected the third-party detection tracking option in Administration settings.
- You must have access to an ExtraHop system with a user account that has System and Access Administration privileges.
- You must be familiar with writing ExtraHop Triggers. See Triggers and the procedures in Build a trigger.
- You must create an ODS target for your ticket tracking server. See the following topics about configuring ODS targets: HTTP, Kafka, MongoDB, syslog, or raw data.
- You must be familiar with writing REST API scripts and have a valid API key to complete the procedures below. See Generate an API key.
Write a trigger to create and update tickets about detections on your ticketing system
This example shows you how to create a trigger that performs the following actions:
- Create a new ticket in the ticketing system every time a new detection appears on the ExtraHop system.
- Assign new tickets to a user named escalations_team in the ticketing system.
- Run every time a detection is updated on the ExtraHop system.
- Send detection updates over an HTTP Open Data Stream (ODS) to the ticketing system.
The complete example script is available at the end of this topic.
-
Click the System Settings icon and then click
Triggers.
const summary = "ExtraHop Detection: " + Detection.id + ": " + Detection.title;
const description = "ExtraHop has detected the following event on your network: " + Detection.description
const payload = {
    "fields": {
        "summary": summary,
        "assignee": {
            "name": "escalations_team"
        },
        "reporter": {
            "name": "ExtraHop"
        },
        "priority": {
            "id": Detection.riskScore
        },
        "labels": Detection.categories,
        "mitreCategories": Detection.mitreCategories,
        "description": description
    }
};
const req = {
    'path': '/rest/api/issue',
    'headers': {
        'Content-Type': 'application/json'
    },
    'payload': JSON.stringify(payload)
};
Remote.HTTP('ticket-server').post(req);Send ticket information to detections through the REST API
After you have configured a trigger to create tickets for detections in your ticket tracking system, you can update ticket information on your ExtraHop system through the REST API.
Ticket information appears in detections on the Detections page in the ExtraHop system. For more information, see the Detections topic.
The following example Python script takes ticket information from a Python array and updates the associated detections on the ExtraHop system.
#!/usr/bin/python3

import json
import requests
import csv

API_KEY = '123456789abcdefghijklmnop'
HOST = 'https://extrahop.example.com/'

# Method that updates detections on an ExtraHop system
def updateDetection(detection):
    url = HOST + 'api/v1/detections/' + detection['detection_id']
    del detection['detection_id']
    data = json.dumps(detection)
    headers = {'Content-Type': 'application/json',
               'Accept': 'application/json',
               'Authorization': 'ExtraHop apikey=%s' % API_KEY}
    r = requests.patch(url, data=data, headers=headers)
    print(r.status_code)
    print(r.text)

# Array of detection information
detections = [
                 {
                     "detection_id": "1",
                     "ticket_id": "TK-16982",
                     "status": "new",
                     "assignee": "sally",
                     "resolution": None,
                 },
                 {
                     "detection_id": "2",
                     "ticket_id": "TK-2078",
                     "status": None,
                     "assignee": "jim",
                     "resolution": None,
                 },
                 {
                     "detection_id": "3",
                     "ticket_id": "TK-3452",
                     "status": None,
                     "assignee": "alex",
                     "resolution": None,
                 }
             ]

for detection in detections:
    updateDetection(detection)
| Note: | If the script returns an error message that the SSL
certificate verification failed, make sure that a trusted certificate has
been added to your sensor or console. Alternatively, you can add the
verify=False option to bypass certificate verification. However, this
method is not secure and is not recommended. The following code sends an HTTP GET
request without certificate
verification:requests.get(url, headers=headers, verify=False) |
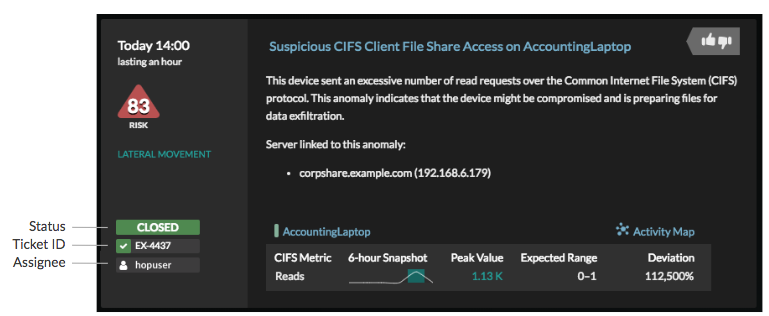
- Status
- The status of the ticket associated with the detection. Ticket tracking
supports the following statuses:
- New
- In Progress
- Closed
- Closed with Action Taken
- Closed with No Action Taken
- Ticket ID
- The ID of the ticket in your work-tracking system that is associated with the detection. If you have configured a template URL, you can click the ticket ID to open the ticket in your work-tracking system.
- Assignee
- The username assigned to the ticket associated with the detection. Usernames in gray indicate a non-ExtraHop account.
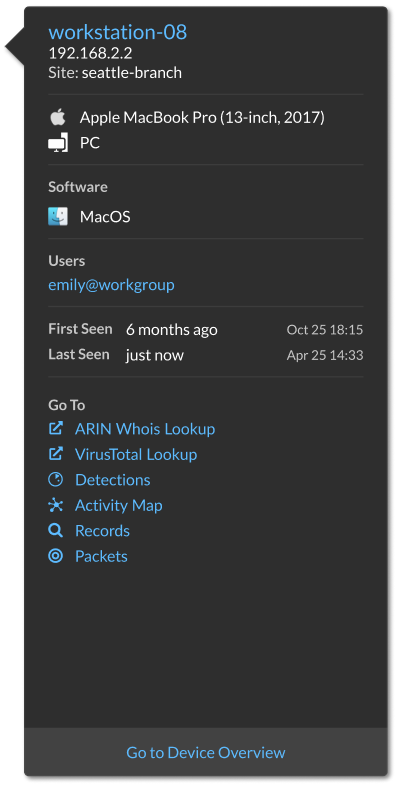
Configure endpoint lookup links
Endpoint lookup enables you to specify external IP address tools that are available for retrieving up information about endpoints within the ExtraHop system. For example, when you click or hover over an IP address, lookup tool links are displayed so that you can easily find information about that endpoint.
- ARIN Whois Lookup
- VirusTotal Lookup
-
From the Overview page, click System Settings
and then click
All Administration.
Connect sensors
Add sensors to RevealX 360 to monitor your network traffic.
Self-managed sensors and packetstores can also be connected from within the RevealX 360 console. Note that if you have an existing console, you must disconnect the console before connecting your self-managed sensors to RevealX 360.
Integrations
The Integrations page displays a catalog of products and solutions from third-party vendors that work with the ExtraHop system. Integrations can provide insight into how your devices are communicating in your environment or improve your ability to investigate threats and issues. Click a tile to view more information about the integration.
Requirements and configurations vary by integration. Some integrations require that you install and configure an app or add-on, and most integrations require that you create credentials to access the ExtraHop REST API.
For integrations that transfer data, you can add static source IP addresses to your security controls to allow requests from the RevealX 360 console. Add the IP addresses designated for your region:
- United States (US)
-
- 44.239.88.18
- 54.191.141.54
- Europe, Middle East, and Africa (EMEA)
-
- 18.153.205.130
- 18.199.126.90
- Asia-Pacific (APAC)
-
- 52.64.254.4
- 54.66.82.248
Multi-factor authentication
Multi-factor Authentication (MFA) is a security enhancement that requires you to provide two forms of credentials when you log in to your account. In addition to your ExtraHop credentials, you must supply credentials from a 3rd-party authenticator app.
Select and download an authentication application to your device and generate secure, six-digit codes when you log in to your RevealX 360 system.
There are many authenticator apps to select from. The following steps are a general guideline, but you should also review the help documentation for the app you select.
- Choose a device, such as a computer or mobile device (phone or tablet), on which you can install apps.
-
Download and install an authentication app on the device. Here are some popular
options:
- Android and iOS: Google Authenticator, Authy
- Windows and macOS: 1Password, OTP Manager
- Chrome extensions: Authenticator
- Open a new browser and sign in to your ExtraHop RevealX 360 system.
- Follow the instructions to scan or enter the code that appears on the ExtraHop Multi-Factor Authentication setup screen, and then enter the credentials provided by your authenticator app.
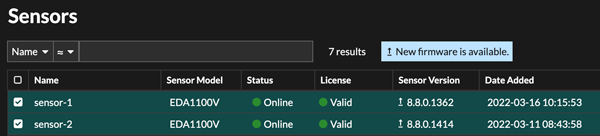
Upgrade connected sensors in RevealX 360
Administrators can upgrade sensors that are connected to RevealX 360.
Before you begin
- Your user account must have privileges on RevealX 360 for System and Access Administration or System Administration.
- Sensors must be connected to ExtraHop Cloud Services
- Notifications appear when a new firmware version is available
- You can upgrade multiple sensors at the same time
-
From the Overview page, click System Settings
and then click
Sensors.
Sensors that are eligible for upgrade display an up arrow in the Sensor Version field.
Active device count and limit
The Active Device Count and Limit chart enables you to monitor whether your active device count has exceeded the licensed limit. For example, an ExtraHop system with a 20,000-50,000 devices band is allowed up to 50,000 devices.
Click System Settings
![]() and then click
All Administration to view the chart.
and then click
All Administration to view the chart.
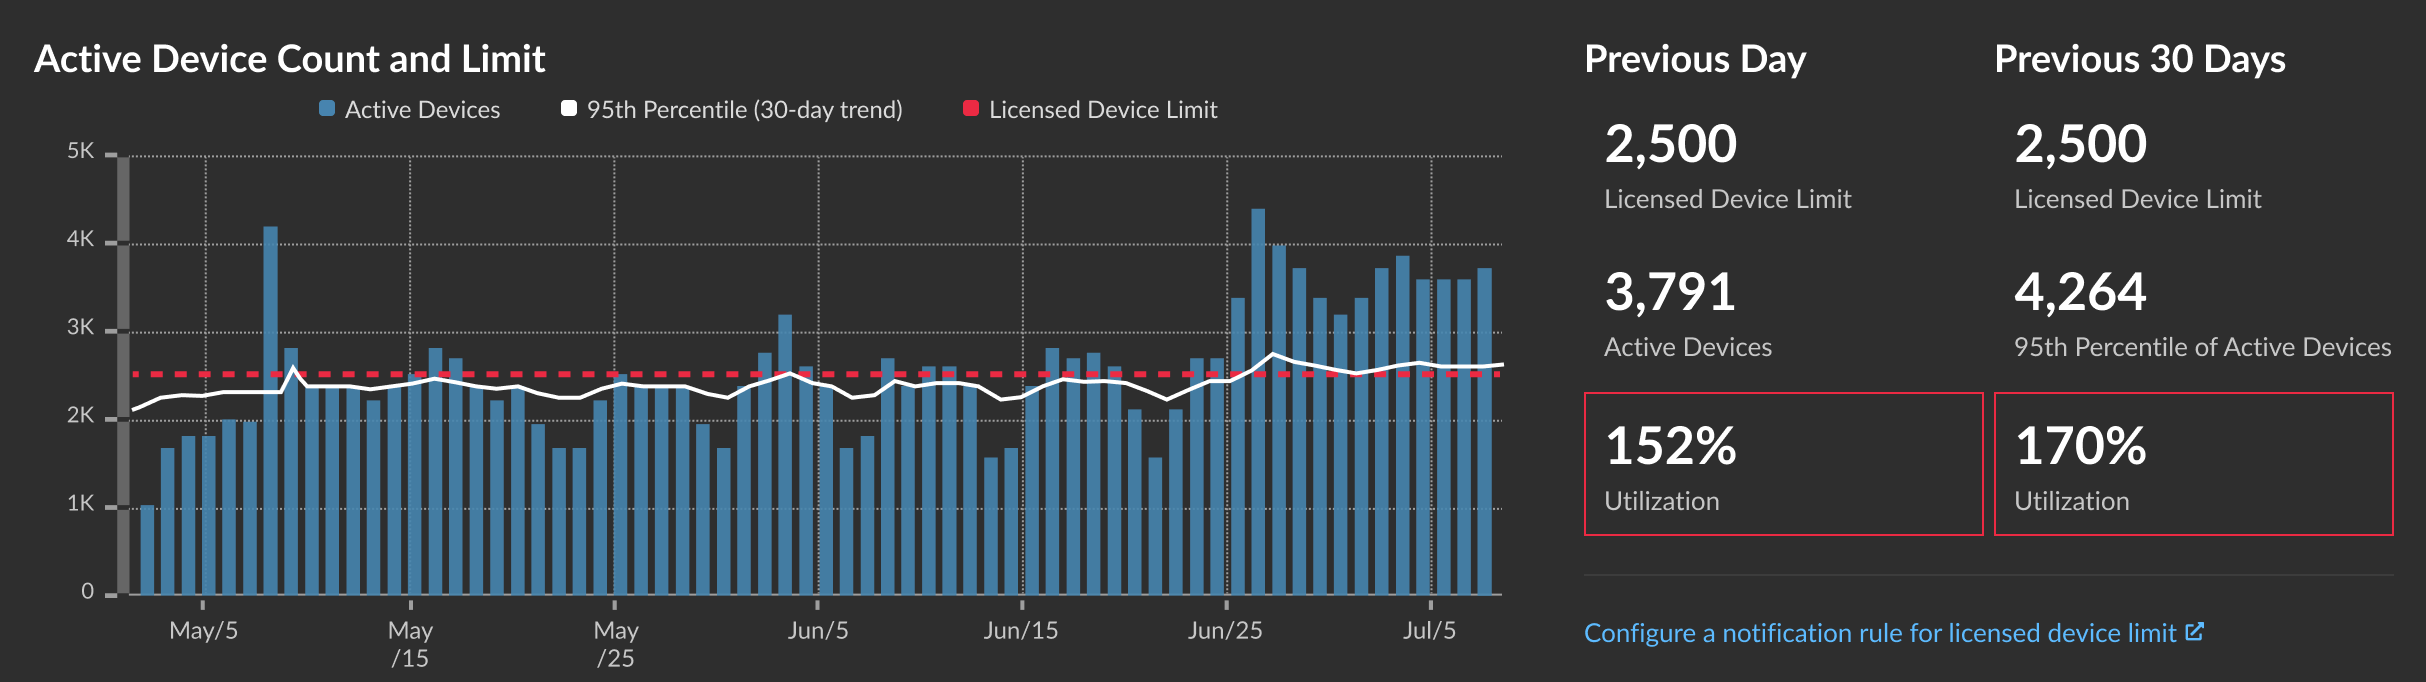
The Active Device Count and Limit chart displays the following metrics:
- The dashed line represents the licensed device limit.
- The solid line represents the 95th percentile of active devices observed each day for the last 30 days.
- The vertical bars represent the maximum number of active devices observed each day for the last 30 days.
This page also displays the following metrics:
- The licensed device limit for the previous day and for the last 30 days.
- The number of active devices observed the previous day.
- The 95th percentile of active devices observed over the last 30 days.
- The utilization percentage of the licensed device limit for the previous day and for the last 30 days. Utilization is the active device count divided by the licensed limit.
You can create a system notification rule to warn you if utilization exceeds a specified percentage or exceeds 100% of your licensed device limit. Limit percentages are customizable when you create a rule. If you find that you are consistently approaching or over your licensed limit, we recommend that you work with your sales team to move to the next available capacity band.
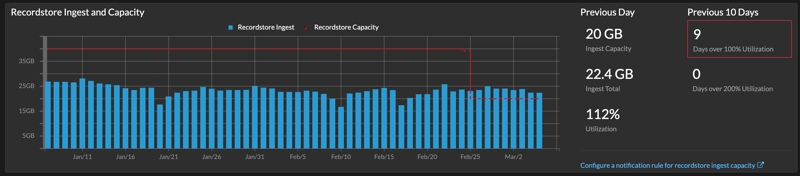
Record ingest and capacity
The Record Ingest and Capacity chart on the main Administration page enables you to monitor the record ingest and capacity levels and confirm that the capacity limit is optimal for your environment.
The dashed red line on the bar chart represents your record ingest capacity, and the blue bars represent the amount of ingest each day during the selected interval. You can select an interval of 30, 90, or 180 days depending on the amount of licensed record lookback, which is displayed to the right of the bar chart.
Ingest and utilization charts are displayed to help you track record ingest. You can create a system notification rule to warn you if record ingest exceeds a specified percentage or exceeds 100% of your daily record ingest capacity.
If you find that you are consistently over your allotted capacity, contact your ExtraHop sales representative.
| Important: | No records are written to the recordstore from a sensor with an expired license. If the license is renewed, records will start being sent again. However, there will be a gap in the records written between the expired and renewed period. |
Audit Log
The audit log provides data about the operations of your ExtraHop system, broken down by component. The audit log lists all known events by timestamp, in reverse chronological order.
Audit log events
The following events on an ExtraHop system generate an entry in the audit log.
| Category | Event |
|---|---|
| Agreements |
|
| API |
|
| Sensor Migration |
|
| Browser sessions |
|
| Cloud Services |
|
| Console |
|
| Dashboards |
|
| Datastore |
|
| Detections |
|
| Exception files |
|
| ExtraHop recordstore records |
|
| ExtraHop recordstore cluster |
|
| ExtraHop Update Service |
|
| Firmware |
|
| Global Policies |
|
| Integrations |
|
| License |
|
| Login to the ExtraHop system |
|
| Login from SSH or REST API |
|
| Modules |
|
| Network |
|
| Offline capture |
|
| PCAP |
|
| Remote Access |
|
| RPCAP |
|
| Running Config |
|
| SAML Identity Provider |
|
| SAML login |
|
| SAML privileges |
|
| SSL decryption |
|
| SSL session keys |
|
| Support account |
|
| Support Script |
|
| Syslog |
|
| System and service status |
|
| System time |
|
| System user |
|
| TAXII feeds |
|
| Threat briefings |
|
| ExtraHop packetstore |
|
| Trends |
|
| Triggers |
|
| User Groups |
|
Thank you for your feedback. Can we contact you to ask follow up questions?