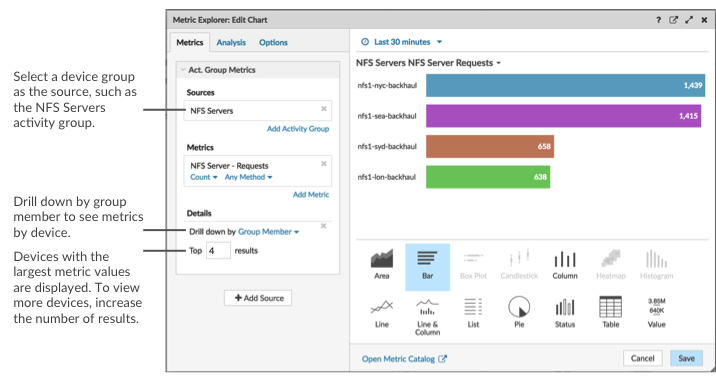
If you have a chart that displays a device group, you can view metrics by top devices
in the group, instead of viewing a single value for the entire device group. Drilling down
by group member in the Metric Explorer lets you view up to 20 devices in the chart.

If you see fewer groups members in a chart than the number of results you
specified, this could be because you selected a built-in device group with a small
number of devices. For built-in device groups, devices are dynamically placed into a
group based on the type of protocol traffic they are associated with or the role
they are assigned.
Before you begin
Create a chart that contains a device group as the selected
source. Save the chart to a dashboard.
-
Log in to the ExtraHop system through
https://<extrahop-hostname-or-IP-address>.
-
At the top of the page, click Dashboards .
-
Launch the Metric
Explorer to edit the chart by completing the following steps:
-
From the dashboard dock, select a dashboard containing the chart that
you want to edit.
-
Click the chart title and select Edit.
-
In the Details field, click Drill down by
<None>, where
<None> is the name of the detail metric currently
displayed in your chart. Then, select Group Member.
-
In the top results field, enter the number of group members that you want to
display. These devices will have the highest metric values. You can display up
to 20 group members.
-
Click Save to close the Metric Explorer.
| Note: | If you drill down by group member, you cannot perform additional drill
downs to see detail metrics for each device by a key. To see detail metrics
by key for a device, we recommend creating another chart with specific
devices selected as the source. |

Thank you for your feedback. Can we contact you to ask follow up questions?