Monitor new devices on your network

Every new device that connects to your network adds potential risk, so it's important to quickly identify newly-discovered devices and monitor their activity. The ExtraHop system automatically creates a device group for devices discovered in the past day and the past week. However, this device group collects limited metrics by default and isn't visible from your system dashboard.

In this walkthrough, we'll first prioritize the newly-discovered devices group to gather comprehensive metrics , then we'll create a dashboard to monitor device activity, and finally we'll create a daily report to keep track of interesting changes.

After completing this walkthrough, you will be able to answer the following questions:

  • How many new devices appeared on my network in the last week?
  • How much inbound and outbound traffic is associated with new devices?
  • What are the daily changes in new device activity?
  • How to learn more when you find interesting device activity?

Prerequisites

Prioritize new devices for Advanced Analysis

First, we'll prioritize the newly-discovered device group to collect comprehensive metrics through Advanced Analysis. By prioritizing your group for Advanced Analysis, you ensure that the ExtraHop system collects L2-L7 metrics for new devices.

If your console is not managing analysis priorities for your sensors, you can perform this walkthrough from a sensor instead and omit the final section. (Scheduled reports can only be created from a console.)

  1. Log in to the ExtraHop system through https://<extrahop-hostname-or-IP-address>.
  2. Click the System Settings icon and then click Analysis Priorities.
  3. In the For Advanced Analysis section, click adding a group to add an initial group or Add Group to add additional groups.
  4. Type new devices in the GROUP drop-down list, and then select New Devices (Last 7 Days).
  5. At the top of the page, click Save.
Now let's create a dashboard to monitor new device activity.

Create a dashboard

By creating a dashboard for your group, you can visualize device activity at a glance.

  1. At the top of the page, click Dashboards.
  2. Click the command menu in the upper right corner and select New Dashboard to create an empty dashboard.
  3. Type a name for your dashboard in the Title field. For this walkthrough, type New Devices.
  4. Click Create.
    When you create a new dashboard, a workspace opens in an editable layout mode. This workspace contains a single region and two empty widgets: a chart and a text box.
  5. Delete the text box by completing the following steps:
    1. Click the command menu in the upper right corner of the text box widget and select Delete.
    2. Click Delete Widget.
      Text box widgets can include custom explanatory text about a dashboard or chart. For this walkthrough, however, we won't be adding text.
Next, let's add charts to our dashboard that show which new devices were discovered in the last week and what they did on the network.

Add a chart that shows the traffic throughput for new devices

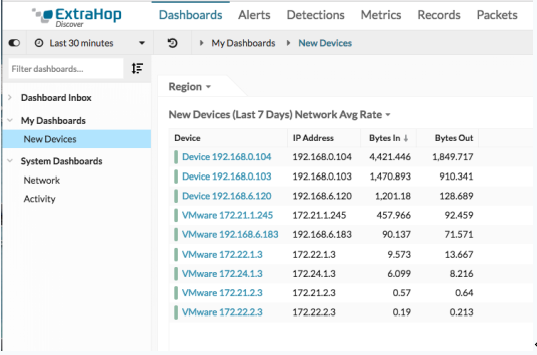
In this step, we'll create a table that lists all of the devices that were discovered within the last seven days. The amount of incoming and outgoing traffic that was observed over the last week displays next to each device. From this dashboard, you can learn how much traffic each new device is generating.
  1. Click the empty chart widget in your newly created dashboard to open the Metric Explorer.
  2. Click Add Source.
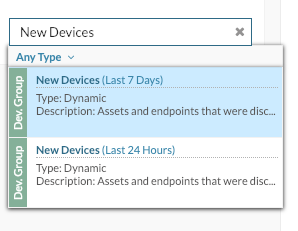
  3. In the Sources field, type New Devices to filter the results, and then select New Devices (Last 7 Days) for a connected sensor.


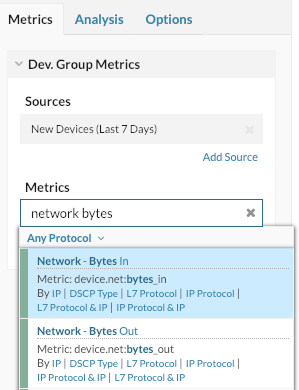
  4. In the Metrics field, type network bytes to filter results from all of the available metrics, and then click Network Bytes In.


  5. Click Add Metric, type network bytes, and then select Network Bytes Out.
  6. From the bottom of the window, click Table.
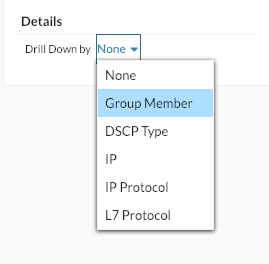
  7. In the Details section, click None, and then click Group Member.


  8. (Optional): Click the Options tab. In the Units section, click Convert bytes to bits. The throughput now displays in bits per second.
  9. (Optional): Below the metric, click Average Rate and then click Count.
    The total amount of throughput now displays instead of an average count of throughput per second.
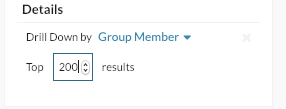
  10. In the Top results field, click 5, type 200, and then press Enter.


  11. Click Save.
  12. Click Exit Layout Mode.
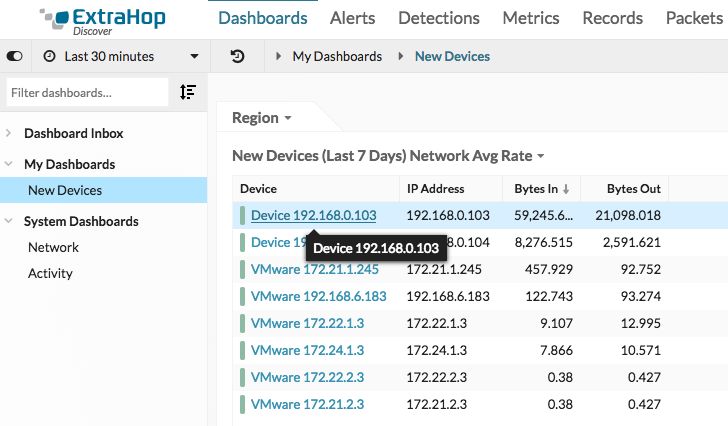
The table now shows all of the newly-discovered devices over the last week and their throughput, as shown in the following figure.

Now, let's set up a daily report to monitor new devices.

Schedule a daily report

After creating your New Devices dashboard, you can schedule a daily report about new device activity over the last day. This report is a PDF file of the dashboard, which can be emailed to any recipient. Scheduled reports can only be created from a console.

In the following steps, we'll show you how to schedule a daily report that runs at 7:00 am.
  1. From the console, click Dashboards at the top of the page, and then click the New Devices dashboard in the left pane.
    Note:Each report can only link to one dashboard. You can create a report for any dashboard that you own or that has been shared with you.
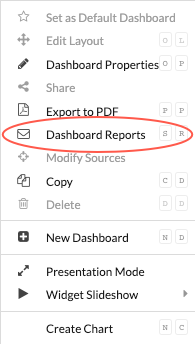
  2. In the upper right corner of the dashboard page, click the command menu , and then click Dashboard Reports.
  3. A Scheduled Reports page appears that displays all the reports stored on the console.
    If no reports have been created, this page is empty.
  4. In the upper right corner, click Create.
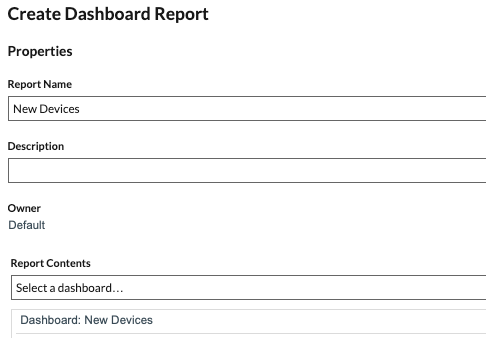
  5. In the Report Name field, the name of the dashboard is displayed, as shown in the following figure.

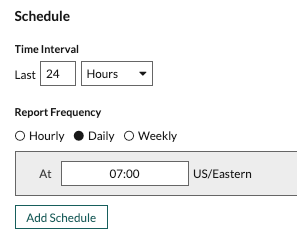
  6. Scroll down to the Time Interval section. Leave the default setting of Last 1 Days. The report will include new device traffic that occurred over the course of the previous day.
    Note:For more information about how to configure each field, see Create a scheduled report.
  7. In the Report Frequency section, click in the At drop-down list, and click 07:00 to send a daily email at 7:00am.

    Note:The system time that is set for your console determines the time zone that is displayed when configuring your report. For more information about configuring the time zone for your console through the ExtraHop Administration settings, see Configure the system time.
  8. Type your email address in the Recipients field.
    Note:The ExtraHop system does not store email addresses for ExtraHop user accounts. However, if your ExtraHop Reveal(x) Enterprise system is configured with an email group, you can select a notification group to email. Reveal(x) 360 does not support email notification groups.
  9. (Optional): Click Send Now to send a test email to the recipient.
  10. Click Done. Your scheduled report now appears on the Dashboard Reports page, as shown in the following figure.

  11. In the bottom right corner of the page, click Done again to return to your dashboard.
When you receive the emailed PDF file, click View report on ExtraHop to access the dashboard that generated the report. For ExtraHop users, the link opens the console and the dashboard is set to the time interval listed in the report.

In the next section, we'll look at some of the ways you can investigate devices that have unusual activity.
Next steps: Investigate a new device

If you find that a new device is sending a large amount of traffic across your network, you can visit a protocol page to learn what the device is doing.

  1. Log in to the ExtraHop system through https://<extrahop-hostname-or-IP-address>.
  2. At the top of the page, click Dashboards.
  3. Click the New Devices dashboard in the left pane, and then click the device name, as shown in the following figure.


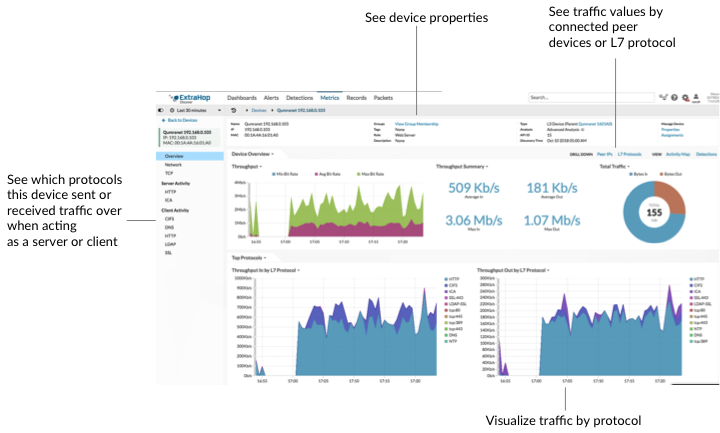
    A protocol page appears, which contains related metric data for that device.

    From the protocol page, you can answer the following questions.
    What is the primary type of activity for this device?
    Look at the charts for Throughput In by L7 Protocol and Throughput Out by L7 Protocol. The traffic volume is broken down by application-level (L7) protocols. In the example below, we can see that HTTP transactions are the primary type of traffic for this device.

    What are the transactions associated with the high amounts of traffic?
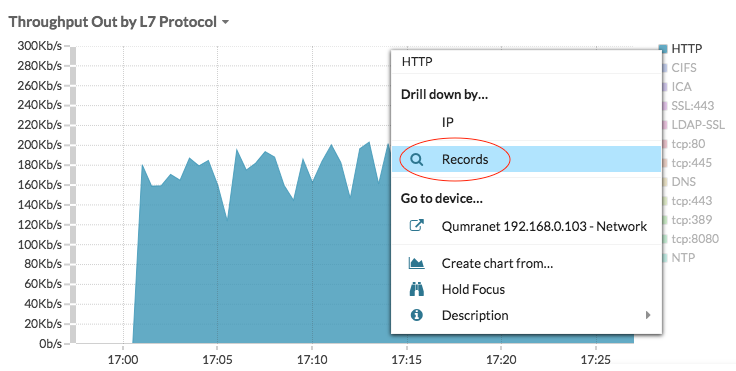
    If you have a connected recordstore, click a protocol label in the chart, and then click Records.

    You can see transaction-level details.

    Which peer devices are connected to this new device?
    There are two ways to see which network devices are connected to your device.
    • In the DRILL DOWN section, click Peer IPs to see a list of traffic values by connected peer devices.

    • In the VIEW section, click Activity Map to visualize connections with peer devices by protocol activity.

Last modified 2024-04-02