Geomaps
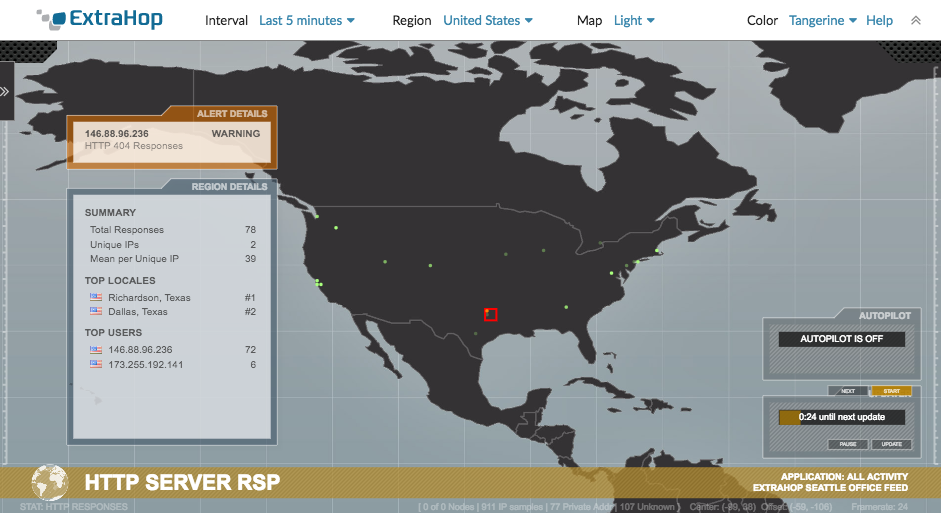
A geomap is a visual representation of worldwide activity based on a single count metric. The ExtraHop system determines the originating IP address of each metric event and plots it to a regional data point on the geomap.

Generate a geomap on-the-fly from a metric detail page. You can only generate geomaps for count metrics that can be broken down by an IP address.
View regional details
A metric tracked on a geomap displays a data point for each location from where metric data originates. For example, assign an SSH session metric to a geomap to find out if SSH attempts are coming from unauthorized locations. Each data point displays the IP addresses that sent the requests. Click a data point to view the following regional activity details:
- Summary
- Displays the following information about user activity in the region:
- The total number of IP addresses on which a response or a request has been made.
- The number of unique IP addresses out of the total number of addresses.
- The mean, or average, number of IP addresses per unique IP address.
- Top locales
- Displays the top two locales that generate the most activity in the region. Locales are cities that are geographically close together and can be summarized in one region. For example, the window might display Mountain View, California and Oakland, California as the top locales for a region.
- Top users
- Displays the top six users that have generated the most activity in the region. Each user is identified by IP address, and the number of responses or requests generated by each IP address is displayed.
View alert details
A metric tracked on a geomap might be associated with one or more alerts. If the metric activity meets alert conditions, the appearance of the data point indicates the severity level. Alert severity levels are represented by the following colors on the geomap:
- Gray
- Indicates that no user-defined alerts are configured, or the alert settings are configured to issue a single alert when conditions are met even if the condition is ongoing.
- Green
- Indicates that no user-defined alerts are configured, or that an alert with a severity level of Debug and Informational was generated.
- Orange
- Indicates that at least one alert with a severity level of Notice or Warning was generated.
- Red with spinning edges
- Indicates that at least one alert with a severity level of Error or Critical was generated.
- Red with sonar beacons
- Indicates that at least one alert with a severity level of Emergency or Alert was generated.
For example, if an alert is configured to watch HTTP responses on a group of web servers so that any time the ratio of errors exceeds 5%, a critical-level notification is sent. If your geomap tracks HTTP responses on the same web servers, data points display as red with spinning edges in each region the alert condition is met.
The behavior of an alert affects the data points on the geomap. An alert can be configured to occur once when alert condition is met, resulting in a one-time data point on the map. Or, an alert can be configured to occur at regular intervals as long as the alert condition is met, resulting in a data point that reflects the continuous state.
Click a data point to view the following alert details:
- The IP addresses that have been generated an alert.
- The alert severity level associated with each IP address.
- The name of the alert associated with each IP address.
See Alerts for more information about configuring alerts and alert severity levels.
Navigate display controls
Each geomap displays the following information and controls:
- Display controls
- Settings that determine the look of the geomap and the time range of the data displayed.
- Activity graphs
- Graphs that display user activity in smaller data sets.
- Autopilot
- A feature that automatically navigates between the top eight regions with the most user activity.
- Updater
- A timer that counts down to the next refresh of the data on the geomap.
For more information about geomaps, see the Geomaps FAQ.
Thank you for your feedback. Can we contact you to ask follow up questions?