Monitor trigger performance
After you have built a trigger, check to ensure that it is running as expected, without errors or unnecessary consumption of resources. If your trigger script includes a debug statement, check the debug log for debug output. You can also check the debug log for errors and exceptions. You can view performance information for an individual trigger and you can view several system health charts that indicate the collective impact of all of your triggers on the system.
To learn about the steps you must complete to create a trigger, see Build a trigger.
Check trigger output in the debug log
After you create or edit a trigger, you can view the Debug Log tab to check that the trigger is running as expected, without issues. The debug log displays debug output, errors, and exceptions. This tab only appears after the trigger is saved.
Note that debug output starts logging as soon as the trigger is assigned and saved; however, the log cannot display data that occurred prior to when the trigger was assigned and saved.
The following steps show you how to access the debug log:
- Log in to the ExtraHop system through https://<extrahop-hostname-or-IP-address>.
-
Click the System Settings icon
 , and then click Triggers.
- Click the name of the trigger you want to view.
- Click Edit Trigger Script.
- Click the Debug Log tab.
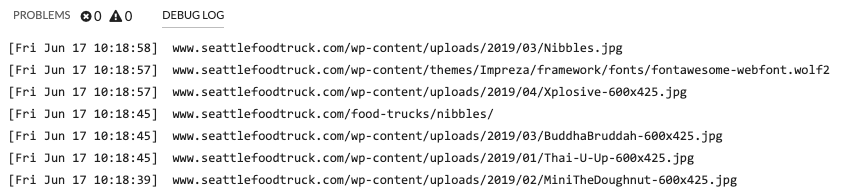
if (HTTP.uri.match("seattle")){
    Application("Seattle App").commit();
    debug(HTTP.uri);
}When a match occurs, the URI that contains the match is written to the debug log as shown in the following figure:
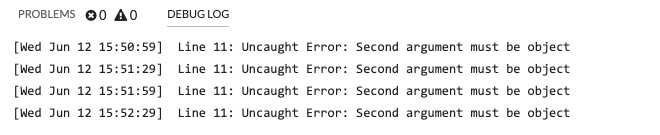
The debug log also displays any runtime errors or exceptions that occur, whether or not debugging is enabled on the Configuration tab. You should fix exceptions when they occur to minimize the performance impact on your system.
View the performance of an individual trigger
After you create or edit a trigger, you can view the Performance tab to view a graphical representation of the performance impact the trigger has on your environment. This tab only appears after the trigger is saved.
- Log in to the ExtraHop system through https://<extrahop-hostname-or-IP-address>.
-
Click the System Settings icon , and then click Triggers.
- Click the trigger you want to view.
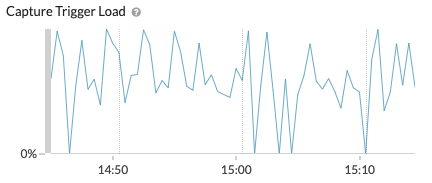
- In the Edit Trigger pane, scroll down to the Capture Trigger Load chart.
The tab displays a trigger performance graph that tracks the number of cycles the trigger has consumed within a given time interval.
Next steps
If the trigger impact is high, re-evaluate the purpose of the trigger and consider the following options:- Ensure the trigger performs only necessary tasks and runs only on required devices or networks.
- Check for exceptions in the chart below Capture Trigger Load visit the System Health page, which provides additional trigger performance metrics such as the number of running triggers, trigger load, and trigger exceptions.
- Assess the efficiency of the trigger script and look for trigger optimization tips in the Triggers Best Practices Guide.
View the performance of all triggers on the system
After you have built a trigger, view several System Health charts that indicate the collective impact of all of your triggers on the system. You can monitor these charts for problems that affect system performance or result in incorrect data.
The System Health page contains several charts that provide an at-a-glance view of the triggers running on the ExtraHop system.
-
Click the System Settings icon , and then click System
Health.
Thank you for your feedback. Can we contact you to ask follow up questions?