If you have an authentication server or database that should not connect to IP
addresses outside of your internal network, you can create a value chart in a dashboard that
tracks External Accepted and External Connected metrics. From your dashboard, you can then
monitor the number of external connections for a specific device.
| Tip: | By default, any device with an RFC1918 IP address (included in a 10/8,
172.16/12, or 192.168/16 CIDR block) that the ExtraHop system automatically
discovers is classified as an internal device. Because some network environments
include non-RFC1918 IP addresses as part of their internal network, you can specify the locality of an IP
address on the Network Localities page. |
The following steps show you how to create a value chart for these TCP metrics and
then add the chart to a dashboard.
-
Log in to the ExtraHop system through
https://<extrahop-hostname-or-IP-address>.
-
Click Assets at the top of the page.
-
Click Devices in the left pane.
-
Find a
device and then click the device name.
-
Click TCP in the left pane. In the Total Connections
chart in the upper left corner, the External Accepted and External Connected
metrics display how many IP addresses outside of your internal network are
connected to the device.
-
Click the Total Connections chart title.
-
From the drop-down menu, select Create chart from…. The
Metric Explorer opens with the device and TCP metrics already selected in the
chart.
-
At the bottom of the Metric Explorer, click the Value
chart.
-
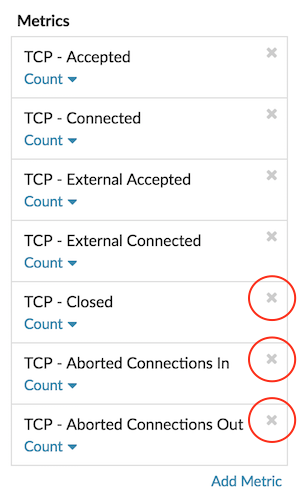
In the left pane in the Metric section, click the x icon
to delete each TCP metric that you do not want to view in the chart, as shown in
the following figure.

Your dashboard now contains metrics that help you
track the ratio of all accepted connections to external accepted connections,
and the ratio of all initiated connections to external initiated
connections.
- (Optional):
Make additional edits to the chart with the Metric Explorer.
-
Click Add to Dashboard and complete one of the following
options:
- Select the name of an existing dashboard from the list. The dashboard
list is ordered from the most recently created dashboards (at the bottom) to
the oldest dashboards (at the top).
- Select Create Dashboard. In the Dashboard Properties
window, type a name for the new dashboard and then click
Create.
- (Optional):
Make additional edits to the dashboard layout.
-
Click Exit Layout Mode. Your dashboard is complete.

Thank you for your feedback. Can we contact you to ask follow up questions?