Activity Maps FAQ
Here are some answers to frequently asked questions about reports.
- When should I create an activity map?
- What kind of devices can I see in an activity map?
- Do applications appear in a map?
- Why don't I see every device label in my map?
- Can I export my map?
- Can I view my map in 3D?
- What does the width of the line mean?
- Why are some circles larger than others?
- Why do some circles have an additional ring?
- How are devices grouped together on a map?
- Will map elements change color based on alert or troubleshooting status?
- Why does the map layout change while I'm viewing it?
When should I create an activity map?
With an activity map, you can view the connections between devices across your network in real-time or for a specific time interval. Instead of a static visualization of how your network is organized, an activity map provides a dynamic view of protocol activity on your network as it occurs. An activity map can help answer the following questions:
- Is a server that should be disconnected or decommissioned still sending or receiving traffic from other devices?
- Which services are interacting with my slow application server? Is one of these services sending an overwhelming volume of traffic that might be affecting application performance?
- Are databases or authentication servers making unauthorized connections with other devices?
What kind of devices can I see in an activity map?
Any device can appear in an activity map, except the following:
- Devices in Discovery Mode
- Custom devices that only contain VLAN criteria
- Devices without any protocol activity during the selected time interval
Do applications appear in a map?
You cannot view applications in an activity map. We recommend that you create a device group for the application you want to see in a map.
Why don't I see every device label in my map?
To optimize the amount of information you can view in a large map, the map does not display every device label by default. Zoom in or hover over circles and lines to view their labels.
What do the icons represent?
Icons represent the device role. A role, such as gateway or file server, is automatically assigned to a device based on the type of traffic the ExtraHop system observes for that device. You can change a device's role from its "Properties" view.
For more information about what each icon represents, see Labels and icons in Activity maps concepts.
Can I export my map?
Yes, you can export the entire map as a PNG, SVG, or PDF file. Click the command menu
![]() in the upper right corner to
access export options.
in the upper right corner to
access export options.
Can I view my map in 3D?
Yes. In the lower right corner of the activity map, click 3D. Maps displayed in the 3D layout automatically rotate until you zoom in on the map
What does the width of the line mean?
The width of the line corresponds to a metric, such as bytes, connections, or TCP turns. A wider line highlights which connections between devices are associated with more activity. By default, the width of the line corresponds to bytes, or volume of traffic.
Why are some circles larger than others?
The size of the circle corresponds to a metric, such as bytes, connections, or TCP turns. Larger circles highlight which devices are associated with more activity. By default, the size of the circle corresponds to bytes, or volume of traffic.
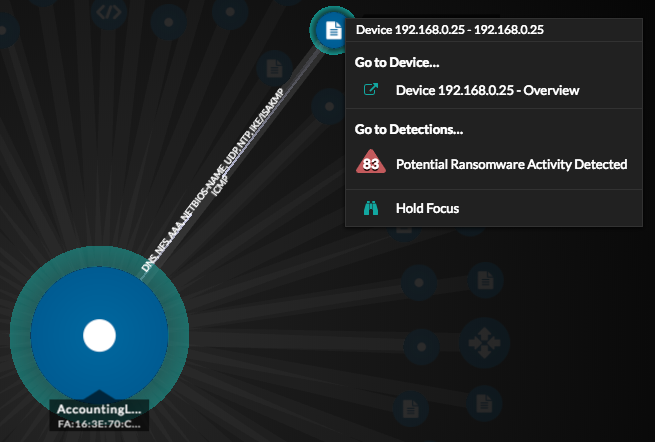
Why do some circles have an additional ring?
Devices on an activity map might display animated pulses, known as detection markers, around the circle label. Detection markers indicate that detections are associated with the device during the activity map time range.
| Note: | Machine learning detections require a connection to ExtraHop Cloud Services. |
Click a circle with a detection marker to view and navigate to associated detections, as shown in the following figure.
If detections markers are not displayed on your
activity maps as expected, detections markers might be disabled. You can enable or disable
detection markers from the User ![]() menu.
menu.
How are devices grouped together on a map?
Activity maps show you a dynamic view of real-time connections between devices. The placement of devices is determined by an algorithm that optimizes the map layout. Devices are not grouped together by relationship or network topology.
Will map elements change color based on alert or troubleshooting status?
If alerts are assigned to a device in a map, that device can change color to highlight the most severe status of those alerts. Click Display alert status to view alert status colors.
For more information see Alert status in Activity Map concepts.
Why does the map layout change while I'm viewing it?
When the time interval in the upper left corner of the page is set to an interval such as Last 30 minutes, Last 6 hours, or Last 1 day, activity map data will continuously update every minute with real-time data. To stop real-time layout updates, select a custom time interval with a specific start and end date.
Thank you for your feedback. Can we contact you to ask follow up questions?