Configure an open data stream to send metric data to AWS Cloudwatch
The ExtraHop system provides several tools for viewing and monitoring metrics about your network data. However, you might want to to store or analyze metric data with a remote, third-party tool, such as Splunk, MongoDB, or Amazon Web Services (AWS). The open data stream (ODS) feature enables you to configure a connection to a third-party tool through which you can send specified metric data.
In this walkthrough, you will configure an ODS target for Amazon CloudWatch, write a trigger that specifies which HTTP metrics to send, and initiate the transmission of data to the target.
Prerequisites
- You must have access to an ExtraHop system with a user account that has system and access administration privileges.
- Your ExtraHop system must have network data with web server traffic.
- You must have an Amazon Web Services account and familiarity with the CloudWatch service.
- Familiarize yourself with the concepts in this walkthrough by reading the Open Data Streams section in the ExtraHop Admin UI Guide and the Triggers topic.
- Familiarize yourself with the processes of creating triggers by completing the Trigger Walkthrough.
Configure an ODS target
In the following steps, you will configure the host, port, and authentication method for an HTTP open data stream target.
- Log in to the ExtraHop system that you want to send data from with an account that has system and access administration privileges.
- Click the System Settings icon, and then click All Administration.
- From the System Configuration section, click Open Data Streams.
- Click Add Target.
- Select HTTP from the Target Type drop-down menu.
- In the Name field, type CloudWatch.
- In the Host field, type the IP address or hostname of the Amazon web server you want to send data to.
- In the Port field, type 443 for the port number you want to send data through.
- In the Type field, select HTTPS as the transfer protocol you want to send data through.
- In the Authentication field, select Amazon AWS.
- In the Access Key ID field, type the access key for your AWS account.
- In the Secret Key field, type the secret key for your AWS account.
- In the Service field, type the entry point for the CloudWatch service, such as monitoring.
- In the Region field, type the region for the CloudWatch service, such as us-west-2.
- In the Method field, select POST as the REST method the trigger will call when sending data.
- Click Save.
Test the ODS configuration
In the following steps, you will write an HTTP REST request to test the transmission of data from the ExtraHop system to the AWS account.
As configured in the previous section, the test request applies the POST method.
-
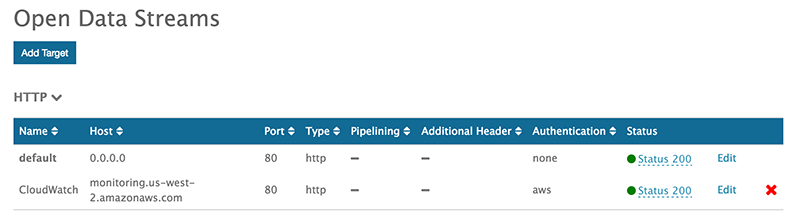
In the HTTP table, hover over the status of the target to
display connection activity.
If the test is successful, the window displays the number of messages and bytes sent and received and the number of connection attempts, similar to the following figure:

Write the ODS trigger
In the following steps, you will write a trigger that specifies which metrics to send to the CloudWatch service and contains the command to send metric data through the open data stream.
| Tip: | As you build the trigger in this procedure, add comments that describe the purpose of a code snippet, restrictions, or best practices. |
-
Click the System Settings icon
 , and then click
Triggers.
, and then click
Triggers.
Assign the ODS trigger to a device
Before the trigger can send metric data to the CloudWatch service, you must assign the trigger to at least one device. For this walkthrough, you will assign the trigger to a single HTTP server in a device group.
When creating your own triggers, assign triggers only to the specific devices that you need to collect metrics from to minimize the performance impact of your triggers on the ExtraHop system.
- Click Assets from the top menu.
- From the left pane, click Devices.
- From the table, select the checkbox for a single device that you know has web traffic.
- From the icon menu at the top of the page, click the Assign Trigger icon.
- Click the checkbox next to the Metrics to CloudWatch trigger, and then click Assign Triggers.
Verify data transmission to the ODS target
After the trigger has run, verify that data has been received by the ODS target, and then disable the trigger.
| Important: | Amazon Web Services is a tiered solution; there is no cost for the first tier unless usage is exceeded. Run this trigger for a short period of time to avoid exceeding the allowed amount of data. If you do not disable the trigger, and usage exceeds your allotted terms, you might incur additional costs. |
-
Click the System Settings icon , and then click
All Administration.
-
Click the System Settings icon , and then click
Triggers.
View results in AWS CloudWatch
After you have verified that metric data was sent to the ODS target, you can view the data with the CloudWatch service. In the following steps, you will find the metrics in CloudWatch and view the metric data on a graph.
-
Select the checkbox next to each metric to display metric data on the graph,
similar to the following figure:

Next steps
Now that you have successfully sent metric data from your ExtraHop system to AWS CloudWatch, try modifying the trigger to send additional metrics or create a new ODS target to send data to other third-party tools.
Thank you for your feedback. Can we contact you to ask follow up questions?