Track server errors with custom metrics and alerts
While the ExtraHop system offers over 5,000 built-in metrics, there are many situations in which it is more effective to track network issues with a custom metric. For example, while built-in metrics show you issues with HTTP responses and requests, a custom metric can identify 500-level server errors. These types of errors can indicate gateway issues, an overloaded server, or configuration issues.
In this walkthrough, you will learn how to write a trigger to collect custom metrics for server errors and how to create an alert that only sends an email notification when those specific errors occur. Then, you will be able to answer the following types of questions about server errors on your network:
- Are my customers receiving 500-level server errors?
- Which error codes occurred?
- When did the errors occur?
- What URI was the customer attempting to access?
- What is the IP address of the client and server affected in the transaction?
Prerequisites
- You must have a user account with system and access administration privileges.
- Your ExtraHop system must have network data with web server traffic.
- Your ExtraHop system must be configured to send email notifications before you can send alert emails.
- Familiarize yourself with the concepts in this walkthrough by reading Triggers and Alerts.
- Familiarize yourself with the processes of creating triggers by reading Build a trigger.
- It is helpful to have basic JavaScript knowledge.
Write a trigger to collect error data
First, let's create a trigger that monitors certain URIs for 500-level server errors. When errors occur, the trigger collects data such as error codes and server and client IP addresses and commits that data as custom metrics to an application.
-
Click the System Settings
 icon, and then click
Triggers.
icon, and then click
Triggers.
-
Click in the Events field and select
HTTP_RESPONSE from the list.
The following figure displays the trigger settings we configured above:

- HTTP Server Errors
- The trigger commits data collected from the custom metrics to this application.
- HTTP_error
- A custom count metric that collects the number of 500-level errors that occur.
- HTTP_error_allDetail
- A custom detail metric that collects the code number, URI, server IP and client IP on which each error occurred.
Assign the trigger to a device
Before the trigger can run, it must be assigned to at least one device. In this step, we will assign the trigger to one or more HTTP servers that support traffic over the URIs you specified in the trigger.
- Click Assetsfrom the top menu.
- From Devices by Protocol Activity, click HTTP Servers, and then click Devices from the left pane.
- From the device list, select the checkbox next to one or more devices that support traffic over the URIs.
- At the top of the page, click Assign Trigger to open a list of triggers.
- Select the trigger named 500-level Server Errors that we created in the previous section, and then click Assign Triggers.
Next steps
| Tip: | Assign triggers only to relevant devices to avoid unnecessary performance impact on the system. A good way to ensure that a trigger runs only on relevant devices is to create a device group and assign the trigger to that group. |
Configure an alert to track a custom metric
Next, let's configure alert settings that will issue an alert and send an email notification each time a 500-level error occurs on the URIs watched by the trigger.
- HTTP_error
- The custom count metric that collects the number of 500-level errors that occur. We will configure alert settings to track this metric and issue an alert each time an error occurs.
- HTTP_error_allDetail
- The custom detail metric that collects the code number, URI, server IP address, and client IP address on which each error occurred. We will configure alert settings to display these error details in alert emails.
Before you begin
Your ExtraHop system must be configured for email notifications.-
Click the System Settings icon and then click
Alerts.
Assign the alert configuration to a source
Similar to triggers, the system does not generate alerts until the alert configuration is assigned to at least one metric source. In this step, we will assign the alert configuration to the application named HTTP Server Errors that we created with the trigger script. The custom metrics we want the alert to track are committed to this application.
- Click Assets from the top menu.
- Click Applications, and then select the HTTP Server Errors checkbox.
- Click Assign Alert from the top of the page to open a list of alert configurations that are eligible for assignment.
- Select the 500-level Server Errors alert, and then click Assign Alerts.
Check Alerts page and view email notifications
Now that we've configured the alert and assigned it to a source, we can check if the alert has issued any entries.
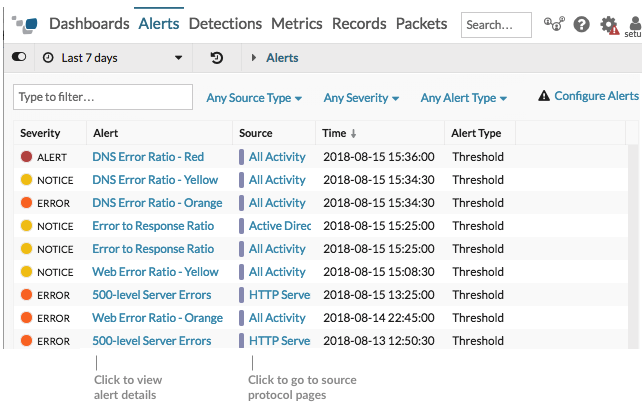
Click Alerts from the top menu to view the Alerts page and check for any alerts that were issued during the selected time interval, similar to the following figure:
When an alert is issued, a notification is sent to the specified email recipients The following email example shows that two HTTP error events occurred that met the conditions we set in the alert expression and provides additional information that helps us investigate the source of the errors:
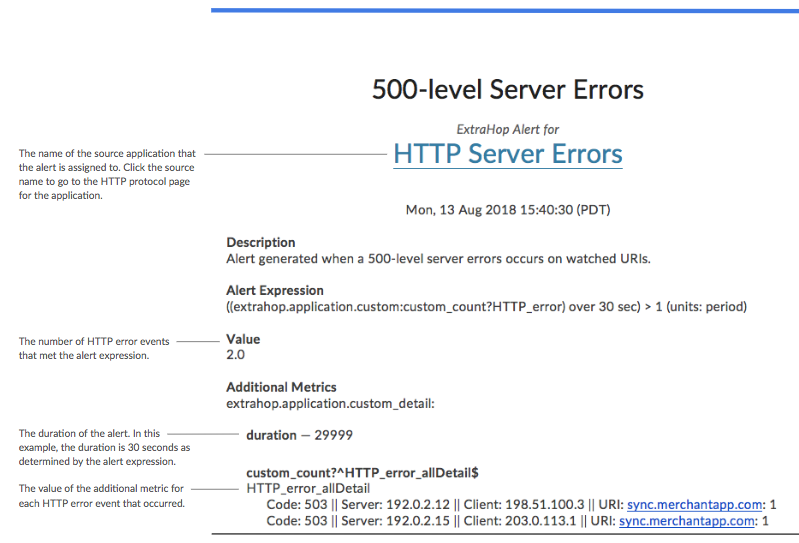
In our example, we see that there were two 503 errors returned for the same URI across two different server IP addresses. A 503 status code might indicate an overloaded server that requires more CPU or memory resources to handle requests. By knowing the affected IP addresses you can immediately investigate potential problems on the listed servers.
Next steps
- Create charts to monitor your custom metrics on a dashboard or protocol page.
- Configure a trend alert to only issue alerts when server errors trend instead of for each error occurrence.
- Add an exclusion interval to your alert to suppress alerts during times when errors are expected.
Thank you for your feedback. Can we contact you to ask follow up questions?