Integrate RevealX 360 with Google Security Operations SIEM

This integration enables Google Security Operation (SecOps) SIEM to export detection data from the ExtraHop system through detection notification rules. You can view exported data in the SIEM to gain insight into security threats in your environment and accelerate response times.

To configure this integration, you will provide information to establish a connection between your Google SecOps SIEM and the ExtraHop system, and you will create detection notification rules that will send webhook data to the SIEM. Integrating the ExtraHop system with Google SecOps SIEM is supported on both RevealX 360 and RevealX Enterprise.

After the connection is established and notification rules are configured, you can view Extrahop detection data from your Google SecOps SIEM in a dashboard and in alerts generated by rules that correlate to detection risk scores.

Before you begin

You must meet the following system requirements:

  1. Log in to RevealX 360.
  2. Click the System Settings icon and then click Integrations.
  3. Click the Google SecOps tile.
  4. In the API Key field, enter the API key you generated from the ExtraHop RevealX webhook feed
  5. In the Secret field, enter the secret key you generated from the ExtraHop RevealX webhook feed.
  6. Enter the following properties from the endpoint URL that you generated from the ExtraHop RevealX webhook feed. The endpoint URL format is similar to the following example:
    https://{region}-chronicle.googleapis.com/v1alpha/projects/{project}/
    locations/{location}/instances/{instance}/feeds/{feed}:importPushLogs
    1. In the Project ID field, enter the value of {project} from the endpoint URL.
    2. In the Instance UUID field, enter the value of {instance} from the endpoint URL.
    3. In the Feed UUID field, enter the value of {feed} from the endpoint URL.
    4. In the Region Code field, enter the value of {region} from the endpoint URL.
    5. In the Location Code field, enter the value of {location} from the endpoint URL.
  7. Select one of the following connection options:
    Option Description
    Direct Connection Select this option to configure a direct connection from this RevealX 360 console to the provided URL.
    Proxy through a connected sensor Select this option if your SIEM cannot support a direct connection from this RevealX 360 console due to firewalls or other security controls.
    1. From the drop-down menu, select a connected sensor to act as the proxy.
    2. (Optional): Select Connect through the global proxy server configured for the selected sensor to send data through the global proxy configured on the selected sensor.
  8. Click Send Test Payload to establish a connection between the ExtraHop system and the SIEM server and to send a test message to the server.
    A message is displayed that indicates whether the connection succeeded or failed. If the test fails, edit the configuration and test the connection again.
  9. (Optional): Select Skip server certificate verification to bypass verification of the SIEM server certificate.
  10. Click Save.

Create a detection notification rule for a SIEM integration

Before you begin

  • Your user account must have NDR module access to create security detection notification rules.
  • Your user account must have NPM module access to create performance detection notification rules.
  • You can also create detection notification rules from System Settings. For more information, see Create a detection notification rule.
  1. Log in to RevealX 360.
  2. Click the System Settings icon and then click Integrations.
  3. Click the tile for the SIEM that will be the target of the detection notification rule.
  4. Click Add Notification Rule.
    The Create Notification Rule window opens in a new tab and the following fields are set to default values.
    • The Name field is set to the name of the SIEM.
    • The Event Type field is set to Security Detection.
    • The Target field is set to the SIEM integration.
  5. In the Description field, add information about the notification rule.
  6. In the Criteria section, click Add Criteria to specify criteria that will generate a notification.
    • Recommended for Triage
    • Minimum Risk Score
    • Type
    • Category
    • MITRE Technique (NDR only)
    • Offender
    • Victim
    • Device Role
    • Participant
    • Site
    The criteria options match the filtering options on the Detections page.
  7. Under Payload Options, select if you want to send the default payload or type in a custom JSON payload.
    • Default payload

      Populate the webhook payload with a core set of detection fields.

      From the Add Payload Fields drop-down menu, you can click additional fields that you want to include in the payload.

    • Custom payload

      Populate the webhook payload with custom JSON.

      You can edit the suggested custom payload in the Edit Payload window.

  8. Click Send Test Payload.
    A message titled Test Notification will be sent to confirm the connection.
  9. In the Options section, the Enable notification rule checkbox is enabled by default. Deselect the checkbox to disable the notification rule.
  10. Click Save.

Next steps

  • Navigate back to the integration configuration page to check that your rule has been created and added to the table.

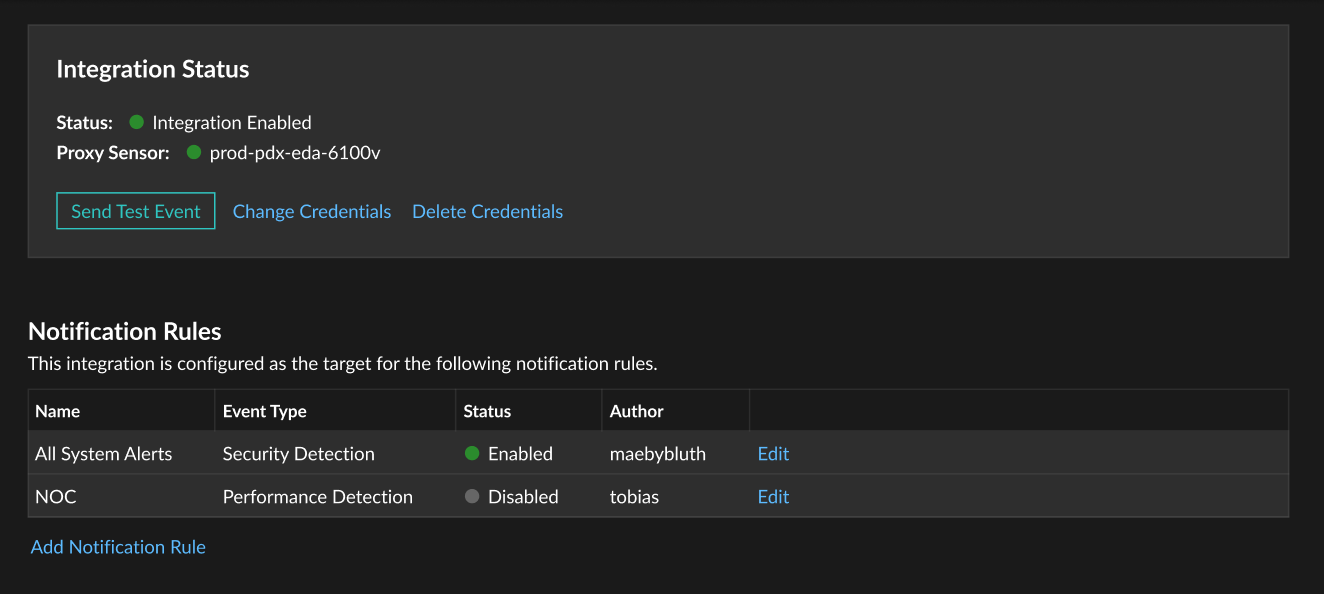
  • Click Edit to modify or delete a rule.

View ExtraHop detection data in Google Security Operations SIEM

ExtraHop provides access to a GitHub repository that contains files that you can import into Google SecOps SIEM to install a dashboard of ExtraHop detections and alert rules based on detection risk scores. After detection data is received by your Google SecOps SIEM, you can view the detections dashboard and the rules that will generate alerts from your SIEM.

Before you begin

You must import the dashboard and rule files from the ExtraHop GitHub repository to Google SecOps SIEM:
  1. Log into your Google Security Operations SIEM.
  2. Complete the following steps to view the detections dashboard:
    1. From the navigation panel, click Dashboards & Reports > Native Dashboards.
    2. From the dashboard list, click ExtraHop RevealX Dashboard.
    The dashboard displays the following charts:
    Chart Description
    Recommended Detection Events Displays the total number of recommended detections generated during the selected time period.
    Total Detection Events Displays the number of detections generated during the selected time period.
    Maximum Risk Score Displays the highest risk score associated with detections generated during the selected time period.
    Top Recommended Detection Events Displays the top 10 recommended detections generated during the selected time period and the number of times each detection occurred.
    Top Categories Displays the top 10 detection categories associated with detections generated during the selected time period and the percentage and number of detections for each category.
    Top MITRE Techniques Displays the top 10 MITRE techniques associated with detections generated during the selected time period and the number of detections for each technique.
    Top Sources Displays the top 10 source hosts associated with detections generated during the selected time period and the number of detections for each source.
    Top Destinations Displays the top 10 destination hosts associated with detections generated during the selected time period and the number of detections for each destination.
    Sources IP Map Displays the geolocations of source IP addresses associated with detections generated during the selected time period.
    Destination IP Map Displays the geolocations of destination IP addresses associated with detections generated during the selected time period.
    Recent Detection Events Displays the most recent detections generated during the selected time period and detection details such as risk score, category, and URL
  3. Complete the following steps to view alert rules:
    1. Click Detection from the menu icon.
    2. Click the Rules & Detections tab.
      The Rules Dashboard displays the following rules:
      • Low Severity generates an offense for detections recommended for triage with a risk score between 1 and 30.
      • Medium Severity generates an offense for detections recommended for triage with a risk score between 31 and 79.
      • High Severity generates an offense for detections recommended for triage with a risk score between 80 and 99.
    3. Hover over a rule and click the menu icon to the right to change rule settings.
Last modified 2025-06-11