Create a custom device to monitor remote office traffic
After deploying the ExtraHop system at your data center, insights about your network quickly emerge. As the ExtraHop system automatically discovers devices that communicate on your network, you can start to identify traffic bottlenecks or troubleshoot slow services. But how do you gather insights about important traffic for remote locations outside of your data center?
By creating a custom device, you can easily learn how remote locations consume services and applications. Custom devices collect metrics from network traffic based on criteria that you specify, such as an IP address subnet, a range of ports, or a virtual LAN (VLAN). With a custom device, you can monitor the following types of traffic:
- Remote location traffic, such as branch offices, stores, and clinics.
- Third-party business partner traffic, such as credit card processors and timekeepers.
- "The internet," where you can collect traffic from a range of known public IP addresses such as 8.0.0.0/7.
You can add a custom device to a dashboard chart as a metric source to easily monitor traffic on the device. A custom device can also be selected as a metric source for triggers and alerts.
A custom device only counts as a single device towards your licensed device limit, which is helpful for keeping device counts low. But it's important to note that custom devices affect system performance if they are not configured properly.
This walkthrough shows you how to create a custom device and monitor remote office traffic by completing the following steps:
- Create a custom device for a subnet of branch office devices.
- Create a dashboard to monitor bandwidth and latency of branch office traffic.
Prerequisites
You must have a user account with full system or full write privileges.
Here are some guidelines about configuring custom devices:
- Avoid creating multiple custom devices for the same IP addresses or ports. Overlapping custom devices might affect system performance.
- When you configure a custom device from a console, you must specify a sensor. The custom device is available only to the specified sensor.
Create a custom device
Let's start building a custom device for our Seattle branch office.
-
Click the System Settings icon
 in the top right corner of the page, and then click
Custom Devices.
in the top right corner of the page, and then click
Custom Devices.
-
In the Discovery ID field, type a unique identifier for
the device, such as a store or office number. In this example, you'll type
Store_09045 for the Discovery ID.
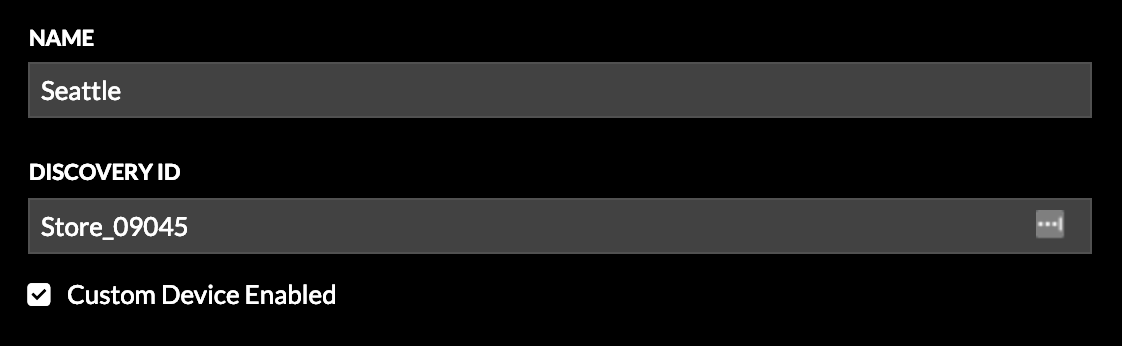
Tip: If left blank, the Discovery ID is generated from the custom device name. The Discovery ID cannot contain spaces and cannot be changed after the custom device is saved. -
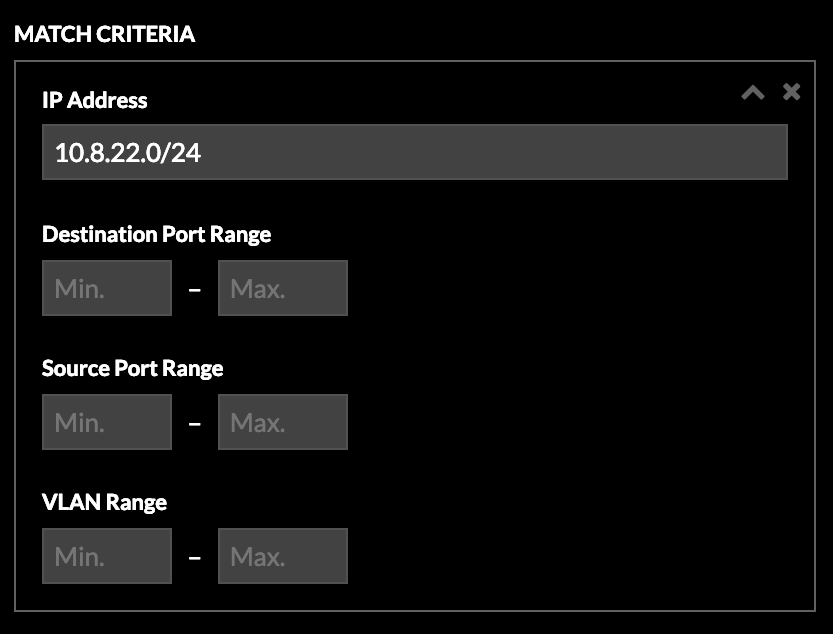
In the IP Address field, type a CIDR notation for the
Seattle branch office subnet. For this example, you will type
10.8.22.0/24. You can leave the port and VLAN fields
blank.
Your custom device is created! It will take a few minutes for the custom device to discover devices on the remote network. As the ExtraHop system observes traffic that meets the match criteria (for example, the 10.8.22.0/24 subnet), metrics will become available for this custom device.
Next, let's create a dashboard to easily monitor custom device metrics.
Create a dashboard
You can create a dashboard to display specific charts and data for the custom device you created.
- At the top of the page, click Dashboards.
-
Click the command menu
 in the upper right corner and select New
Dashboard to create an empty dashboard.
in the upper right corner and select New
Dashboard to create an empty dashboard.
- Type a name for your dashboard in the Title field. For this walkthrough, type Seattle Branch Office Traffic.
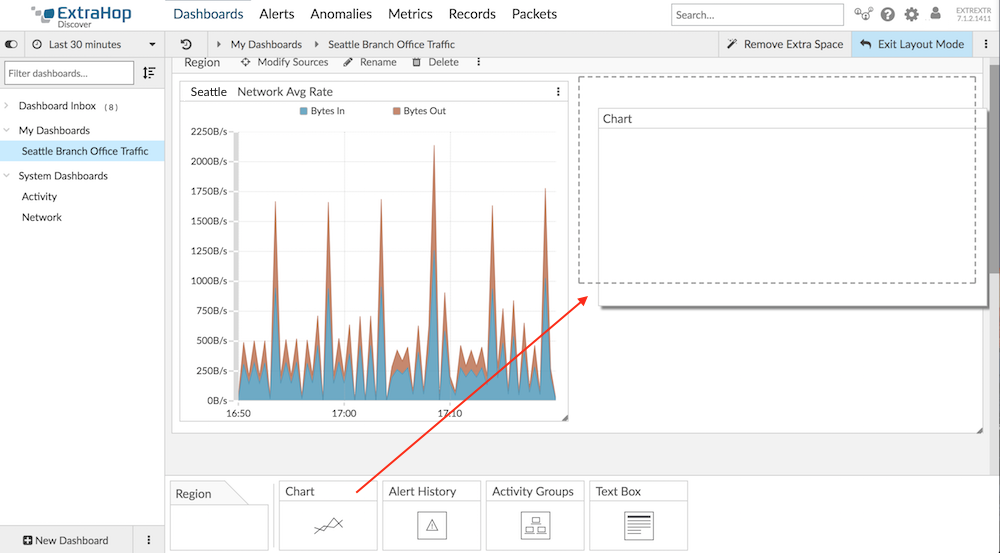
- Click Create. When you create a new dashboard, a workspace opens in an editable layout mode. This workspace contains a single region and two empty widgets: a chart and a text box.
-
Text box widgets can include custom explanatory text about a dashboard or
chart. For this walkthrough, however, you won't be adding text. Delete the text
box by completing the following steps:
-
Click the command menu in the upper right corner of the text box
widget and click Delete.
- Click Delete Widget.
-
Click the command menu
Add network throughput to your dashboard
Let's monitor the amount of network bytes coming into and out of the remote network.
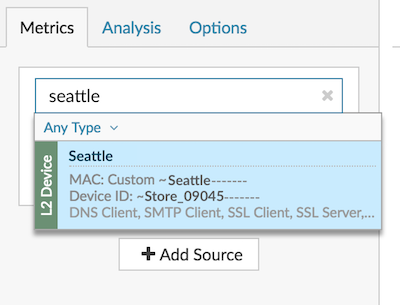
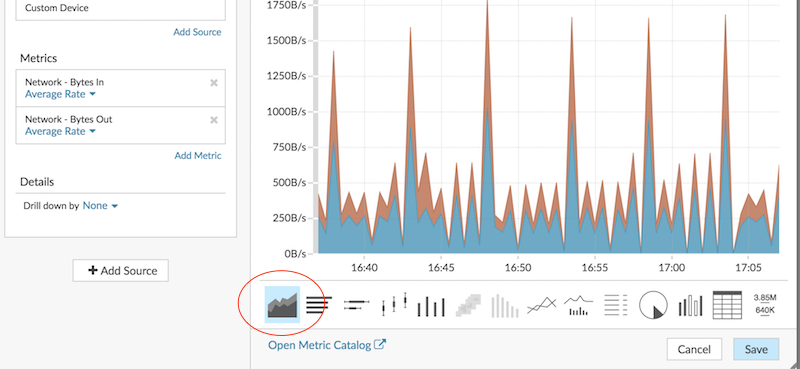
-
In the Sources field, type Seattle,
and then select that custom device from the results, as shown in the following
example.
-
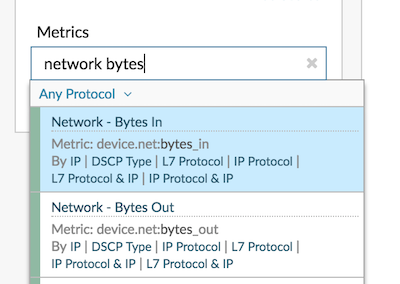
In the Metrics field, type network
bytes, and then select Network - Bytes In
from the results, as shown in the following example.
-
Click the Area chart.
Add network latency to your chart
Now let's now monitor whether network latency is affecting the remote network.
-
From the bottom of the Dashboards page, click and drag a chart widget into the
empty space next to the first chart, as shown in the following example.
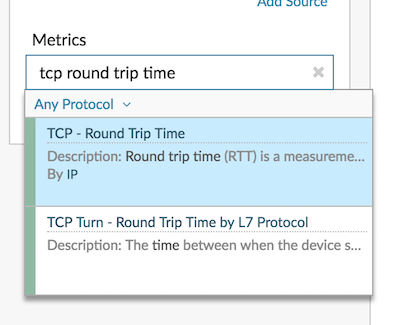
-
In the Metrics field, type tcp round trip
time, and then select TCP - Round Trip
Time from the results, as shown in the following example.
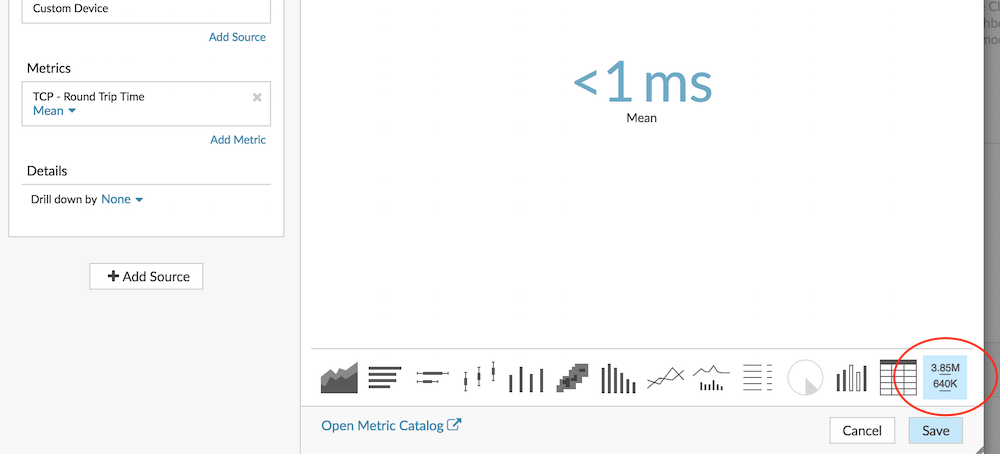
-
Click the Value chart.
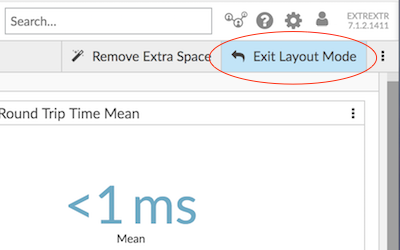
-
In the upper right corner of the page, click Exit Layout
Mode.
Troubleshoot issues
You now have a couple of charts to consult when slow network performance is reported. The following table includes suggestions for interpreting chart data and then troubleshooting issues.
| Potential Issue | Follow Up Action |
|---|---|
| A sudden increase in traffic | Investigate dashboard chart data to understand what is contributing to
traffic. You can also investigate protocol page data. Click the chart title and then click the custom device name in the Go to... section. A protocol page for the custom device appears. Create an activity map to see device connections and volume of traffic between connections. You can also compare two time intervals from different business hours to see the difference in metric values. |
| Slow application | Determine if the slow application is related to a client-side issue in the
branch office, or if the issue is related to servers in the local data
center. Click the chart title and then click the custom device name in the Go to... section. A protocol page for the custom device appears. In the Client Activity section in the left pane, click HTTP, Database, DNS, or ICA (Citrix) to investigate client-side Error metrics. In the Server Activity section, click protocols and investigate metrics such as Errors and Server Processing Time. These metrics show you that servers might be contributing to the issue. |
| Increase in traffic volume over time | Add a dynamic baseline to a chart to view trends in traffic data over time. Note that the ExtraHop system starts to build a dynamic baseline after it is added to the chart. You cannot view a baseline of historic data. |
| Increase in network congestion or other data transmission issues | Investigate TCP metrics to see how the network is affecting application
performance. Click the chart title and then click the custom device in the Go to… section of the drop-down menu. A protocol page for the custom device appears. Look for large values for the following metrics:
|
Thank you for your feedback. Can we contact you to ask follow up questions?