Dashboards
Dashboards are an effective tool for monitoring high-priority network traffic or troubleshooting issues because they consolidate multiple metric charts into a central location where you can investigate and share data. You can also add text boxes, formatted through Markdown, to provide content for stakeholders.
| Video: | See the related training: Dashboard Concepts |
Dashboards and collections are located in the dashboard dock.
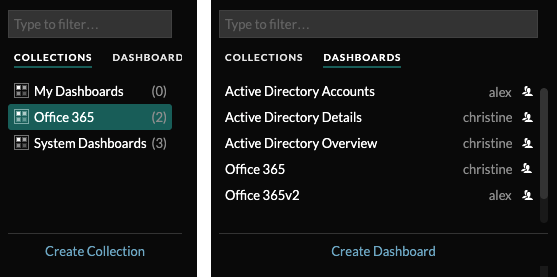
Click Collections to display all of the dashboard collections you own or that have been shared with you. The number of dashboards in each collection is displayed. Click the collection name to view the owner, who the collection is shared with, and the list of dashboards in the collection.
Only the collection owner can modify or delete a collection. However, because dashboards can be added to multiple collections, you can create a collection and share it with other users and groups.
Click Dashboards to display an alphabetized list of all of the dashboards that you own or that have been shared with you, including dashboards shared through a collection. The owner of each dashboard is displayed. An icon next to the owner name indicates that the dashboard was shared with you.
Creating dashboards
If you want to monitor specific metrics or custom metrics, you can create a custom dashboard. You must have personal write privileges or higher and NPM module access to create and edit dashboards.
Custom dashboards are stored separately for each user that accesses the ExtraHop system. After you build a custom dashboard, you can share it with other ExtraHop users.
There are several ways to create your own dashboard:
- Create a custom dashboard or create a dashboard with dynamic sources from scratch
- Copy an existing dashboard, and then customize it
- Copy an existing chart, and then save it to a new dashboard
New dashboards are opened in Edit Layout mode, which enables you to add, arrange, and delete components within the dashboard. After creating a dashboard, you can complete the following tasks:
Click the command menu ![]() in
the upper right corner of the page to edit the dashboard properties or delete the
dashboard.
in
the upper right corner of the page to edit the dashboard properties or delete the
dashboard.
| Note: | You cannot recover a deleted dashboard. When deleting user accounts, ExtraHop administrators can transfer dashboard ownership to another system user. Otherwise, all custom dashboards associated with the user account are also deleted. To preserve dashboards, make a copy before the account is deleted. |
Learn how to monitor your network by completing a dashboard walkthrough.
Viewing dashboards
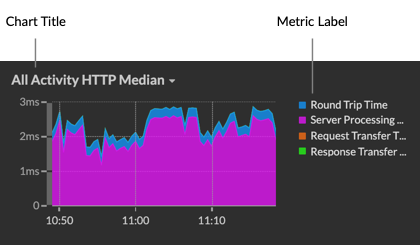
Dashboards are composed of chart widgets, alert widgets, and text box widgets that can present a concise view about critical systems or about systems managed by a particular team.
Click within a chart to interact with the metric data:
- Click a chart title to view a list of metric sources and menu options.
- Click a metric label to drill down and investigate by a metric detail.
- Click a metric label and click Hold Focus to display only that metric in the chart.
- Click a chart title or a metric label and then click Description to learn about the source metric.
- Click a detection marker to navigate to the detection detail page
Change the time selector to observe data changes over time:
Export and share dashboard data
By default, all custom dashboards are private and no other ExtraHop users can view or edit your dashboard.
Share your dashboard to grant view or edit permission to other ExtraHop users and groups, or share a collection to grant view-only permission to multiple dashboards.
You can only modify a shared dashboard if the owner granted you edit permission. However, you can copy and customize a shared dashboard without edit permission.
Export data by individual chart or by the entire dashboard:
- To export individual chart data, click the chart title and select one of the following options from the drop-down menu: Export to CSV or Export to Excel.
- To present or export the entire dashboard, click the command menu
 in the
upper right corner of the page and select one of the following
options: Presentation
Mode, Export to PDF or Scheduled
Reports (consoles only).
in the
upper right corner of the page and select one of the following
options: Presentation
Mode, Export to PDF or Scheduled
Reports (consoles only).
System dashboards
The ExtraHop system provides the following built-in dashboards that display common protocol activity about the general behavior and health of your network.
System dashboards are located in the default System Dashboards collection in the dashboard dock and they cannot be added to another collection that is shared with other users.
System dashboards can be viewed by any user except for restricted users The System Usage dashboard can only be viewed by users with System and Access Administration privileges.
- Network Activity dashboard (NPM module access required)
- Find top-talkers by application (L7) protocols and view recent alerts. For more information about charts in this dashboard, see Network Activity dashboard.
- Network Performance dashboard (NPM module access required)
- Identify traffic latency and bottlenecks over the data link (L2), network (L3), and transport (L4) layers. For more information about charts in this dashboard, see Network Performance dashboard.
- Security Hardening dashboard (NDR module access required)
- Monitor general information about potential security threats on your network. For more information about charts in this dashboard, see Security Hardening dashboard.
- Generative AI Tools dashboard
- Check for OpenAI traffic on your network and from internal endpoints communicating over OpenAI. For more information about charts in this dashboard, see Generative AI Tools dashboard.
- Active Directory dashboard
- Track Kerberos server activity for Active Directory user and computer accounts as well as services such as global catalog and group policies. For more information about charts in this dashboard, see Active Directory dashboard.
- System Health dashboard
- Ensure that your ExtraHop system is running as expected, troubleshoot issues, and assess areas that are affecting performance. For more information about charts in this dashboard, see System Health dashboard.
- System Usage dashboard (System and access administration privileges required)
- Monitor how users are interacting with detections, investigations, and dashboards in the ExtraHop system. For more information about charts in this dashboard, see System Usage dashboard.
Thank you for your feedback. Can we contact you to ask follow up questions?