Edit a chart with the Metric Explorer
The Metric Explorer is a tool for creating and editing charts, which lets you construct dynamic visualizations of device and network behavior.
| Video: | See the related training: Choosing a Metric |
Create and edit a basic chart
With the Metric Explorer, you can edit chart components, such as sources, metrics, and data calculations, and then preview how metric data appears in different chart types. When you are satisfied with your selections, save your chart to a dashboard.
The following steps show you the basic workflow and minimum requirements for completing a new chart.
-
Click Add Source and then select a source.
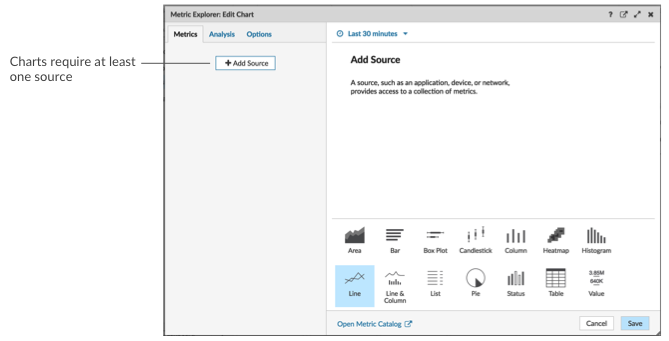
- You can select a static source for the chart by typing the name of an application, device, or network.
- You can also select a dynamic source that can be dynamically modified by dashboard viewers by typing $ and selecting a variable from the Source Type Variable list. For more information about source type variables and dashboard templates, see Create a dashboard with dynamic sources.
-
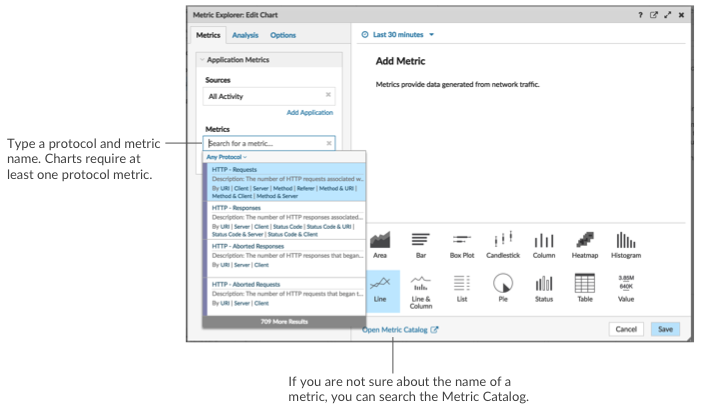
In the Metrics field, type a protocol and metric name. Then select the metric
from the list of results, as shown in the following figure.
-
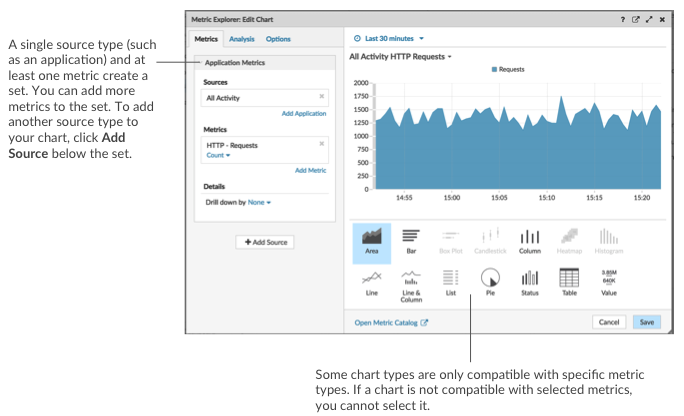
Select a chart from the bottom of the Metric Explorer, as shown in the
following figure.
Configure advanced options for data analysis and chart customization
Depending on the metrics and chart type you select, you can configure advanced options for creating sophisticated visualizations with the Metric Explorer, as shown in the following figure.
Drill down on metric data and sources to display details
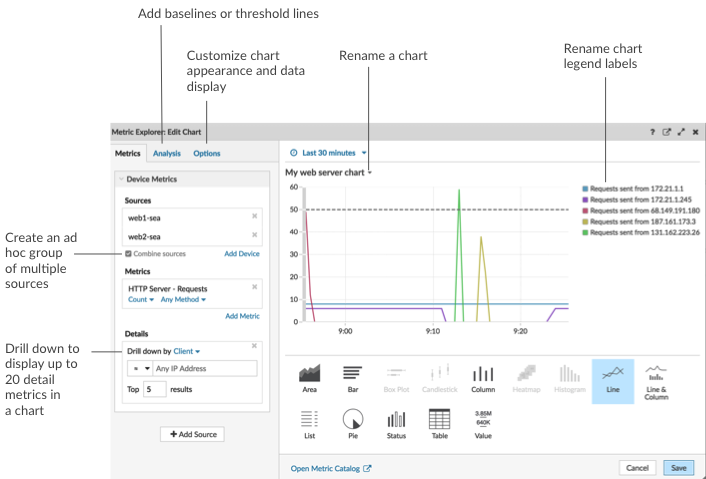
In the Details section from the Metrics tab, you can drill down to display detail metrics or drill down on a device group to display individual devices within the chart. You can also filter detail metrics for exact matches, or create a regex filter.Add a baseline or threshold line from the Analysis tab
You add a dynamic baseline or static threshold line to your chart. Baselines are calculated after the chart is saved. To see a line that represents a threshold, such as an service level agreement (SLA) value, add a static threshold line to your chart.Rename legend labels and the chart title
For charts that display a legend, you can change a metric name in the chart legend with a custom label. In the Metric Explorer, click the label in the preview pane then select Rename. To rename a chart, click the chart title and select Rename.Customize your chart from the Options tab
You can access the following options for customizing chart properties and the display of metric data in your chart:- Convert metric data from bytes to bits
- Convert metric data from base 2 (Ki=1024) to base 10 (K = 1000)
- Change the y-axis in a time-series chart from linear to log scale
- Abbreviate metric values in a chart (for example, abbreviate 16,130,542 bytes to 16.1 MB)
- Sort metric data in ascending or descending order in a bar, list, or value chart
- Change the percentile precision in a pie chart
- Hide or display a chart legend
- Hide inactive metrics with a zero value so that these metrics are not visible in the chart, including the legend and label
- Include sparkline in a list or value chart
- Show the alert status for data displayed in list or value charts (for more information, see Alerts)
- Switch the color display for metric data to grayscale (with exception to charts that display an alert status)
- For IP address labels, display the hostname (if detected from DNS traffic in wire data) or origin IP address (if a proxy is detected from wire data)
- Show the relative time for an expiration date, such as the number of days until an SSL certificate expires.
| Note: | Some options are only available for specific chart types. For example, the option to include a sparkline only appears in the Options tab for list and value charts. |
Create an ad hoc group to combine data from multiple sources
From the Metric tab, you can create an ad hoc group of multiple sources within a set by selecting Combine Sources. For example, you can combine two applications and then view a single metric value in the chart for both of these applications.Next steps
Practice building charts by completing the following walkthroughs:Regular expression filters
Filter your search results by writing regular expression (regex) strings in certain search fields throughout the ExtraHop system. For example, you can filter for parameters in a detail metric key, such as a number within an IP address. You can also filter by excluding specific keys or a combination of keys from charts.
- Search fields with an asterisk
- Click the asterisk to enable regex strings.
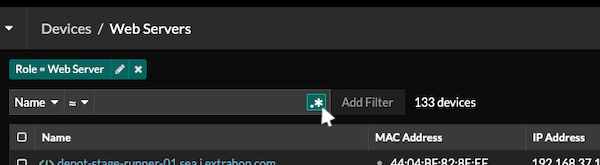
This type of field is available from the following system pages:- Filtering a table of devices
- Creating filter criteria for a dynamic device group
- Certain search fields with a trifield operator
- Click the operator drop-down to select the regex option.
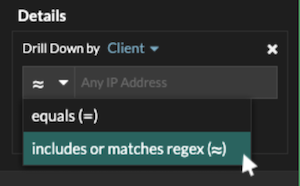
This type of field is available from the following system page:- Editing a chart in Metric Explorer
- Certain search fields with a tooltip
- Hover over the tooltip in the field to see when regex is required.
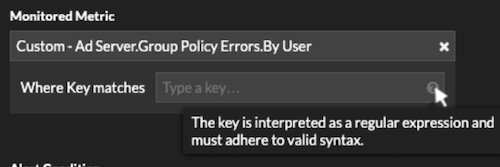
This type of field is available from the following system page:- Adding record relationships to a custom metric
The following table includes examples of standard regex syntax.
| Chart Scenario | Regex filter | How it works |
|---|---|---|
| Compare HTTP status codes 200 to 404. | (200|404) | The vertical bar symbol ( | ) is the OR operator. This filter matches 200, or 404, or both status codes. |
| Display any HTTP status code that contains a 4. | [41] | Square brackets ( [ and ] ) designate a range of characters. The filter searches for every character inside the brackets, regardless of order. This filter matches any value that contains a 4 or a 1. For example, this filter can return 204, 400, 101, or 201 status codes. |
| Display all 500-level HTTP status codes. | ^[5] | The caret symbol ( ^ ) outside square brackets ( [ and ] ) means "starts with." This filter matches any value that begins with a 5. For example, this filter can return 500 and 502 status codes. |
| Display all 400 and 500-level HTTP status codes. | ^[45] | Multiple values inside square brackets ( [ and ] ) are searched individually, even when preceded by the caret symbol ( ^ ). This filter does not search for values that begin with 45, but matches all values that begin with a 4 or 5. For example, this filter can return 400, 403, and 500 status codes. |
| Display any HTTP status codes except 200-level status codes. | ^(?!2) | A question mark ( ? ) and exclamation point ( ! ) inside parentheses specify a value to exclude. This filter matches all values except values beginning with a 2. For example, this filter can return 400, 500, and 302 status codes. |
| Display any IP address with a 187. | 187. | Matches 1, 8, and 7 characters in the IP address. This filter will not return IP addresses that end in 187 because the trailing period designates that something must come after the values. If you want to search the period as a literal value, you must precede it with a backslash ( \ ). |
| Review all IP addresses containing 187.18. | 187\.18. | Matches 187.18 and anything that follows. The first period is treated literally because it is preceded by a backslash ( \ ). The second period is treated as a wildcard. For example, this filter returns results for 187.18.0.0, 180.187.0.0, or 187.180.0.0/16. This filter does not return an address that ends with 187.18, because the wildcard requires that characters follow the specified values. |
| Display any IP address except 187.18.197.150. | ^(?!187\.18\.197\.150) | Matches anything except 187.18.197.150, where ^(?!) specifies the value to exclude. |
| Exclude a list of specific IP addresses. | ^(?!187\.18\.197\.15[012]) | Matches anything except 187.18.197.150, 187.18.197.151, and 187.18.197.152, where ^(?!) specifies the value to exclude and the square brackets ( [ and ] ) specify multiple values. |
Additional filters
When you create a custom detail metric from the Metric Catalog, you can add advanced regex syntax to the Additional Filters search field in the Record Relationships section.
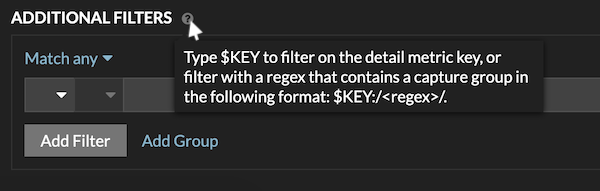
The regex syntax in this field must meet the following requirements:
- If your key contains multiple values, your regex syntax must include a
single capture group. A capture group is designated by parenthesis. Your
capture group determines the filter value.
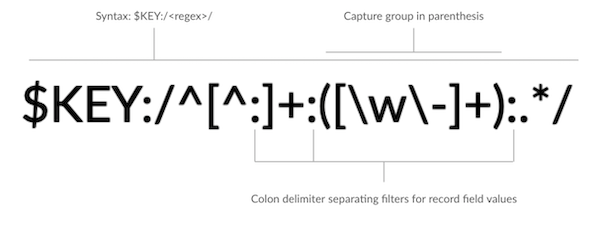
- If you want to return a specific value from a detail metric key that
contains multiple record field values, the regex must follow this syntax:
$KEY:/<regex>/
For example, if your detail metric key is ipaddr:host:cipher and you only want to return the IP address value, you would type the following:
$KEY:/^([^:]+):.+/
- If your key contains multiple record field values, the values are separated by a delimiter that is specified in the trigger that is generating the key. The placement of the delimiters in your regex syntax must match the delimiters in the detail key. For example, if you have a key with three values that are separated by a delimiter that is a colon, the three values for the key in your regex syntax must be separated by two colons.
| Tip: | If you want to return all record field values in a detail metric key, type $KEY. For example, if your detail metric key is ipaddr:host:cipher, type $KEY in the search field to return all three of those field record values (IP address, hostname, and SSL cipher suite). |
Thank you for your feedback. Can we contact you to ask follow up questions?