Investigate security detections
When an interesting detection appears, you should investigate whether the detected behavior points to a low-priority issue or a potential security risk. You can start your investigation directly from the detection card, which provides links to data across the ExtraHop system.
- Did any detections occur at unusual or unexpected times, such as user-activity on weekends or after hours?
- Are any detections appearing in large clusters on the timeline?
- Are there detections appearing for high-value endpoints?
- Are there detections that have high risk scores?
- Are devices in the detection also participants in other detections?
- Are indicators of compromise identified from a threat collection associated with the detection?
Refine your investigation
Detection detail cards present related data about the detection. The availability of the data depends on the devices and metrics associated with the detection. After you click a link, you can return to the detection card by clicking the detection name in the navigation path. Each investigation option is described in the sections below.
Review investigative data
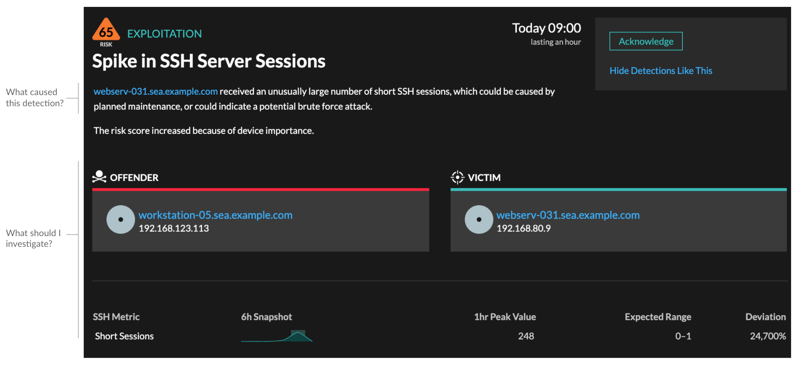
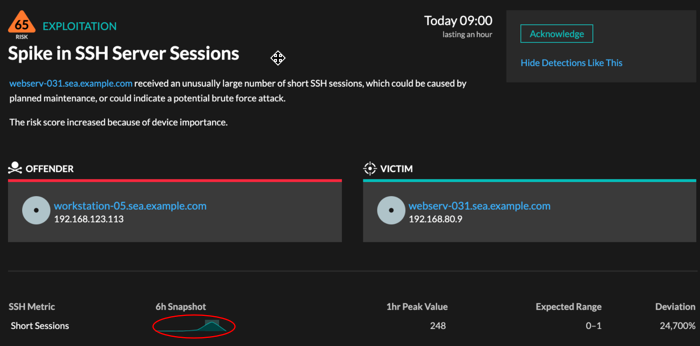
Most of the data that you need to understand, validate, and investigate a detection is displayed on the detection detail page: tables of relevant metric data, record transactions, and links to raw packets.
Click a host name to navigate to the Device Overview page, or right-click to create a chart with that device as the source and the relevant metrics.
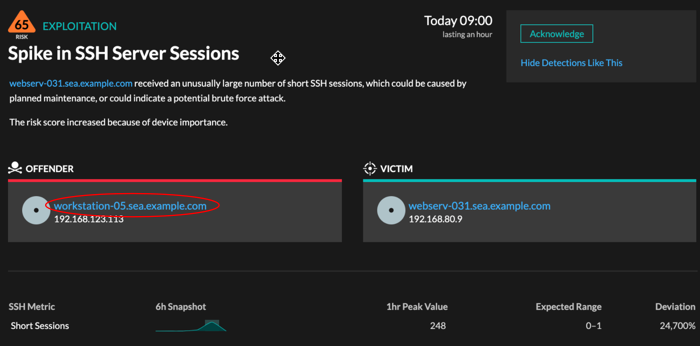
Device name
Click a device name to navigate to the Device Overview page, which contains the role, users, and tags associated with that device. From the left pane, click a protocol name to view all of the protocol metrics associated with the device. The protocol page gives you a complete picture of what this device was doing at the time of the detection.
For example, if you get a reconnaissance scan detection, you can learn if the device associated with the scan is assigned the Vulnerability Scanner role.
- Availability
- Device name links are only available for devices that have been automatically discovered by the ExtraHop system. Remote devices that are located outside of your network are represented by their IP addresses.
Activity map
Click the Activity Map icon ![]() next to a device name to see device connections by protocol during the time of the
detection. For example, if you get a lateral movement detection, you can learn if the
suspicious device established connections over a remote control protocol with other clients,
IT servers, or domain controllers on your network.
next to a device name to see device connections by protocol during the time of the
detection. For example, if you get a lateral movement detection, you can learn if the
suspicious device established connections over a remote control protocol with other clients,
IT servers, or domain controllers on your network.
- Availability
- An activity map is available when a single client or server is associated with unusual L7 protocol activity, such as a high number of HTTP errors or DNS request timeouts.
Detail metric drill down
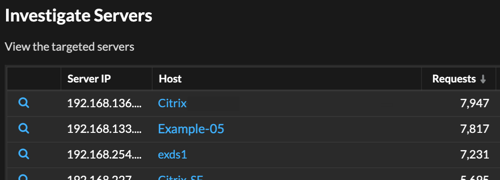
Click a detail metric link to drill down on a metric value. A detail metric page appears, which lists metric values by a key, such as client IP address, server IP address, method, or error. For example, if you get a reconnaissance scan detection, drill down to learn which client IP addresses were associated with the unusually high number of 404 status codes during the detection.
- Availability
- The drill-down option is available for detections associated with topnset detail metrics.
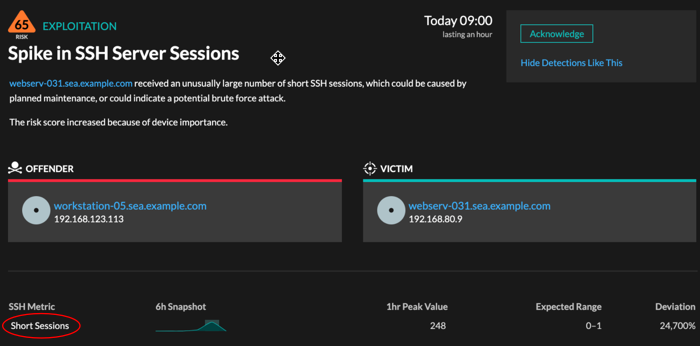
Sparkline
Click the sparkline to create a chart that includes the source, time interval, and drill-down details from the detection, which you can then add to a dashboard for monitoring. For example, if you get a detection about an unusual number of remote sessions, create a chart with SSH sessions for that server and then add that chart to a dashboard about session management.
- Availability
- The sparkline option is available for detections that were associated with metrics and had a duration over one-hour. For 1-second metrics, a sparkline is available when the duration was over 30-seconds.
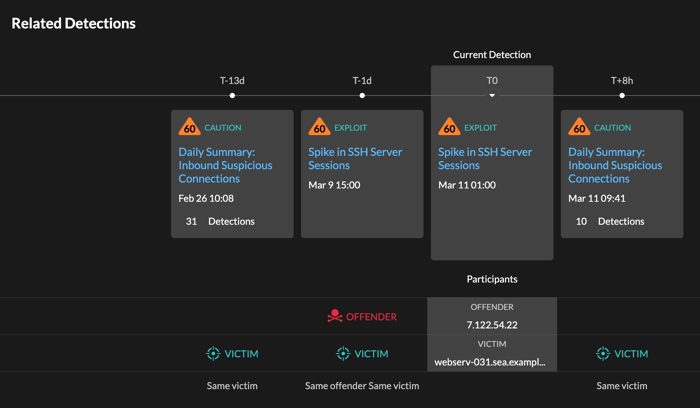
Related detections
Click a related detections to find insight about suspicious behavior and emerging attacks across multiple detections with shared participants. For example, a victim in the current detection that participates as an offender in a later detection might indicate that the device is compromised. You can view related detection details to determine if the detection events are similar and to see which other devices are involved.
- Availability
- The related detections timeline is available if there are detections that share the same victim or offender participants with the current detection. Related detections might have occurred before or after the current detection.
Threat Intelligence
Click a red camera icon  to
access detailed threat intelligence about an indicator of compromise.
to
access detailed threat intelligence about an indicator of compromise.
Threat intelligence provides known data about suspicious IP addresses, hostnames, and URIs that can help identify risks to your organization. These data sets, called threat collections, are available by default in your Reveal(x) system and from free and commercial sources in the security community.
- Availability
- Threat intelligence must be enabled on your Reveal(x) system before you can see these indicators.
Thank you for your feedback. Can we contact you to ask follow up questions?