Time intervals
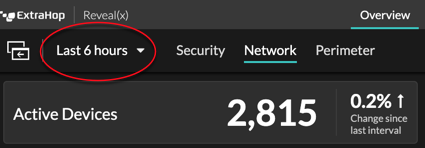
The Time Selector is displayed in the top-left corner of the navigation bar and controls the global time interval for metrics and detections displayed in the ExtraHop system.
Here are some considerations about time intervals:
- The Time Selector enables you to select a relative global time interval, such as the last day, or set a custom time range.
- The Time Selector enables you to manually change your displayed time zone.
- The selected time interval stays the same, whether viewing metrics in a dashboard or investigating detections, until you change the interval or navigate to a page with a preset time interval, such as detection details or threat briefings.
- If a relative time interval is selected when you log out, the ExtraHop system defaults to that relative time interval when you log back in.
- If a custom time range is selected when you log out, the ExtraHop system defaults to the last relative time interval you viewed during the previous login session.
- You can access the five most recent unique time intervals from the History tab of the Time Selector.
- The time interval is included at the end of the URL in your browser. To share a link with others that maintains a specific time interval, copy the entire URL. To maintain a specific time interval after logging out of the ExtraHop system, bookmark the URL.
Change the time interval
- Click the time interval in the upper left corner of the page (for example Last 30 minutes).
-
Select from the following interval options:
- A preset time interval (such as Last 30 minutes, Last 6 hours, Last day, or Last week).
- A custom unit of time.
- A custom time range. Click a day to specify the start date for the range. One click will specify a single day. Clicking another day will specify the end date for the range.
- Compare metric deltas from two different time intervals.
- Click Save.
| Tip: | You can also set the time interval from the History tab by selecting from up to five recent time intervals set in a previous login session. |
Change the displayed time zone
The Time Selector enables you to change the time zone displayed in the the ExtraHop system, providing more flexibility when viewing time-based data such as metrics, detections, and records in environments that span multiple time zones.
Here are some considerations about displaying time settings in Reveal(x) 360:
- Changing your displayed time zone affects the date and time stamps you see in the ExtraHop system, but does not apply to scheduled dashboard reports or exported dashboards.
- Changing your time zone overrides the default display time configured in the Administration settings. See System Time (for ExtraHop Performance and Reveal(x) Enterprise) or Configure the system time (for Reveal(x) 360) for more information.
- Log in to the ExtraHop system through https://<extrahop-hostname-or-IP-address>.
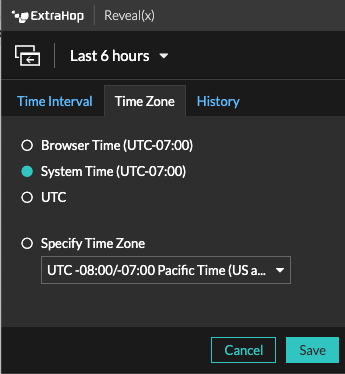
- Click the Time Selector in the upper left corner of the page.
- Click Time Zone.
-
Select one of the following options:
- Browser Time
- System Time
- UTC
- Specify Time Zone and then select a time zone from the drop-down list.
- Click Save.
View the latest data for a time interval
Pages that display monitored metric data, such as dashboards and protocol pages, are continuously updated to display the latest data for the selected time interval.
Detail metrics pages, detections, records, packets, and alerts are reloaded on request by
clicking the refresh data icon at the top left corner of the page. 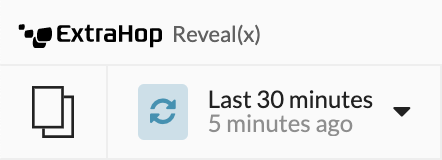
Change chart data granularity
The ExtraHop system stores metrics in 30-second buckets of time. Metric data are then aggregated or rolled up into additional five-minute and one-hour buckets. Aggregating data helps to limit the number of data points rendered on a time-series chart so the granularity of data is easier to interpret. The time interval you select determines the best aggregation, or roll up, of data to display in a chart for the period of time you are viewing.
For example, if you select a large time interval, such as one week, metric data is aggregated into one-hour roll ups. On the x-axis of a line chart, you see a data point for every hour instead of a data point for every 30 seconds. If you want to increase the level of granularity, you can zoom in on a chart or change the time interval.
The ExtraHop system includes built-in high-precision metrics with 1-second roll ups, which are the Network Bytes and Network Packets metrics. These metrics are associated with a device or network capture source. For more information on how to view these metrics in a chart, see Display the maximum rate in a chart.
The ExtraHop system also includes built-in metrics for identifying the single busiest millisecond of traffic within a 1-second roll up. These metrics, which are Maximum Network Bytes per Millisecond and Maximum Packets per Millisecond, are associated with a network capture source and help you detect microbursts. Microbursts are rapid bursts of traffic that occur within milliseconds.
The following table provides information about how data is aggregated based on time interval.
| Time Interval | Aggregation Roll Up (if available) | Notes |
|---|---|---|
| Less than six minutes | 1-second | A 1-second roll up is only available for custom metrics and for the following
built-in metrics:
|
| 120 minutes or less | 30-second | If a 30-second roll up is not available, a 5-minute or 60-minute roll up displays. |
| Between 121 minutes and 24 hours | 5-minute | If 5-minute roll up is not available, a 60-minute roll up displays. |
| Greater than 24 hours | 60-minute | – |
| Note: | If you have an extended datastore that is configured for 24-hour metrics, a specified time interval of 30 days or longer displays a 24-hour aggregation roll up. |
Thank you for your feedback. Can we contact you to ask follow up questions?