Investigate performance detections
When an interesting detection appears, you should investigate whether the detected behavior points to a low-priority issue or to a potential problem. You can start your investigation directly from the detection card, which provides links to data across the ExtraHop system.
- Did any detections occur at unusual or unexpected times, such as user-activity on weekends or after hours?
- Are any detections appearing in large clusters on the timeline?
- Are there detections appearing for high-value endpoints?
- Are devices in the detection also participants in other detections?
Refine your investigation
Detection detail cards present related data about the detection. The availability of the data depends on the devices and metrics associated with the detection. After you click a link, you can return to the detection card by clicking the detection name in the navigation path. Each investigation option is described in the sections below.
Review investigative data
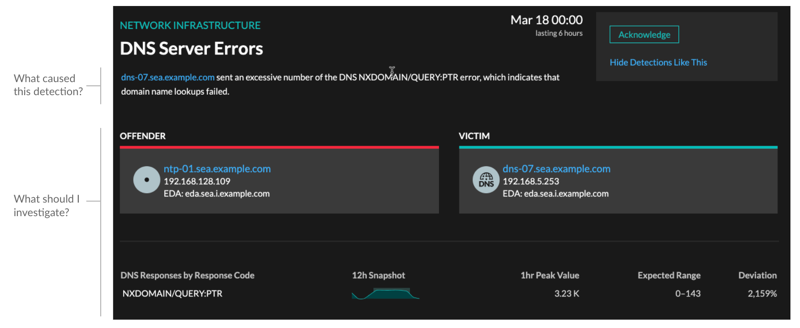
Most of the data that you need to understand, validate, and investigate a detection is displayed on the detection detail page: tables of relevant metric data, record transactions, and links to raw packets.
Click a host name to navigate to the Device Overview page, or right-click to create a chart with that device as the source and the relevant metrics.
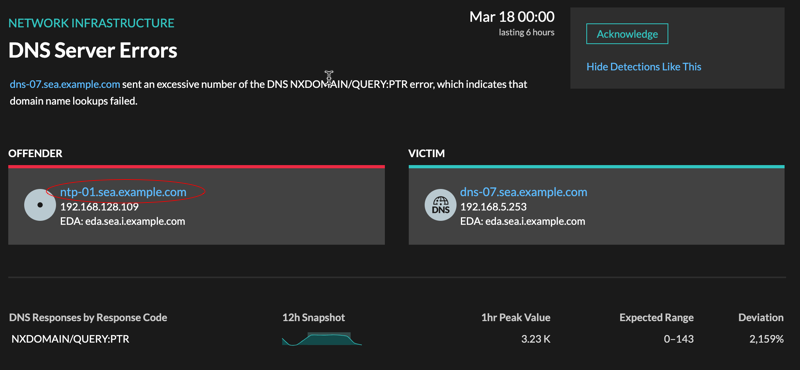
Device name
Click a device name to navigate to the Device Overview page, which contains the role, users, and tags associated with that device. From the left pane, click a protocol name to view all of the protocol metrics associated with the device. The protocol page gives you a complete picture of what this device was doing at the time of the detection.
For example, if you get a detection about database transaction failures, you can learn about other activity associated with the server hosting the database instance.
- Availability
- Device name links are only available for devices that have been automatically discovered by the ExtraHop system. Remote devices that are located outside of your network are represented by their IP addresses.
Activity map
Click the Activity Map icon ![]() next to a device name to see device connections by protocol during the time of the
detection. For example, if you get a detection about LDAP authentication errors, you can
create an activity map to learn which devices were connected to an LDAP server during the
detection.
next to a device name to see device connections by protocol during the time of the
detection. For example, if you get a detection about LDAP authentication errors, you can
create an activity map to learn which devices were connected to an LDAP server during the
detection.
- Availability
- An activity map is available when a single client or server is associated with unusual L7 protocol activity, such as a high number of HTTP errors or DNS request timeouts.
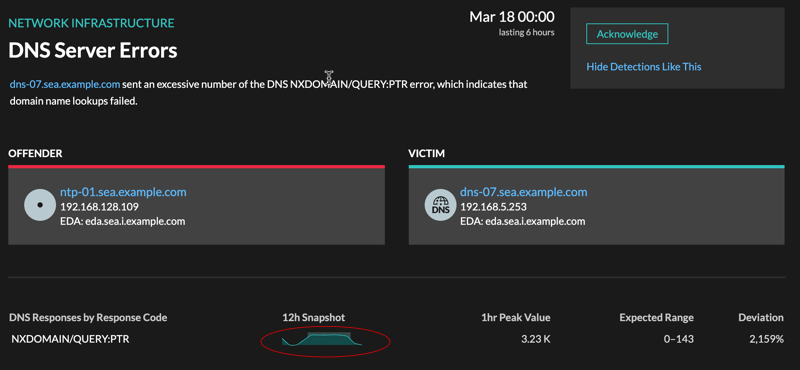
Detail metric drill down
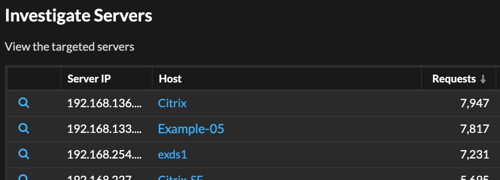
Click a detail metric link to drill down on a metric value. A detail metric page appears, which lists metric values by a key, such as client IP address, server IP address, method, or error. For example, if you get an authentication detection about an LDAP server, drill down to learn which client IP addresses submitted the invalid credentials that contributed to the total number of LDAP errors.
- Availability
- The drill-down option is available for detections associated with topnset detail metrics.
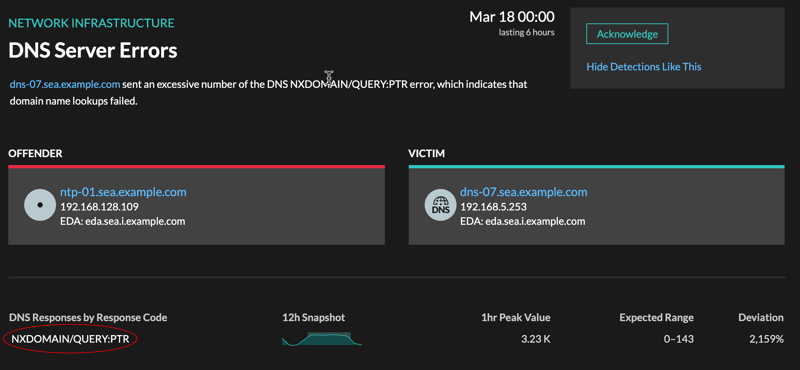
Sparkline
Click the sparkline to create a chart that includes the source, time interval, and drill-down details from the detection, which you can then add to a dashboard for additional monitoring. For example, if you get a detection about web server issues, you can create a chart with the 500 status codes sent by the web server and then add that chart to a dashboard about website performance.
- Availability
- The sparkline option is available for detections that were associated with metrics.
Related detections
Click a related detection to find insight about network, application, and infrastructure problems across multiple detections with shared participants. For example, a device identified as an offender is the likely source of an issue, such as a database server sending an excessive number of response errors. A device identified as a victim is usually negatively affected by the issue, such as clients experiencing slow or failed database transactions. You can view related detection details to determine if the detection events are similar, see which other devices are involved, and to view metric data.
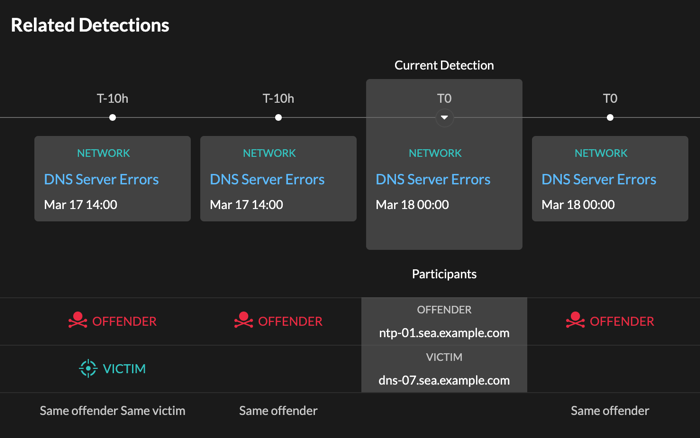
- Availability
- The related detections timeline is available if there are detections that share the same victim or offender participants with the current detection. Related detections might have occurred before or after the current detection.
Thank you for your feedback. Can we contact you to ask follow up questions?