- All ExtraHop systems
- Network Performance Monitoring (NPM) module
Thank you! We will contact you soon to ask how we can improve our documentation. We appreciate your feedback.
How can we improve?
Configure a trend alert
Configure a trend alert to monitor when a specific metric deviates from normal trends. Trend alerts are useful for monitoring metric trends such as unusually high round-trip times or storage servers experiencing abnormally low traffic, which might indicate a failed backup. For example, you can configure a trend alert that generates alerts when a spike (75th percentile) in HTTP web server processing time lasts longer than 10 minutes, and where the metric value of the processing time is 100% higher than the trend.
Before you begin
You must have full write privileges or higher.- Log in to the ExtraHop system through https://<extrahop-hostname-or-IP-address>.
-
Click the System Settings icon
 and then click Alerts.
- Click Create.
- Type a unique name for the alert configuration in the Name field.
-
In the Description field, add information about the
alert.
Tip: Alert descriptions support Markdown, which is a simple formatting syntax that converts plain text into HTML. For more information, see the Alerts FAQ. - In the Alert Type section, click Trend Alert.
-
In the Assigned Sources field, type the name of a
device, device group, or application and then select from the search
results.
To search for a site, flow network, or flow interface, select that source type from the drop-down menu at the top of the search results.
- (Optional):
Click Add Source to assign the alert to multiple
sources. Multiple sources must be of the same type, such as only devices and
device groups or only applications.
Tip: Assign an alert to a device group to efficiently manage assignments to multiple devices. -
In the Monitored Metric field, type the name of a metric
and then select from the search results.
The metric must be compatible with the assigned sources. For example, if you assign the alert to an application, you cannot select a device metric.
If you select a dataset metric such as HTTP Server Processing Time, you must specify one of the following data aggregation methods:
Merge Aggregate all the metric dataset values and apply the trend weighting model to one superset of data. For example, a 30-second aggregated rollup, or metric cycle, contains a single dataset for each 30-second interval. Therefore, a 30-minute interval has 60 datasets.
Mean Aggregate the mean of each metric dataset. Percentile Aggregate the percentile of each metric dataset based on the value you specify for Percentile. Absolute Standard Deviation Aggregate the metric dataset to its standard deviation as a constant. Relative Standard Deviation Aggregate the metric dataset to its standard deviation relative to the mean. - (Optional):
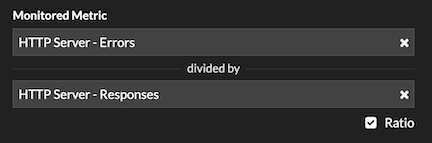
To monitor the value of a metric divided by a secondary metric, click
Ratio and then select a secondary metric.
For example, divide HTTP response errors by HTTP responses to monitor trends in the percentage of HTTP errors.
-
In the Trend Definition section, specify how the trend is calculated:
-
From the Trend Weighting Model drop-down list, select a model. The
weighting model aggregates historical metric values to calculate a
trend.
Mean Calculate a trend by averaging all metric values, weighted equally. Minimum Value Calculate a trend from the lowest value metrics. Median Value Calculate a trend from the median historical metric values. Maximum Value Calculate a trend from the highest value metrics. Percentile Calculate a trend from the percentile of each metric based on the value you specify for Percentile Value. Absolute Standard Deviation Calculate a trend by comparing the standard deviation as a constant value to the current trend. From the Deviation Type drop-down list, select a type:
- Sample-based
- Population-based
Relative Standard Deviation Calculate a trend by comparing the standard deviation as a value relative to the mean of the current trend. From the Deviation Type drop-down list, select a type:
- Sample-based
- Population-based
Linear Regression Calculate a linear trend based on previous metric values. 2nd Degree Polynomial Regression Calculate a quadratic trend by projecting a curve with the following equation: y=ax^2+bx+c Single Exponential Mean Calculates a trend by averaging weight-based metric values. In the Recent Value Weight Calculation field, specify a large number to give more weight to the most recent metric values or specify a small number to give more weight to the oldest metric values.
Double Exponential Mean Calculates a trend by averaging weight-based metric values. In the Recent Value Weight Calculation field, specify a large number to give more weight to the most recent metric values or specify a small number to give more weight to the oldest metric values.
Note that double exponential mean calculations are more accurate for predicting the trend trajectory.
Static Value Calculate a trend based on a static metric value compared to a metric calculation. Specify a static value and select a metric calculation:
- Rate per hour
- Rate per minute
- Count
This model is useful to plot constant lines for SLAs.
Trimean Calculate a trend based on the weighted average of the 25th, 50th, and 75th percentile metric values. Time Delta Calculate a trend by comparing current metric values to historical data. Winsorized Mean Calculate a trend by retrieving metric values at specified low and high percentages and replacing them with the lowest and highest remaining values. For example, metric values above the 90th percentile become the same value as the 90th, and metric values below the 10th percentile become the same value as the 10th.
From the Winsorization drop-down list, select a percentage pair:
- 5/95th Percentile
- 10/90th Percentile
- 25/75th Percentile
-
From the Trend Window drop-down list, select a
calculation window.
Same Hour of Week Calculate a trend by comparing metrics gathered from the same 1-hour window each week. Same Hour of Day Calculate a trend by comparing metrics gathered from the same 1-hour window each day. Minute Rolling Average Calculate a trend by averaging metric values gathered each minute within a specified amount of time from the present time. Hour Rolling Average Calculate a trend by averaging metric values gathered each hour within a specified amount of time from the present time. -
In the Trend Lookback field, specify the time
window of historical data the ExtraHop system will review to calculate
the trend. Valid lookback values are determined by the selected Trend
Window.
- Specify a value between 1-45 days if Same Hour of Day is selected.
- Specify a value between 1-15 weeks if Same Hour of Week is selected.
- Specify a value between 1-48 hours if Hour Rolling Average is selected.
- Specify a value between 1-999 minutes if Minute Rolling Average is selected.
-
From the Trend Weighting Model drop-down list, select a model. The
weighting model aggregates historical metric values to calculate a
trend.
-
In the Alert Condition section, specify conditions for generating an
alert.
- From the Match All drop-down list, select an option to generate an alert when all, any, or none of the alert conditions are met.
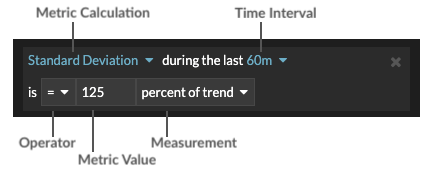
-
Select a metric calculation to specify how to calculate the metric
value within the time interval.
Mean Calculate the mean value of the metric. Median Calculate the 50th percentile value of the metric. 25th Percentile Calculate the 25th percentile value of the metric. 75th Percentile Calculate the 75th percentile value of the metric. Standard Deviation Calculate the standard deviation compared to the metric. The standard deviation is the amount of variation from the trend. Count Specify the absolute total of the metric. No measurement is required. - Select the time interval over which the metric value is observed. You can select an interval from 30 seconds up to 30 minutes.
- Select an operator to specify how the metric calculation is compared to the metric value.
- Specify the metric value to compare to the metric calculation.
-
Specify how to measure the metric value.
- Percent of trend
- Absolute
- Per second
- Per minute
- (Optional): Click Add Condition to add more condition criteria or click Add Condition Group to nest condition criteria.
For example, to generate an alert when the standard deviation of the observed metric over a 60 minute interval is equal to a trend value of 25%, specify the following conditions:- Metric Calculation: Standard Deviation
- Time Interval: 60m
- Operator: =
- Metric Value: 125
- Measurement: percent of trend
- (Optional): In the Notifications section, add an email notification to an alert to receive emails or SNMP traps when an alert is generated.
- In the Status section, click an option to enable or disable the alert.
- (Optional): Add an exclusion interval to suppress alerts during specific times.
- Click Save.
Thank you for your feedback. Can we contact you to ask follow up questions?