Configure a threshold alert to monitor when a specific metric crosses a defined
boundary. For example, you can generate an alert when an HTTP 500 status code is observed
more than 100 times during a ten minute period.
-
Log in to the ExtraHop system through
https://<extrahop-hostname-or-IP-address>.
-
Click the System Settings icon
 and then click Alerts.
-
Click Create.
-
Type a unique name for the alert configuration in the
Name field.
-
In the Description field, add information about the
alert.
| Tip: | Alert descriptions support Markdown, which is a simple
formatting syntax that converts plain text into HTML. For more information,
see the Alerts FAQ. |
-
In the Alert Type section, click Threshold
Alert.
-
In the Assigned Sources field, type the name of a
device, device group, or application and then select from the search
results.
To search for a site, flow network, or flow interface, select that source type
from the drop-down menu at the top of the search results.
- (Optional):
Click Add Source to assign the alert to multiple
sources. Multiple sources must be of the same type, such as only devices and
device groups or only applications.
| Tip: | Assign an alert to a device group to efficiently manage
assignments to multiple devices. |
-
In the Monitored Metric field, type the name of a metric
and then select from the search results.
The metric must be compatible with the assigned sources. For example, if you
assign the alert to an application, you cannot select a device metric.
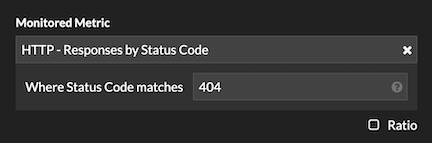
| Note: | If
you select a detail
metric, you can specify a key value. For example, you might
select HTTP - Responses by Status Code and then specify 404 as the key
value. An alert is generated only when HTTP responses with 404 status codes
occur.
|
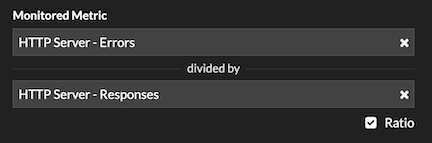
- (Optional):
To monitor the value of a metric divided by a secondary metric, click
Ratio and then select a secondary metric.
For example, you can monitor the percentage of HTTP errors occurring on
responses by dividing HTTP response errors by HTTP responses.
-
In the Alert Condition section, specify conditions for generating an
alert.
-
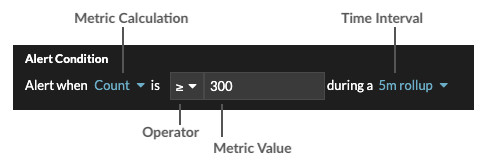
Select a metric calculation to specify how to calculate the metric
value within the time interval. The options available depend on the data
type.
| Count |
- Count
- Rate per second
- Rate per minute
- Rate per hour
|
| Dataset |
- Minimum
- 25th percentile
- Median
- 75th percentile
- Maximum
|
| Sampleset |
- Mean
- +1 to +7 standard deviations
- -1 to -7 standard deviations
|
| Maximum, Snapshot |
No measurement; the operator compares the actual
metric value. |
-
Select an operator to specify how to compare the metric calculation to
the metric value.
-
Specify the metric value to be compared to the metric
calculation.
-
Select the time interval over which the metric value is observed and
metric data is aggregated, or rolled up. You can select a time interval
from 30 seconds up to 30 minutes.
For example, to generate an alert when more than 300 HTTP response errors
occur within 5 minutes, specify the following conditions:
- Metric Calculation: Count
- Operator: >
- Metric Value: 300
- Time Interval: 5m rollup
- (Optional):
In the Notifications section, add an
email notification to an alert to receive emails or SNMP traps when
an alert is generated.
-
In the Status section, click an option to enable or disable the alert.
- (Optional):
Add an
exclusion interval to suppress alerts during specific times.
-
Click Save.
Thank you for your feedback. Can we contact you to ask follow up questions?