Edit a text box widget
If you want to include explanatory text next to your dashboard charts or display a company logo in your dashboard, you can edit a text box widget. With the text box widget, you can display text, links, images, or sample metrics in your dashboard.
| Video: | See the related training: Provide Context with Text Box Widgets |
The text box widget supports Markdown, which is a simple formatting syntax that converts plain text into HTML with non-alphabetic characters, such as "#" or "*". New text box widgets contain Markdown examples. A text box widget is automatically provided each time you create a dashboard. You can also add a text box widget to your dashboard layout.
To edit an existing text box widget, complete the following steps:
-
Click the command menu
 in the upper right corner and select
Edit Layout.
in the upper right corner and select
Edit Layout.
Format text in Markdown
The following table shows common Markdown formats that are supported in the text box widget.
| Note: | Additional Markdown format examples are provided in the GitHub Guides: Mastering Markdown. However, not all Markdown syntax formatting options are supported in the ExtraHop text box widget. |
| Format | Description | Example |
|---|---|---|
| Headings | Place a number sign (#) before your text to format headings. The level of heading is determined by the amount of number signs. | ####Example H4 heading |
| Unordered lists | Place a single asterisk (*) before your text. | * First example * Second example |
| Ordered lists | Place a single number and period (1.) before your text. | 1. First example 2. Second example |
| Bold | Place double asterisks before and after your text. | **bold text** |
| Italics | Place an underscore before and after your text. | _italicized text_ |
| Hyperlinks |
Place link text in brackets before the URL in parentheses. Or type your URL. Links to external websites open in a new browser tab. Links within the ExtraHop system, such as dashboards, open in the current browser tab. |
[Visit our home page](https://www.extrahop.com) https://www.extrahop.com |
| Blockquotes | Place a right angle bracket and a space before your text. |
On the ExtraHop website: > Access the live demo and review case studies. |
| Monospace font | Place a backtick (`) before and after your text. | `example code block` |
| Emojis | Adding emojis in Markdown syntax is unsupported; however, you can copy and
paste a Unicode emoji image into the text box. See the Unicode Emoji Chart website for images. |
Add images in Markdown
You can add images to the text box widget by linking to them. Make sure your image is hosted on a network that is accessible to the ExtraHop system.
Links to images must be specified in the following format:

Where <alt_text> is the alternative text for the image name and <file_path> is the path of the image. For example:

| Note: | You also can add images by encoding them to Base64. For more information, see the following post on the ExtraHop forum, "Putting Images in Text Boxes." |
Add metric examples in Markdown
You can write a metric query to include a metric value inline with text in the text box widget. For example, to show how many web servers have returned a 404 error, you can add a metric query to a sentence and the value is updated within the text.
The following example shows the basic format for writing metric queries:
%%metric:{
    "metric_category": "<metric_category>",
    "object_type": "<object_type>",
    "object_ids": [object_id],
    "metric_specs": [
        {
            "name": "<metric_spec>"
        }
    ]
}%%
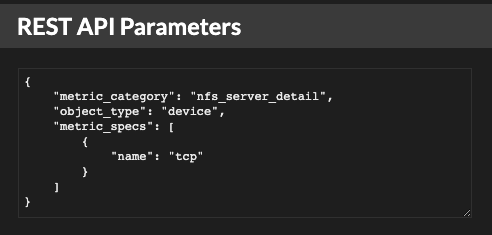
To locate the object_type, metric_spec, and metric_category values for a metric, complete the following steps:
- Click Settings
- Click Metric Catalog.
- Type the metric name in the search field.
- Select the metric, and note the values for metric_category, object_type, and metric_spec in the REST API Parameters section.
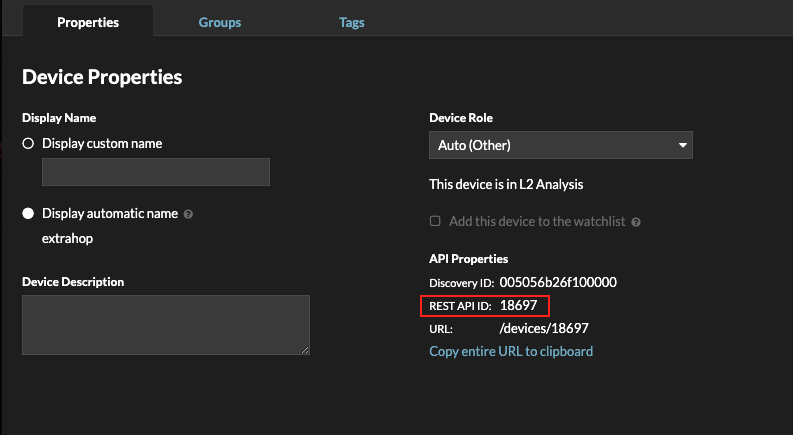
To locate the object_id for a device, device group, or other asset, complete the following steps:
- Click Assets, and then click an asset type from the left pane.
- Click the name of the asset you want, and then open the properties window.
- Note the value displayed for the REST API ID.
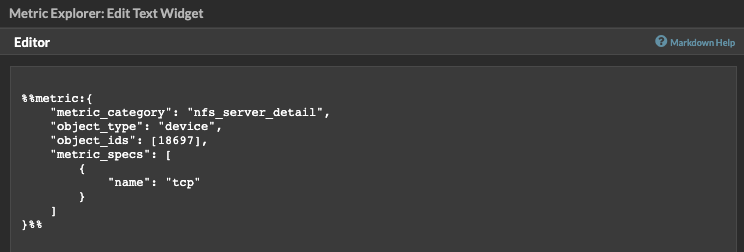
After you locate the values for the metric you want to display, add them to the metric query in the text editor. The value will be displayed in the text widget.
| Note: | The following metric queries are unsupported in the text box widget:
|
Metric query examples for the text box widget
The following examples show you how to write top-level, or base, metric queries for application, device, and network objects. You can also write a query for detail metrics.
Application metrics
To specify the All Activity object, the object_ids is "0".
This example query shows how you can retrieve HTTP metrics from the All Activity application object, and displays the following output: "Getting [value] HTTP requests and [value] HTTP responses from All Activity."
Getting
%%metric:{
"object_type": "application",
"object_ids": [0],
"metric_category": "http",
"metric_specs": [{"name":"req"}]
}%%HTTP requests and
%%metric:{
"object_type": "application",
"object_ids": [0],
"metric_category": "http",
"metric_specs": [{"name":"rsp"}]
}%%
HTTP responses from All Activity.
Device metrics
You must specify either a client ("_client") or server ("_server") in the metric_category. To retrieve metrics for a specific device, specify the device object ID number in object_ids. To retrieve the device object ID (deviceOid), search for the device object in the ExtraHop global search. Select the device from your search results. The "deviceOid=" value will be embedded in the URL query string.
This example query shows how to retrieve metrics from a device client object, and displays the following output: "Getting [value] CLIENT DNS response errors from a specific device."
Getting
%%metric:{"object_type": "device",
"object_ids": [8],
"metric_category": "dns_client",
"metric_specs": [{"name":"rsp_error"}]
}%%
CLIENT DNS response errors from a specific device.
This example query shows how to retrieve metrics from a device server object, and displays the following output: "Getting [value] SERVER DNS response errors from a specific device."
Getting
%%metric:{
"object_type": "device",
"object_ids": [156],
"metric_category": "dns_server",
"metric_specs": [{"name":"rsp_error"}]
}%%
SERVER DNS response errors from a specific device.
Network metrics
To specify All Networks, the object_type is "capture" and the object_ids is "0." To specify a specific VLAN, the object_type is "vlan" and the object_ids is the VLAN number.
This example query shows how to retrieve metrics for all networks, and displays the following output: "Getting [value] broadcast packets from all networks."
Getting
%%metric:{
"object_type": "capture",
"object_ids": [0],
"metric_category": "net","metric_specs": [{"name":"frame_cast_broadcast_pkts"}]
}%%
broadcast packets from all networks.
This example query shows how to retrieve metrics for a specific VLAN and displays the following output: "Getting [value] broadcast packets from VLAN 3."
Getting
%%metric:{
"object_type": "vlan",
"object_ids": [3],
"metric_category": "net",
"metric_specs": [{"name":"frame_cast_broadcast_pkts"}]
}%%
broadcast packets from VLAN 3.
Group metrics
To specify a group, the object_type is "device_group." You must specify either a client ("_client") or server ("_server") in the metric_category. The object_ids for the specific group must be retrieved from the REST API Explorer.
This example query shows how to retrieve metrics for all networks, and displays the following output: "Getting [value] HTTP responses from the HTTP Client Device Group."
Getting
%%metric:{
"object_type": "device_group",
"object_ids": [17],
"metric_category": "http_client",
"metric_specs": [{"name":"req"}]
}%%
HTTP responses from the HTTP Client Device Group.
Detail metrics
If you want to retrieve detail metrics, your metric query should contain additional key parameters, such as key1 and key2:
- object_type
- object_ids
- metric_category
- metric_spec
- name
- key1
- key2
| Important: | You must supply the object_ids in your query. |
This example shows how to retrieve HTTP requests by URI for the All Activity application (object_ids is "0"):
%%metric:{
"object_type": "application",
"object_ids": [0],
"metric_category": "http_uri_detail",
"metric_specs": [{"name":"req"}]
}%%
This example query shows you how to retrieve HTTP requests by URIs that contain a key value for "pagead2" for the All Activity application (object_ids is "0"):
%%metric:{
"metric_category": "http_uri_detail",
"object_type": "application",
"object_ids": [0],
"metric_specs": [
{
"name": "req",
"key1": "/pagead2/"
}
]
}%%
This example query shows how to retrieve count metrics for all networks and displays the following output: "Getting [value] detail ICA metrics on all networks."
Getting
%%metric:{
"object_type": "capture",
"object_ids": [0],
"metric_category": "custom_detail",
"metric_specs": [{
"name":"custom_count",
"key1":"network-app-byte-detail-ICA"
}]
}%%
detail ICA metrics on all networks.
This example query shows how to retrieve a custom dataset statistic with topn keys and percentiles, and displays the following output: "The fifth percentile is: [value]."
The fifth percentile is:
%%metric:{
"object_type": "vlan",
"object_ids": [1],
"metric_category": "custom_detail",
"metric_specs": [{
"name": "custom_dset",
"key1": "myCustomDatasetDetail",
"key2": "/10.10.7/",
"calc_type": "percentiles",
"percentiles": [5]
}]
}%%
.
| Note: | Sampleset metrics are unsupported in the text box widget. For example, adding the "calc_type": "mean" parameter to your text box query is unsupported. |
Thank you for your feedback. Can we contact you to ask follow up questions?