Build a trigger to collect custom metrics for HTTP 404 errors
When your customers and clients cannot reach the information they need due to web page errors, you can write a trigger to help you find answers.
For example, when a customer requests a page that your HTTP server cannot find, the server responds with a 404 status code, or "page not found" error. Such responses tend to indicate that the link the customer clicked leads to an invalid URI. It would be useful to know what URI customers are trying to access and to find the referrer, or source, of the invalid link.
In this walkthrough, you will build a trigger that answers the following questions:
- Are my customers receiving "page not found" errors?
- What is the URI of the page that results in the error?
- What is the referrer that caused the error?
You will create a trigger that generates a new custom metric that returns both the invalid URI and the referrer of the invalid URI. You will also create an application that provides a tailored view of your web traffic by collecting web metrics each time a 404 status code occurs on specified devices.
Prerequisites
- You should familiarize yourself with the concepts in this walkthrough by reading the Get started with triggers section of the ExtraHop System User Guide.
- You must have access to an ExtraHop system with a user account that has limited write or full write privileges.
- Your ExtraHop system must have network data with web server traffic.
- It is helpful to have basic JavaScript knowledge.
Configure the trigger
In the following steps, you will name and describe the trigger, enable debugging, and configure the trigger to run on HTTP response events.
-
Click the System Settings icon
 , and then click
Triggers.
, and then click
Triggers.
- Click Create.
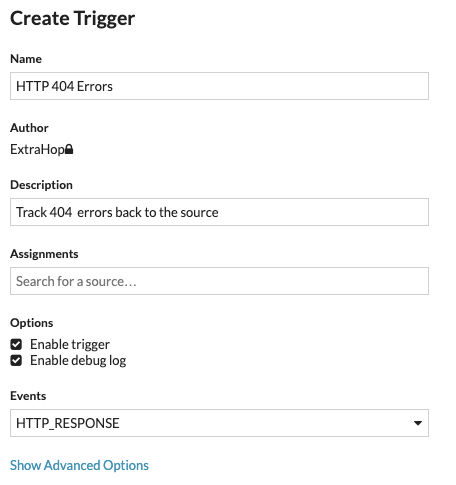
- Type a name for the trigger. For this walkthrough, type HTTP 404 Errors.
- Type a description of the trigger. For this walkthrough, type Track 404 errors back to the source.
- Click Enable debug log.
- Click in the Events field and select HTTP_RESPONSE from the list.
Write a debug statement
Next, add a simple debug statement to familiarize yourself with the trigger editor layout and features.
When the trigger runs, it seeks HTTP response events and checks if the status code in the response is 404. If a 404 status code is detected, the debug call adds the URL that the user attempted to access to the debug log.
-
Add the following code to the editor:
if (HTTP.statusCode === 404) { debug (HTTP.uri); }Tip: The editor provides some autocomplete capabilities when typing code. For example, typing a dot (.) after selecting a class object results in a list of methods and properties applicable to the HTTP object. You can select the element you want from the list as shown in the following figure: 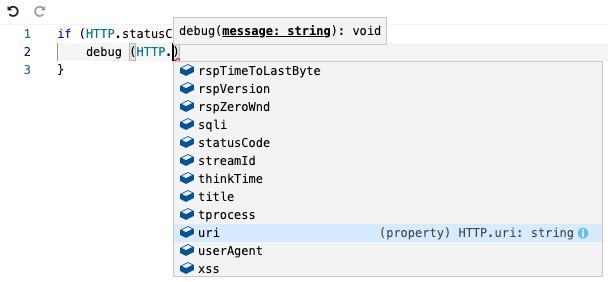
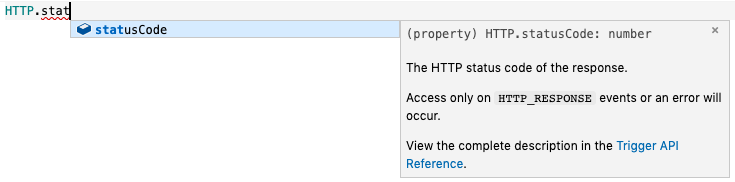
Clicking the i icon displays a description of the current element, as shown in the following figure:
Assign the trigger to devices
Before the trigger can log output from the debug statement, you must assign the trigger to at least one device. For this walkthrough, you will assign the trigger to the HTTP server device group.
After the trigger is assigned, the system runs the trigger each time an HTTP response occurs on any server in that group.
| Important: | When creating your own triggers, only assign triggers to the specific devices that you need to minimize the performance impact of your triggers on the system. |
- Click Assets from the top menu.
- Click Device Groups, and then select HTTP Servers checkbox.
- Click Assign Trigger from the top of the page to open a list of triggers that are eligible for assignment.
- Select the HTTP 404 Errors trigger, and then click Assign Triggers.
- Click the System Settings icon, return to the Triggers page, and select the HTTP 404 Errors trigger .
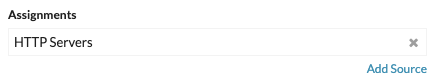
- In the Assignments field, verify that the selected HTTP servers are added.
View debug output
After you assign the trigger to HTTP servers, the system runs the trigger when HTTP response traffic occurs, and if any responses contain a 404 status code the system sends results to the debug log.
To view the results of the debug statement, click the Debug Log tab, which should look similar to the following figure:
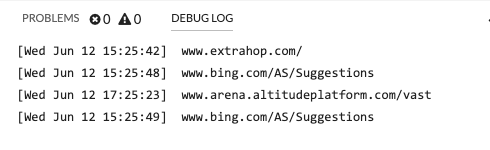
Debug output starts as soon as the trigger is assigned and saved; however, the log cannot display data from 404 responses that occurred prior to when the trigger was assigned and saved.
Create a custom metric
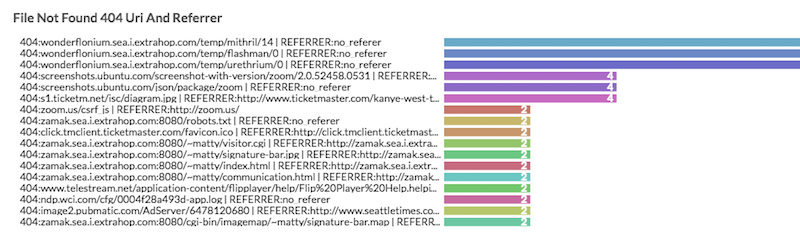
The debug statement results have verified that there are URIs resulting in 404 status codes. In this section, you will create a custom metric named "404UriAndReferrer" to extract the invalid URIs and corresponding referrers.
The custom metric will return both the invalid URI and the referrer of the link enabling you to extract the two data sets in a single result.
To create a custom metric, you must specify a metric source from which the data is extracted, such as an application, network, or device. In this walkthrough, you will create an application named "File Not Found" as the source for the custom metric.
View the custom metric in a chart
To view your custom metric, you must to add it to a chart widget on a dashboard. In the chart, the custom metric will reveal which URIs are invalid and the referrer of each invalid link.
For more information about viewing metrics on a dashboard, see the Get started with dashboards section of the ExtraHop System User Guide.
-
On the Dashboard page, click the command menu
 in the upper right
corner, and select Create Chart.
in the upper right
corner, and select Create Chart.
Gather built-in metrics in the application
In the previous steps, you added code to the script to create an application as the source of your new custom metric. In this section, you will add code that enables the application to gather built-in HTTP metrics, but not custom metrics, to provide a tailored view of your web traffic each time a 404 status code occurs on the specified devices.
View the application and metric pages
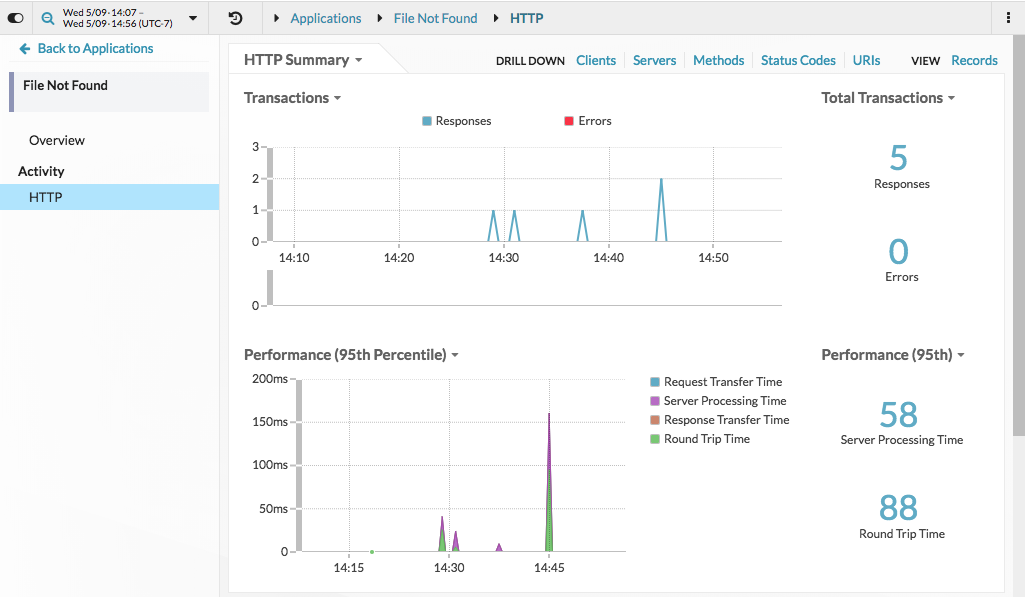
The new "File Not Found" application is created the first time the trigger runs and the conditions specified by the trigger script are met. After you commit the application, it might take several minutes before the trigger runs and data is available in the application.
The committed application adds built-in metric data relevant to the conditions defined by your trigger each time the trigger runs. In this walkthrough, built-in HTTP metrics are added to the application each time an HTTP response results in a 404 status code on the selected devices
The application displays the collected data on one or more protocol pages. Protocol pages are automatically created depending on the protocol objects included in your trigger. In this walkthrough, because the trigger runs on HTTP responses, the "File Not Found" application contains a protocol page called Web that displays built-in HTTP metrics. If you create a trigger configured to run on SSL events, the application displays a page of built-in SSL metrics, and a trigger that runs on Flow events displays a page of built-in L4 metrics.
- Click Assets from the top menu.
- In the left pane, click Applications, and then select the File Not Found application.
- In the left pane, click HTTP to view the built-in HTTP metrics collected in the application.
Check the trigger performance
Triggers are a powerful tool that can provide detailed insight to your environment; however, triggers consume resources and affect system performance. In this section, you will check the performance impact of the trigger and learn about small changes you can make to improve performance.
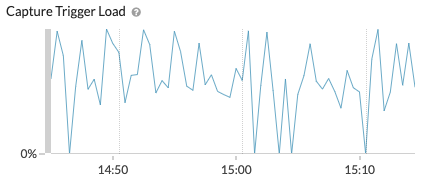
The trigger performance graph provides the number of cycles the trigger has consumed within the specified time interval. You can hover over a data point to display details about trigger performance at a single point in time.
In the Edit Trigger pane, view the Capture Trigger Load chart. chart looks similar to the following figure:
| Tip: | The System Health page in the System Settings provides additional trigger performance charts that enables you to monitor the cumulative effect of all of your triggers on the system. See the System Health dashboard topic. |
Try making the following changes, and then check the performance graph to view any changes:
- Comment out the debug statement. You have verified that the trigger works and is collecting the custom and built-in metrics you want; you no longer need the debug output.
- Reassign the trigger to specific devices instead of all HTTP servers in the device group.
For additional trigger optimization tips and tricks, see the ExtraHop Trigger API Reference and the following Trigger Optimization 101 blog posts in the ExtraHop Community Forums:
Thank you for your feedback. Can we contact you to ask follow up questions?