Monitor load balancer performance in a dashboard
During times of high demand on an application or service, you can configure a load balancer to help with service reliability and hardware optimization. A load balancer is a set of resources, such as servers, that absorb a large burst of HTTP, DNS, LDAP, or other types of requests.
But how well is the load balancer you designed actually working? Before a campaign launch or marketing event, how can you confirm that your load balancer won't be a bottleneck for increased traffic? Build a dashboard!
Dashboards include multiple types of charts that reveal information about the volume of requests and traffic routed on your network, which can shed light on the effectiveness of load balancing.
This walkthrough shows you how to create a dashboard, create a device group, and then drill down on server metrics to answer the following questions:
- How much traffic is my load balancer handling?
- How well is my virtual load balancer working?
- Are back-end servers experiencing issues?
Prerequisites
- You must have access to an ExtraHop system with a user account that has limited or full write privileges.
- You should have already configured a server-side load balancer and you will need to know the virtual IP address (VIP) on the load balancer as well as the IP addresses or name of each back-end server.
- Familiarize yourself with Dashboards.
Create a dashboard
Let's create a dashboard to display helpful visualizations about load balancer performance metrics.
- At the top of the page, click Dashboards.
-
Click the command menu
 in the upper right corner and select New
Dashboard to create an empty dashboard.
in the upper right corner and select New
Dashboard to create an empty dashboard.
- Type a name for your dashboard in the Title field. For this walkthrough, type HTTP Load Balancer.
- Click Create. When you create a new dashboard, a workspace opens in an editable layout mode. This workspace contains a single region and two empty widgets: a chart and a text box.
-
Text box widgets can include custom explanatory text about a dashboard or
chart. For this walkthrough, however, we won't be adding text. Delete the text
box by completing the following steps:
-
Click the command menu in the upper right corner of the text box widget
and select Delete.
- Click Delete Widget.
-
Click the command menu
How much web traffic is my load balancer handling?
Let's monitor the number of HTTP requests that are received by your front-end virtual load balancer.
- Click the empty chart widget in your newly created dashboard to open the Metric Explorer.
- Click Add Source.
-
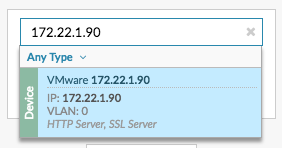
In the Sources field, type the virtual IP address of the load balancer to
filter the results, and then select the virtual load balancer device, as shown
in the following figure.
-
In the Metrics field, type http requests to filter the
results, and then select HTTP Server Requests.
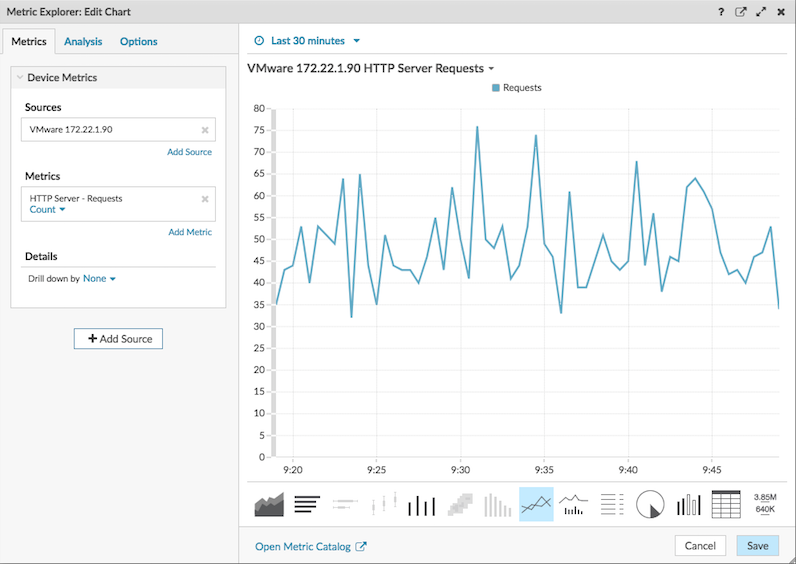
- Click Save.
- Click Exit Layout Mode in the upper right corner.
Create a device group for back-end servers
Our example load balancer consists of a single front-end virtual server and three back-end servers that host web services. To make it easier to build dashboard charts for back-end servers, we'll first create a device group. A device group in the ExtraHop system combines all the metrics associated with several devices into one source.
- Log in to the ExtraHop system through https://<extrahop-hostname-or-IP-address>.
- At the top of the page, click Assets .
- In the left pane, click Device Groups.
-
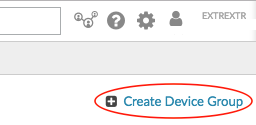
In the upper right corner of the page, click Create Device
Group.
- In the Name field, type a name for the device group. For this walkthrough, type LB Servers.
- In the Group Type section, leave Static (add and remove devices manually) selected.
- (Optional): Type a description for your device group. This description appears in search results.
- Click Save. Your new device group has been created and is empty.
-
Next, find each back-end server in the ExtraHop system and add it to the LB
Servers device group by completing the following steps:
- In the left pane, click Devices.
- In the search field at the top of the page, type the server name or IP address and then click Search.
- Select the checkbox next to the server name. You can select more than one device.
- In the upper right corner, click Assign to Group. Click the Group drop-down list, select LB Servers, and then click Add to Group.
- Repeat these steps as necessary to add all the back-end servers to the LB Servers device group.
How well is my load balancer working?
Let's add a bar chart to the dashboard to see how well the front-end load balancer is distributing web requests to each back-end server.
- Click Dashboard at the top of the page and then HTTP Load Balancer in the left pane.
-
Click the command menu in the upper right corner and select Edit
Layout.
-
From the bottom of the page, click and drag a chart widget into the empty space
next to the first chart.

- Click the empty chart.
-
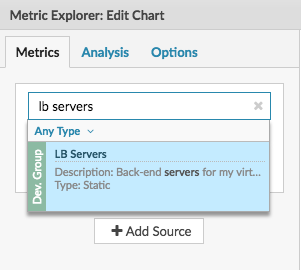
Click Add Source and type lb
servers to filter the results, and then select the LB
Servers device group.
- Type http requests to filter results and then select HTTP Requests.
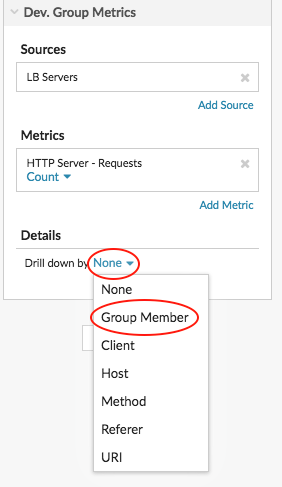
-
In the Details section, click the Drill down by None
drop-down list and then select Group Member.
-
From the bottom of the page, click the Bar chart.

- Click Save and then click Exit Layout Mode.
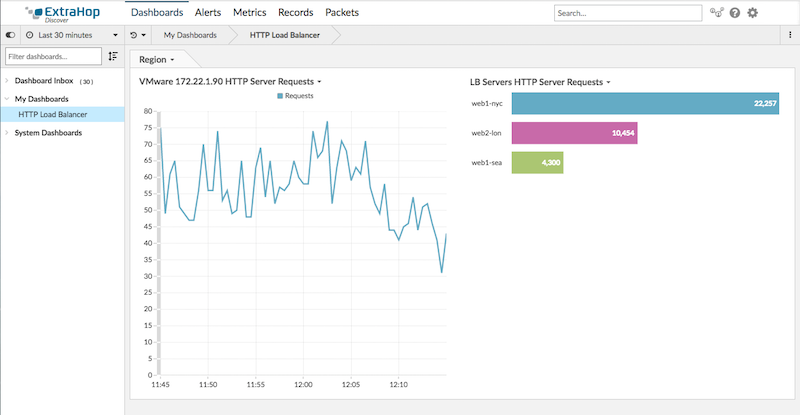
Are back-end servers experiencing issues?
In the LB Servers HTTP Server Requests chart, we see one server handling more HTTP requests than the other servers. To understand what potential issues might be linked to the high number of requests, we'll interact with the chart data to learn more.
-
Click the server name in the chart to drill down. A drop-down menu
appears.
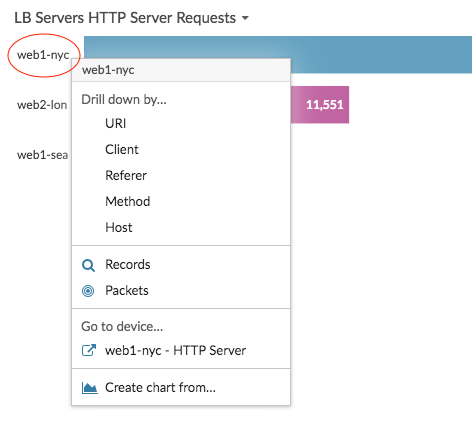
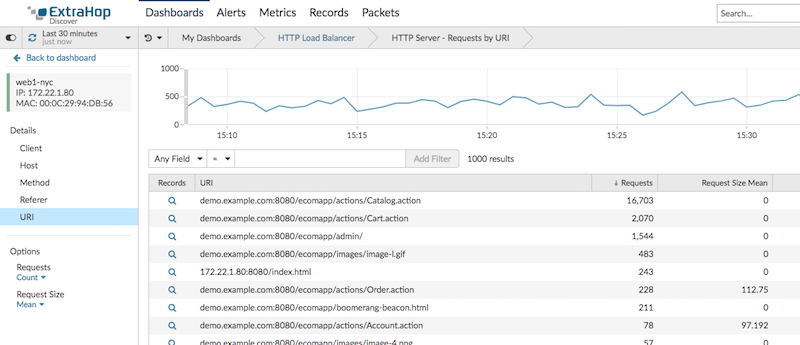
-
Select a key in the Drill down by… section, such as
URI. A detail page appears. The following figure
shows an example of a detail page that displays all HTTP requests received by
the busy server, broken down by URI.
- Click the dashboard name in the navigation path at the top of the page to return to the chart.
-
Click the server name in the chart again, and then select the device name in
the Go to device… section.

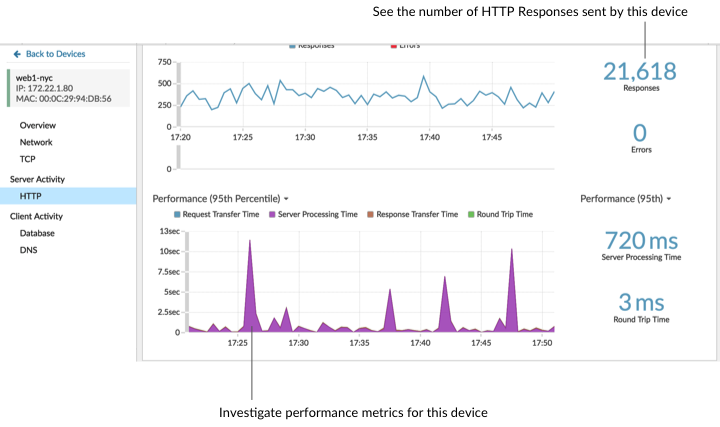
From this protocol page, we see that the server is responding to requests without errors, but the server is taking almost a second to process requests. We can now follow up with the appropriate team to make sure that server processing time doesn't become an issue.
Troubleshoot load balancer issues
You now have several charts to consult when a slow load balancer is reported. The following table includes suggestions for interpreting chart data and then troubleshooting issues.
| Potential Issue | Look at dashboard metrics | Follow-up action |
|---|---|---|
| A high volume of web traffic | Review your line chart that contains the number of HTTP requests received by the front-end load balancer. Change the time interval to see how the number of requests change over time. | If you want to see which clients, URIs, referrers are associated with the highest number of requests, click the Request metric label in the chart legend. A drop-down menu appears with drill-down options. |
| Traffic is not evenly distributed across back-end servers | Review the bar chart that contains a breakdown of HTTP requests received by back-end servers. Is one server receiving more requests than the others? | Not all load balancers are set up to equally balance requests. For example, a load balancer might be configured with a "sticky sessions" rules, where the distribution of requests are not perfectly identical across all servers. Follow up with your load balancer team to find out. |
Thank you for your feedback. Can we contact you to ask follow up questions?