ExtraHop System User Guide
About this guide
This guide provides information about the ExtraHop system for the ExtraHop Discover and Command appliances.
The purpose of this guide is to help users understand the ExtraHop system architecture and functionality as well as learn how to operate the controls, fields, and options available throughout the system.
Additional resources are available through the following links:
- See information about administrator features and functions for the ExtraHop Discover and Command appliances in the ExtraHop Admin UI Guide
- See the complete ExtraHop documentation set: https://docs.extrahop.com.
- See online training modules on the ExtraHop website: https://www.extrahop.com/go/training/.
Contact us
We value your feedback.
Please let us know how we can improve this document. Send your comments or suggestions to documentation@extrahop.com.
Support Portal Website: https://customer.extrahop.com/s/
Telephone:
- 877-333-9872 (US)
- +44 (0)203 7016850 (EMEA)
- +65-31585513 (APAC)
Introduction to the ExtraHop system
This guide explains how the ExtraHop system collects and analyzes your data and how the core system components and functionalities help you access detections, metrics, transactions, and packets about the traffic on your network.
| Video: | See the related training: ExtraHop System Overview |
Platform Architecture
The ExtraHop system is customized with modular components that combine to satisfy your unique environmental needs.
Modules
ExtraHop modules offer a combination of solutions, components, and cloud-based services that deliver value for multiple use cases.
Modules are available for Network Detection and Response (NDR) and Network Performance Monitoring (NPM), with additional modules for Intrusion Detection Systems (IDS) and Packet Forensics.
Administrators can grant users role-based access to the NDR module, NPM module, or both.
- Network Performance Monitoring
- The NPM module allows privileged users to complete the following types of system
tasks.
- View, create, and modify custom dashboards. Users can also select a dashboard for their default landing page.
- Configure alerts and notification by email for those alerts.
- View performance detections.
- Network Detection and Response
- The NDR module allows privileged users to complete the following types of system
tasks.
- View the Security Overview page.
- View security detections.
- View, create, and modify investigations.
- View threat briefings.
Users granted access to both modules are allowed to complete all of these tasks. See the Migration Guide to learn more about migrating users to role-based access with these modules.
Additional modules are also available for specific use cases:
- Packet Forensics
- The Packet Forensics module can be combined with either the NDR or NPM module to provide full packet capture, storage, and retrieval.
- Intrusion Detection Systems
- The IDS module must be combined with the NDR module, and provides detections based on industry-standard IDS signatures.
Features
The ExtraHop system provides an extensive feature set that enables you to organize and analyze detections, metrics, records, and packets associated with the traffic on your network.
Module and system access are determined by user privileges that are managed by your ExtraHop Administrator.
Global features
- Network Overview
- Perimeter Overview
- Activity maps
- Active Directory dashboard
- Generative AI dashboard
- Dashboard reports
- Detection tracking
- Assets
- Geomap
- Records
- Packets
- Integrations (Reveal(x) 360 only)
- API access
- Analysis priorities
- Metric catalog
- Bundles
- Triggers
NDR module features
- Security Overview
- Executive Reports
- Built-in security dashboards
- Security detections
- MITRE map
- Investigations
- Tuning rules for security detections
- Notification rules for security detections and threat briefings
- Threat Briefings
- Threat Intelligence
NPM module features
- Custom dashboards
- Built-in performance dashboards
- Performance detections
- Tuning rules for performance detections
- Notification rules for performance detections
- Alerts
Solutions
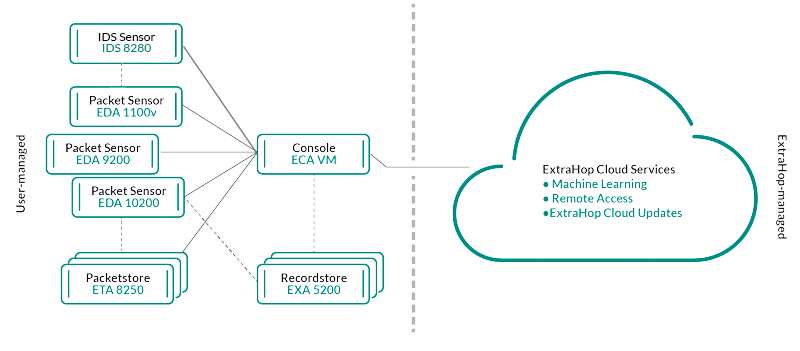
- Reveal(x) Enterprise
- Reveal(x) Enterprise is a self-managed solution that comprises sensors,
consoles, packetstores, recordstores, and access to ExtraHop Cloud
Services.
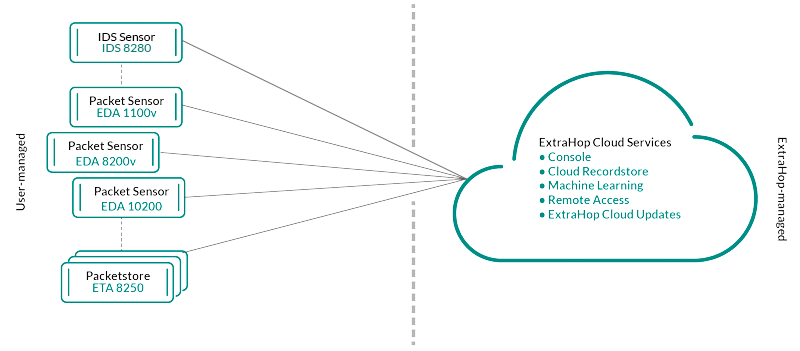
- Reveal(x) 360
- Reveal(x) 360 is a software-as-a-service (SaaS) solution that comprises sensors and packetstores and includes a cloud-based
recordstore, a console, and access to ExtraHop Cloud
Services.
Components
Each solution offers a set of components based on your environmental needs: sensors, packetstores, recordstores, and a console for centralized management and unified data views.
- Packet sensors
- Packet sensors capture, store, and analyze metric data about your network. Multiple levels of data analysis, collection, and storage are available by sensor size. These sensors are available in both NPM and NDR modules as physical, virtual, and cloud-based options in sizes that are based on your analysis needs.
- IDS sensors
- Intrusion Detection System (IDS) sensors integrate with packet sensors to generate detections based on industry-standard IDS signature. IDS sensors are deployed as an add-on module to the NDR module. IDS sensors are a physical appliance with a companion packet sensor and are available for Reveal(x) 360 or Reveal(x) Enterprise environments.
- Flow sensors
- Flow sensors are available for Reveal(x) 360 only and exclusively collect VPC flow logs so that you can see traffic managed by AWS SaaS services.
- Recordstores
- Recordstores integrate with sensors and consoles to store transaction and flow records that can be queried from throughout the ExtraHop system. Recordstores can be deployed as standalone physical or virtual options, supported as third-party connections to Splunk or BiqQuery from Reveal(x) Enterprise, and are available in packages with NPM and NDR modules.
- Packetstores
- Packetstores integrate with sensors and consoles to provide continuous packet capture and sufficient storage for deeper investigations and forensic needs. Packetstores can be deployed as standalone physical or virtual options and are available as an add-on Packet Forensics module for both NPM and NDR modules.
- Consoles
- Consoles provide a browser-based interface that provides a command center for all
connected components. Consoles can be deployed as
standalone virtual or cloud-based options for Reveal(x) Enterprise and are included with
Reveal(x) 360.
The following table provides an overview of the options available for each solution.
-
Reveal(x) Enterprise Reveal(x) 360 Physical Virtual/Cloud Physical Virtual/Cloud Packet sensor IDS sensor IDS 8280 N/A IDS 8280 N/A Flow sensor N/A N/A N/A EFC 1291v Packetstore Included with Ultra subscriptions
Recordstore N/A Included with Premium and Ultra subscriptions Console N/A N/A Included with all subscriptions
ExtraHop Cloud Services
Smart Sensor Analytics
The ExtraHop system offers a browser-based interface with tools that enable you to explore and visualize data, investigate findings in both top-down and bottom-up workflows, and customize how you collect, view, and share your network data. Advanced users can automate and script both administrative and user tasks through the ExtraHop REST API and customize data collection through the ExtraHop Trigger API, which is a JavaScript IDE tool.
At the core of the ExtraHop system is a smart sensor that captures, stores, and analyzes metric data about your network—and offers different levels of data analysis, collection, and storage based on your needs. Sensors are provisioned with storage that supports 30 days of metric lookback. Note that actual lookback varies by traffic patterns, transaction rates, the number of endpoints, and the number of active protocols.
Consoles act as a command center with connections to multiple sensors, recordstores, and packetstores that are distributed across data centers and branch offices. All Reveal(x) 360 deployments include a console; Reveal(x) Enterprise can deploy virtual or cloud variations.
Consoles provide unified data views across all your sites and enable you to sync certain advanced configurations (such as triggers and alerts) and settings (tuning parameters, analysis priorities, and recordstores).
The following sections describe the major functional components of the ExtraHop system and how they work together.
Sensor Types
The type of sensor you deploy determines the type of data that is collected, stored, and analyzed.
Wire data
Packet sensors passively observe unstructured packets through a port mirror or tap and store the data in the local datastore. The packet data goes through real-time stream processing that transforms the packets into structured wire data through the following stages:
- TCP state machines are recreated to perform full-stream reassembly.
- Packets are collected and grouped into flows.
- The structured data is analyzed and processed in the following ways:
- Transactions are identified.
- Devices are automatically discovered and classified by their activity.
- Metrics are generated and associated with protocols and sources, and the metric data is then aggregated into metric cycles.
- As new metrics are generated and stored, and the datastore becomes full, the oldest existing metrics are overwritten according to the first-in first-out (FIFO) principle.
Flow data
A flow is a set of packets that are part of a single connection between two endpoints. Flow sensors are available for Reveal(x) 360 and offer continuous network visibility based on VPC flow logs to help secure AWS environments. VPC flow logs enable you to capture information about the IP traffic going to and from network interfaces in your VPC and are recorded as flow log records, which are log events that consist of fields that describe the traffic flow. This log data enables you to search for threats with advanced machine-learning detections.
Flow logs are ingested, deduplicated, and then grouped into flows. The flows are then enriched with data (such as MAC addresses) queried from AWS EC2 APIs.
The flows are then analyzed and processed in the following ways:
- Devices are automatically discovered and classified by their activity observed over specific ports.
- Basic L2-L4 metrics are generated and aggregated into metric cycles.
- ExFlow record types are generated and published.
Metrics, Records, and Packets
ExtraHop sensors collect and store multiple depths of network interaction as metrics. Metrics are aggregated observations about endpoint interactions over time. Packetstores collect and store the raw data transferred between two endpoints as packets. Recordstores collect and store records, which are structured information about transaction, message, and network flows.
You can view and query all of these interactions from individual sensors or from a console that is connected to a complex deployment of sensors, packetstores, and recordstores.
For example, when a client sends an HTTP request to a web server, here is what each data type contains:
- The packet contains the raw data that was sent and received in the interaction.
- The related record contains the time-stamped metadata about the interaction: when the request happened, the IP address of the client and server, the requested URI, any error messages.
- The related metric (HTTP Requests) contains an aggregate of that interaction with other observed interactions during the specified time period, such as how many requests occurred, how many of those requests were successful, how many clients sent requests, and how many servers received the requests.
Both metrics and records can be customized to extract and store specific metadata with JavaScript-based triggers. While the ExtraHop system has over 4600 built-in metrics, you might want to create a custom metric that collects and aggregates 404 errors from only critical web servers. And, you might want to maximize your record storage space by only collecting transactions that occurred over a suspicious port.
Device discovery
After a device is discovered, the ExtraHop system begins to collect metrics based on the analysis level configured for that device. You can Find a device by their MAC address, IP address, or name (such as a hostname observed from DNS traffic, NetBIOS name, Cisco Discovery Protocol (CDP) name, DHCP name, or a custom name that you assigned to the device).
The ExtraHop system can discover and track devices by their MAC address (L2 Discovery) or by their IP addresses (L3 Discovery). L2 Discovery offers the advantage of tracking metrics for a device even if the IP address is changed or reassigned through a DHCP request. By default, the ExtraHop system is configured for L2 Discovery.
Device IPv4 and IPv6 addresses are discovered from Address Resolution Protocol (ARP) messages, Neighbor Discovery Protocol (NDP) responses, local broadcasts, or local subnet multicast traffic. The MAC address and IP address for devices appear in search results throughout the system with the device information.
L2 Discovery
In L2 Discovery, the ExtraHop system creates a device entry for every local MAC address discovered over the wire. IP addresses are mapped to the MAC address, but metrics are stored with the device MAC address even if the IP address changes.
IP addresses observed outside of locally-monitored broadcast domains are aggregated at one of the incoming routers in your network. If a device sends a DHCP request through a router acting as a DHCP relay agent, the ExtraHop system detects and maps the IP address to the device MAC address. If the IP address changes for the device with a subsequent request through the DHCP relay agent, the ExtraHop system updates its mapping and continues to keep track of the device metrics by the MAC address.
Both MAC address and IP address are discovered for the remote device.
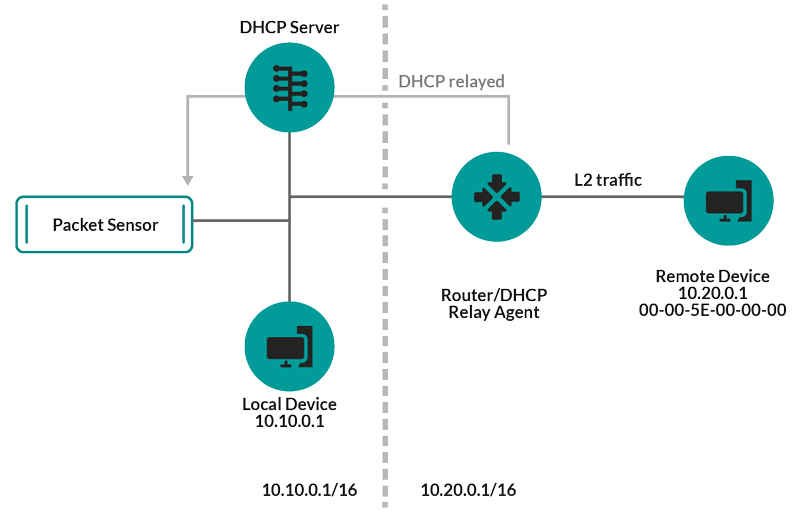
If a DHCP relay agent is not configured, remote devices can be discovered by their IP addresses through Remote L3 Discovery.
L3 Discovery
In L3 Discovery, the ExtraHop system creates and links two entries for each local discovered device: an L2 parent entry with a MAC address and an L3 child entry with IP addresses and the MAC address.
Here are some important considerations about L3 discovery:
- If a router has proxy ARP enabled, the ExtraHop system creates an L3 device for each IP address that the router answers ARP requests for.
- If you have a proxy ARP configured in your network, the ExtraHop system might automatically discover remote devices.
- L2 metrics that cannot be associated with a particular L3 child device (for example, L2 broadcast traffic) are associated with the L2 parent device.
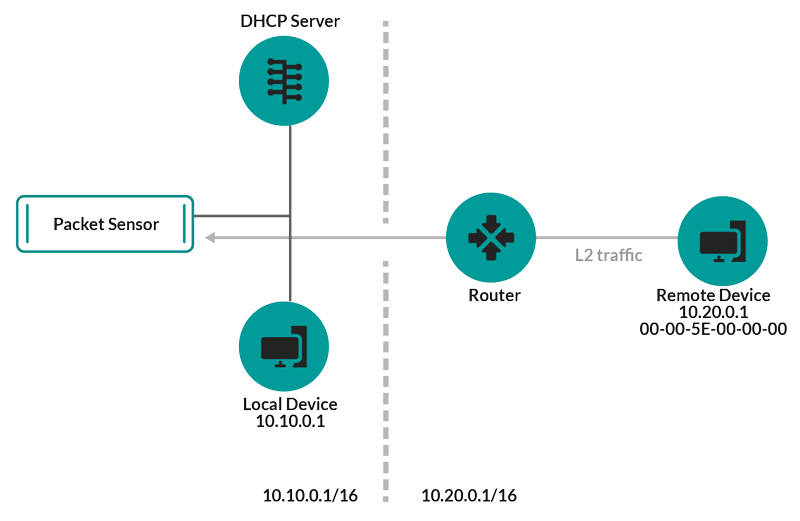
Remote L3 Discovery
If the ExtraHop system detects an IP address that does not have associated ARP or NDP traffic, that device is considered a remote device. Remote devices are not automatically discovered, but you can add a remote IP address range and discover devices that are outside of the local network. A device entry is created for each IP address that is observed within the remote IP address range. (Remote devices do not have L2 parent entries.)
Only the IP address is discovered for the remote device.
Here are some recommendations about when to configure Remote L3 Discovery:
- Your client devices are on a network segment that is not directly tapped.
- Your organization has a remote office without an on-site ExtraHop system but users at that site access central data center resources that are directly monitored by an ExtraHop system. The IP addresses at the remote site can be discovered as devices.
- A cloud service or other type of off-site service hosts your remote applications and has a known IP address range. The remote servers within this IP address range can be individually tracked.
VPN Discovery
VPN Discovery enables the ExtraHop system to correlate the private, RFC-1918 IP addresses assigned to VPN clients with their public, external IP addresses. This enriched visibility into north-south traffic reduces barriers when investigating security incidents and performance issues that involve external VPN clients. (This feature requires a VPN gateway that is manually assigned by the user.)Threat Detection
The ExtraHop system offers both machine-learning and rules-based detections that identify active or potential threats, network weaknesses that are vulnerable to exploits, and suboptimal configurations that can degrade network performance.
Additionally, charts, visualizations, and device activity maps enable proactive threat hunting.
Detection Tuning
Reduce noise and surface only critical detections by adding details about your network that help identify known parameters such as trusted domains and vulnerability scanners.Additionally, you can create tuning rules that hide specific detections or participants and further reduce unwanted noise.
Network Locality
By default, any device with an RFC1918 IP address (included in a 10/8, 172.16/12, or 192.168/16 CIDR block) is classified on the system as an internal device.However, because some network environments include non-RFC1918 IP addresses as part of their internal network, you can change the internal or external classification for IP addresses from the Network Localities page.
Threat Intelligence
The ExtraHop system includes curated threat intelligence feeds from ExtraHop and Crowdstrike Falcon that are updated through the cloud as new threats are discovered. You can also add threat collections from a third-party.Threat Briefings
Threat briefings provide information about imminent threats that are targeting networks. Updated detections, targeted record and packet queries, and affected devices are presented as a starting point for your investigation, accessed from the Security Overview page.Integrations
Reveal(x) 360 provides several third-party integrations that can enhance detection and response management and provide better visibility into network traffic.- Cortex XSOAR
- Export ExtraHop detections, run response playbooks, and query device details in Cortex XSOAR.
- CrowdStrike
- View details about CrowdStrike devices, and contain those devices from the ExtraHop system.
- CrowdStrike Falcon LogScale
- Specify filter criteria for ExtraHop security detections and export results to CrowdStrike Falcon LogScale.
- Microsoft 365
- Import Microsoft 365 detections and events, monitor Microsoft 365 metrics in built-in dashboards, and view risk event details in records.
- Microsoft Protocol Decryption
- Decrypt traffic over Microsoft protocols such as LDAP, RPC, SMB, and WSMan to improve detection of security attacks within your Microsoft Windows environment.
- QRadar
- Export and view ExtraHop detections in your QRadar SIEM.
- Splunk
- Export and view ExtraHop detections in your Splunk SIEM.
- Splunk SOAR
- Export and view ExtraHop detections, metrics, and packets in your Splunk SOAR solution.
Navigating the ExtraHop System
The ExtraHop system provides access to network activity data and detection details through a dynamic and highly customizable user interface.
| Video: | See the related training: Complete UI Fundamentals Learning Path |
Supported browsers
The following browsers are compatible with all ExtraHop systems. Apply the accessibility and compatibility features provided by your browser to access content through assistive technology tools.
- Firefox
- Google Chrome
- Microsoft Edge
- Safari
| Important: | Internet Explorer 11 is no longer supported. We recommend that you install the latest version of any supported browser. |
Layout and menus
Global navigation elements are located at the top of the page and contain links to the main sections of the system. Within each section, the left pane contains links to specific pages or data.
The following figure shows both global and left pane navigation elements.
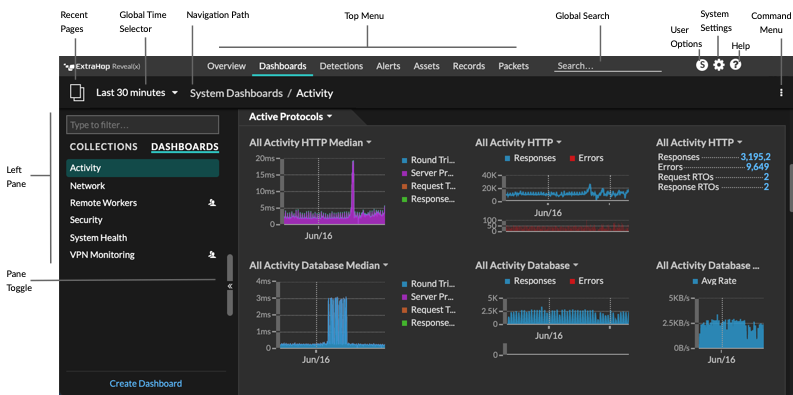
Here are definitions of each global navigation element:
- Overview pages
- Overview pages enable you to quickly evaluate the scope of suspicious activity on your
network, learn about protocol activity and device connections, and investigate inbound
and outbound traffic on your network.
- View the Security Overview for information about security detections on your network.
- View the Network Overview for information about active devices on your network.
- View the Perimeter Overview for information about traffic traveling in and out of your network.
- Dashboards
- Click Dashboards to view, create, or share dashboards for monitoring any aspect of your network or applications. System dashboards give you an instant view of the activity and potential security threats on your network.
- Alerts
- Click Alerts to view information about each alert generated during the time interval.
- Detections
- If your packet or flow sensor is connected to the ExtraHop Machine Learning Service,
the top level navigation shows the Detections menu. Click
Detections to view detections identified from your wire data.
You can access stored detections even if your sensor is disconnected from the Machine
Learning Service.
Note: Machine learning detections require a connection to ExtraHop Cloud Services. - Assets
- Click Assets to find any application, network, or device discovered by the ExtraHop system. You can view protocol metrics for your assets, active users, or network activity by protocol.
- Records
- If your ExtraHop system is configured with a recordstore, the top level navigation shows the Records menu. Click Records to query for all stored records for the current time interval. Records are structured information about transactions, messages, and network flows.
- Packets
- If your ExtraHop system is configured with a packetstore, the top level navigation shows the Packets menu. Click Packets to query for all stored packets for the current time interval.
- Global search field
- Type the name of any device hostname or IP address, application, or network to find a match on your sensor or console. If you have a connected recordstore, you can search for saved records. If you have a connected packetstore, you can search for packets.
- Help icon
- See help information for the page that you are currently viewing. To access the most current and comprehensive set of ExtraHop documentation, visit the ExtraHop Documentation website.
- System Settings icon
- Access system configuration options, such as Triggers, Alerts, Dashboard Reports, and Custom Devices, and click to view the ExtraHop system and version. Click System Notices to view a list of features in the most current version and any system notices such as expiring licenses or available firmware upgrades.
- User option icon
- Log in and log out of your sensor or console, change your password, select the display theme, set a language, and access API options.
- Pane toggle
- Collapse or expand the left pane.
- Global Time Selector
- Change the time interval to view application and network activity that was observed by the ExtraHop system for a specific time period. The global time interval is applied to all metrics across the system and does not change as you navigate to different pages.
- Recent pages
- See a list of the most recent pages you visited in a drop-down menu and make a selection to go back to a previous page. Repeated pages are deduplicated and condensed to save space.
- Navigation path
- View where you are in the system and click a page name in the path to navigate back to that page.
- Command menu drop-down
- Click to access specific actions for the page you are viewing. For example, when you
click Dashboards at the top of the page, the command menu
 provides actions for changing
dashboard properties or creating a new dashboard.
provides actions for changing
dashboard properties or creating a new dashboard.
Start analyzing data
Begin your data analysis journey with the ExtraHop system by following the basic workflows listed below. As you become familiar with the ExtraHop system, you can complete more advanced tasks, such as installing bundles and building triggers.
Here are some basic ways to navigate and work with the ExtraHop system to analyze network activity.
- Monitor metrics and investigate interesting data
- Good starting points are the Network Activity dashboard and Network Performance dashboard, which show
you summaries of important metrics about application performance on your network. When
you see a spike in traffic, errors, or server processing time, you can interact with
dashboard data to drill down and identify which clients, servers,
methods, or other factors contributed to the unusual activity.
You can then continue performance monitoring or troubleshooting by creating a custom dashboard to track a set of interesting metrics and devices.
Check out the following walkthroughs to learn more about monitoring data in dashboards:
- Search for a specific device and investigate related metrics and transactions
- If you want to investigate a slow server, you can search for the server in the ExtraHop system by device name or IP
address and then investigate the server's activity on a protocol page. Was
there a spike in response errors or requests? Was server processing time too high or did
network latency affect the rate of data transfer? Click on different protocols on the
Devices page to investigate more metric data collected by the ExtraHop system. Drill down by
peer IP addresses to see which clients or applications the server talked to.
If your ExtraHop system is connected to a recordstore, you can investigate entire transactions that the server participated in by creating a record query.
Check out the following walkthroughs to learn more about exploring metrics and records:
- Get visibility into changes to your network by searching for protocol activity
- You can get a top-down view of your network by looking at built-in protocol groups. An
protocol group is a collection of devices automatically grouped together by the ExtraHop
system based on the protocol traffic observed over the wire. For example, you can find
new or decommissioned servers that are actively communicating over a protocol by creating an activity
map.
If you find a collection of devices that you want to continue monitoring, you can add a device tag or custom device name to make those devices easier to find in the ExtraHop system. You can also create a custom device group or a custom dashboard to monitor device group activity.
Advanced workflows for customizing your ExtraHop system
After becoming familiar with basic workflows, you can customize your ExtraHop system by setting up alert notifications, creating custom metrics, or installing bundles.
- Set up alerts
- Alerts track specified metrics to notify you of traffic deviations that might indicate an issue with a network device. Configure a threshold alert to notify you when a monitored metric crosses a defined value. Configure a trend alert to notify you when a monitored metric deviates from the normal trends observed by the system.
- Build a trigger to create custom metrics and applications
- Triggers are custom scripts
that perform an action upon a pre-defined event. Triggers require planning to make sure
a trigger doesn't negatively impact system performance.
Check out the following walkthroughs to learn more about exploring metrics and records:
Time intervals
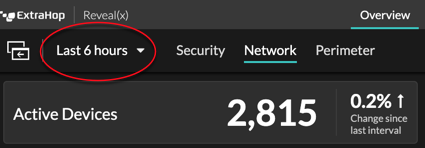
The Time Selector is displayed in the top-left corner of the navigation bar and controls the global time interval for metrics and detections displayed in the ExtraHop system.
Here are some considerations about time intervals:
- The Time Selector enables you to select a relative global time interval, such as the last day, or set a custom time range.
- The Time Selector enables you to manually change your displayed time zone.
- The selected time interval stays the same, whether viewing metrics in a dashboard or investigating detections, until you change the interval or navigate to a page with a preset time interval, such as detection details or threat briefings.
- If a relative time interval is selected when you log out, the ExtraHop system defaults to that relative time interval when you log back in.
- If a custom time range is selected when you log out, the ExtraHop system defaults to the last relative time interval you viewed during the previous login session.
- You can access the five most recent unique time intervals from the History tab of the Time Selector.
- The time interval is included at the end of the URL in your browser. To share a link with others that maintains a specific time interval, copy the entire URL. To maintain a specific time interval after logging out of the ExtraHop system, bookmark the URL.
Change the time interval
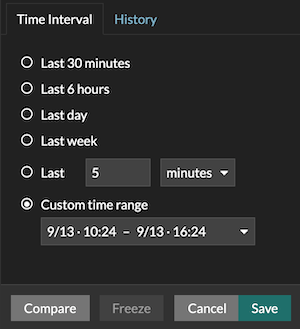
- Click the time interval in the upper left corner of the page (for example Last 30 minutes).
-
Select from the following interval options:
- A preset time interval (such as Last 30 minutes, Last 6 hours, Last day, or Last week).
- A custom unit of time.
- A custom time range. Click a day to specify the start date for the range. One click will specify a single day. Clicking another day will specify the end date for the range.
- Compare metric deltas from two different time intervals.
- Click Save.
| Tip: | You can also set the time interval from the History tab by selecting from up to five recent time intervals set in a previous login session. |
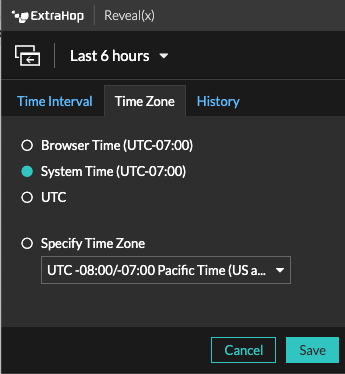
Change the displayed time zone
The Time Selector enables you to change the time zone displayed in the the ExtraHop system, providing more flexibility when viewing time-based data such as metrics, detections, and records in environments that span multiple time zones.
Here are some considerations about displaying time settings in Reveal(x) 360:
- Changing your displayed time zone affects the date and time stamps you see in the ExtraHop system, but does not apply to scheduled dashboard reports or exported dashboards.
- Changing your time zone overrides the default display time configured in the Administration settings. See System Time (for ExtraHop Performance and Reveal(x) Enterprise) or Configure the system time (for Reveal(x) 360) for more information.
- Log in to the ExtraHop system through https://<extrahop-hostname-or-IP-address>.
- Click the Time Selector in the upper left corner of the page.
- Click Time Zone.
-
Select one of the following options:
- Browser Time
- System Time
- UTC
- Specify Time Zone and then select a time zone from the drop-down list.
- Click Save.
View the latest data for a time interval
Pages that display monitored metric data, such as dashboards and protocol pages, are continuously updated to display the latest data for the selected time interval.
Detail metrics pages, detections, records, packets, and alerts are reloaded on request by
clicking the refresh data icon at the top left corner of the page. 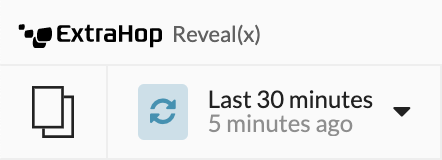
Change chart data granularity
The ExtraHop system stores metrics in 30-second buckets of time. Metric data are then aggregated or rolled up into additional five-minute and one-hour buckets. Aggregating data helps to limit the number of data points rendered on a time-series chart so the granularity of data is easier to interpret. The time interval you select determines the best aggregation, or roll up, of data to display in a chart for the period of time you are viewing.
For example, if you select a large time interval, such as one week, metric data is aggregated into one-hour roll ups. On the x-axis of a line chart, you see a data point for every hour instead of a data point for every 30 seconds. If you want to increase the level of granularity, you can zoom in on a chart or change the time interval.
The ExtraHop system includes built-in high-precision metrics with 1-second roll ups, which are the Network Bytes and Network Packets metrics. These metrics are associated with a device or network capture source. For more information on how to view these metrics in a chart, see Display the maximum rate in a chart.
The ExtraHop system also includes built-in metrics for identifying the single busiest millisecond of traffic within a 1-second roll up. These metrics, which are Maximum Network Bytes per Millisecond and Maximum Packets per Millisecond, are associated with a network capture source and help you detect microbursts. Microbursts are rapid bursts of traffic that occur within milliseconds.
The following table provides information about how data is aggregated based on time interval.
| Time Interval | Aggregation Roll Up (if available) | Notes |
|---|---|---|
| Less than six minutes | 1-second | A 1-second roll up is only available for custom metrics and for the following
built-in metrics:
|
| 120 minutes or less | 30-second | If a 30-second roll up is not available, a 5-minute or 60-minute roll up displays. |
| Between 121 minutes and 24 hours | 5-minute | If 5-minute roll up is not available, a 60-minute roll up displays. |
| Greater than 24 hours | 60-minute | – |
| Note: | If you have an extended datastore that is configured for 24-hour metrics, a specified time interval of 30 days or longer displays a 24-hour aggregation roll up. |
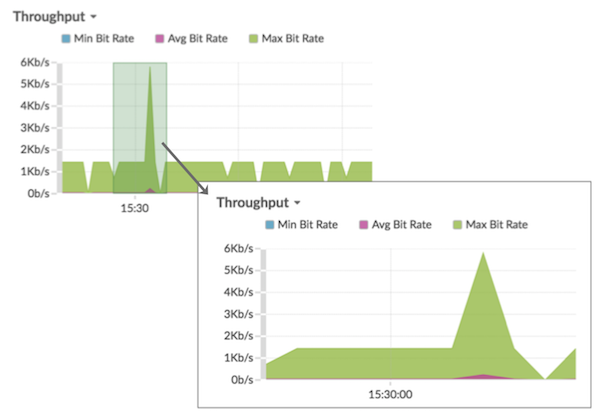
Zoom in on a custom time range
You can click-and-drag across a chart to zoom in on interesting metric activity. This custom time range is then applied across the ExtraHop system, which is useful for investigating other metric activity that occurred at the same time.
Zooming in on a time range is only available in charts with an x- and y-axis, such as line, area, candlestick, and histogram charts.
-
Release the mouse button. The chart is redrawn to the custom time range and the
time interval in the upper right corner of the navigation bar is updated.
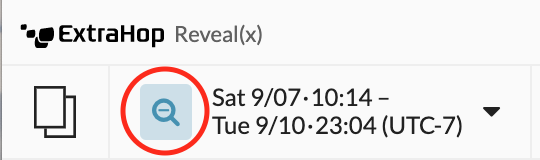
-
To revert from the custom time interval to your original time interval, click
the undo icon—a magnifying glass with a minus sign—which is displayed next to
the time interval in the upper right corner of the navigation bar.
Tip: On a dashboard page, you can limit the zoom-in custom time range to a specific region. Click the region header, select Use Region Time Selector, and then zoom in on a chart. Each chart or widget within that region is updated to the custom time range.
Freeze the time interval to create a custom time range
If you see interesting data in an activity map, dashboard, or protocol page, you can freeze the time interval to instantly create a custom time range. Freezing the time interval is useful for creating links that you can share with others, and for investigating related metric activity that occurred at the same time.
-
Click Freeze.
The Custom time range automatically updates as shown in the figure below. The range begins with the earliest time from the previous time interval and ends with the time that you clicked Freeze.
Overview pages
Overview pages enable you to quickly evaluate the scope of suspicious activity on your network, learn about protocol activity and device connections, and investigate inbound and outbound traffic on your network.
- View the Security Overview for information about security detections on your network.
- View the Network Overview for information about active devices on your network.
- View the Perimeter Overview for information about traffic traveling in and out of your network.
Security Overview
The Security Overview displays several charts that highlight data from different perspectives about detections. These charts can help you evaluate the scope of security risks, launch investigations into unusual activity, and mitigate security threats. Detections are analyzed every 30 seconds or every hour, depending on the metric.
| Video: | See the related training: Security, Network, and Perimeter Overview |
- Recommended for Triage
- This chart shows you a list of detections that ExtraHop is recommending based on contextual analysis of your environment. Click a detection to view the detection card in Triage view on the Detections page.
- Detection Types
- This chart shows you the number of distinct detection types that occurred in the Attack, Hardening, and Operations categories during the selected time interval. By changing the time interval, you can see how many detection types occurred during that time. Click a number to open the Detections page filtered to show detections for each type in the selected detection category.
- Detections by Attack Category
- This chart provides a quick way to see the types of attacks your network might be at risk for and displays the number of detections that occurred in each category during the selected time interval. Actions on Objective detections are listed by type to help you prioritize the most severe detections. Click any number to open a filtered view of detections that match the selected attack category.
- Frequent Offenders
- This chart shows the 20 devices or endpoints that acted as offenders in one or more
detections. The ExtraHop system considers the number of distinct attack categories and
detection types and the risk scores of the detections associated with each device to
determine which devices are considered frequent offenders.
The size of the device role icon indicates the number of distinct detection types and the position of the icon indicates the number of distinct attack categories. Click a role icon to view more information about the attack categories and detection types associated with the device. Click the device name to view device properties.
Learn more about network security with the Security Hardening dashboard.
Threat briefings
Threat briefings provide cloud-updated guidance about industry-wide security events. Learn more about threat briefings.
Site selector and executive report
You can specify the sites you want to view data from on this page. Users with NDR module access can generate an executive report to share results.
- Site Selector
- Click the site selector at the top of the page to view data for one or more sites in your environment. View combined traffic across your networks or focus on a single site to help you quickly find device data. The site selector indicates when all or some sites are offline. Because data is not available from offline sites, the charts and device pages associated with offline sites might not show data or might only show limited data. The site selector is only available from a console.
- (NDR module only) Executive Report
- Click Generate Executive Report to create a PDF file. The Executive Report provides a summary of the top detections and risks to your network from the last week. The Executive Report only includes information for the selected sites.
Network Overview
The Network Overview displays a map of the detections on your network and a list of offenders by detection count. The Network Overview refreshes the detection map and offender data every minute.
| Video: | See the related training: Security, Network, and Perimeter Overview |
- Detection category toggle
- You can toggle between views that show All Attack Detections or All Performance Detections, depending on enabled modules and your module access.
Offenders in detections
This list shows offenders, sorted by the number of detections where the device or endpoint acted as an offender.
- Click a device or endpoint in the list to highlight associated detections in the detection map and view device properties and access links to endpoint lookup sites, detections, records, or packets.
- Depending on the selected detection category and your system module, click the View All Attack Detections or View All Performance Detections link to go to the Detections page, filtered by detection category and grouped by source.
- Select the Show detections with no victims checkbox to display detections that do not include a victim participant. For example SSL/TLS Scans and certain caution detections for suspicious activity only include an offender.
Detection map
The detection map displays the offender and victim for all detections selected in the detection category toggle.
Circles are highlighted in red if the device has appeared as an offender in at least one detection during the selected time interval and are highlighted in teal if the device is a victim.
The participants are connected by lines that are labeled with the detection type or number of detections associated with the connection, and device roles are represented by an icon.
- Click a circle to view device properties and access links to endpoint lookup sites, detections, records, or packets.
- Click a connection to view associated detections.
- Hover over a circle to see device labels and highlight device connections.
Learn more about Detections.
Site selector and executive report
You can specify the sites you want to view data from on this page. Users with NDR module access can generate an executive report to share results.
- Site Selector
- Click the site selector at the top of the page to view data for one or more sites in your environment. View combined traffic across your networks or focus on a single site to help you quickly find device data. The site selector indicates when all or some sites are offline. Because data is not available from offline sites, the charts and device pages associated with offline sites might not show data or might only show limited data. The site selector is only available from a console.
- (NDR module only) Executive Report
- Click Generate Executive Report to create a PDF file. The Executive Report provides a summary of the top detections and risks to your network from the last week. The Executive Report only includes information for the selected sites.
Perimeter Overview
The Perimeter Overview displays charts and interactive visualizations that help you monitor traffic that is entering and leaving your network through connections with external endpoints.
| Video: | See the related training: Security, Network, and Perimeter Overview |
Perimeter Traffic
The Perimeter Traffic charts provide an overview of device traffic with external connections.
- Inbound Traffic
- This count shows the total amount of inbound traffic during the selected time interval. Click the count to view the rate that data is moving inbound from external endpoints and drill down by site or conversation.
- Outbound Traffic
- This count shows the total amount of outbound traffic during the selected time interval. Click the count to view the rate that data is moving outbound to external endpoints and drill down by site or conversation.
- Devices Accepting Inbound Connections
- This count displays the number of devices that accepted inbound connections from external endpoints during the selected time interval. Click the count to open a device group overview page that displays a list of devices, traffic data, and protocol activity.
- Inbound Connections
- This count displays the number of inbound connections that were initiated by external endpoints. Click the count to open a detailed view of these conversations.
- Suspicious Inbound Connections
- This count chart displays the number of connections that were initiated by suspicious external endpoints. ExtraHop identifies suspicious endpoints through threat intelligence data. Click the chart to open a filtered view of these conversations.
- Suspicious Outbound Connections
- This count displays the number of connections that internal endpoints initiated with suspicious external endpoints. ExtraHop identifies suspicious endpoints through threat intelligence data. Click the chart to open a filtered view of these conversations.
- Uncommon Connections
- (Reveal(x) 360 only) This count displays the number of outbound connections from your network to IP addresses that are not normally visited or have not been visited in the past. Click the chart to open a filtered view of these conversations.
Halo visualization
The halo visualization provides two views of your network connections to external endpoints: Cloud Services and Large Uploads.
External endpoints appear on the outer ring with connections to internal endpoints and appear as circles in the middle of the visualization. These visualizations enable you to prioritize your investigation for connections marked with high-risk detections or for high value devices.
To help identify high-traffic endpoints, inner circles and outer rings increase in size as traffic volume increases. In some cases, the size of inner circles and outer ring segments might be increased for readability. Click an endpoint to display precise traffic information.
Click Cloud Services to view connections between internal endpoints and cloud service providers. Cloud service providers and the amount of sent or received data appear in the information panel to the right. You can toggle between views that show Bytes Out to providers and Bytes In to your network.
Click Large Uploads to view connections between internal and external endpoints where over 1 MB of data was transferred in a single transmission out of your network to an external endpoint. External endpoints and the amount of uploaded data appear in the information panel to the right.
- Hover over endpoints or connections to view available hostnames and IP addresses.
- Hover over endpoints or connections to highlight corresponding list items to the right. Likewise, hover over list items to highlight corresponding endpoints and connections in the halo visualization.
- Click endpoints or connections in the halo visualization to hold focus and display precise traffic information and links for your selection to the right.
- Click an external endpoint in the halo visualization or list to view the total amount of inbound or outbound traffic associated with the endpoint and connected internal endpoints.
- Click an internal endpoint in the list to view device properties and access links to associated information such as detections, records, or packets.
- Click the magnifying glass next to an endpoint in the list to view records associated with the endpoint.
- At the bottom of the list for cloud services, toggle between views that show Bytes Out and Bytes In to your network.
- Adjust the time interval to view connections at specified times, such as unexpected activity during evenings or weekends.
Map visualization
The Geolocation tab provides a world map of traffic between internal endpoints and geographic locations, which are highlighted in a contrasting color on the map. The intensity of the contrasting color represents the amount of traffic at that geolocation. Geolocations represented on the map are also listed in the right pane.
Click a highlighted geolocation from the map or the list to view the total amount of inbound or outbound traffic associated with connected internal endpoints.
Here are some ways that you can interact with the geolocation details and the map visualization:
- Click an internal endpoint in the list to view device properties and access links to associated information such as detections, records, or packets.
- Click the magnifying glass next to an endpoint in the list to view records associated with the endpoint.
- At the bottom of the list, toggle between views that show Bytes Out and Bytes In to your network.
- Click the controls located in the bottom right corner of the map to zoom in and out or return the map to the original position, or you can rotate your mouse wheel.
- Click and drag your mouse on the map or press the arrow keys on your keyboard to reposition the map view.
- Adjust the time interval to view traffic at specified times, such as unexpected activity during evenings or weekends.
Site selector and executive report
You can specify the sites you want to view data from on this page. Users with NDR module access can generate an executive report to share results.
- Site Selector
- Click the site selector at the top of the page to view data for one or more sites in your environment. View combined traffic across your networks or focus on a single site to help you quickly find device data. The site selector indicates when all or some sites are offline. Because data is not available from offline sites, the charts and device pages associated with offline sites might not show data or might only show limited data. The site selector is only available from a console.
- (NDR module only) Executive Report
- Click Generate Executive Report to create a PDF file. The Executive Report provides a summary of the top detections and risks to your network from the last week. The Executive Report only includes information for the selected sites.
Dashboards
Dashboards are an effective tool for monitoring high-priority network traffic or troubleshooting issues because they consolidate multiple metric charts into a central location where you can investigate and share data. You can also add text boxes, formatted through Markdown, to provide content for stakeholders.
| Video: | See the related training: Dashboard Concepts |
Dashboards and collections are located in the dashboard dock.
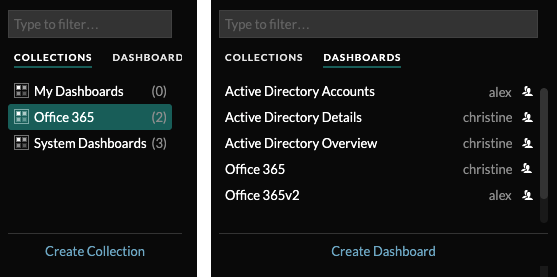
Click Collections to display all of the dashboard collections you own or that have been shared with you. The number of dashboards in each collection is displayed. Click the collection name to view the owner, who the collection is shared with, and the list of dashboards in the collection.
Only the collection owner can modify or delete a collection. However, because dashboards can be added to multiple collections, you can create a collection and share it with other users and groups.
Click Dashboards to display an alphabetized list of all of the dashboards that you own or that have been shared with you, including dashboards shared through a collection. The owner of each dashboard is displayed. An icon next to the owner name indicates that the dashboard was shared with you.
Creating dashboards
If you want to monitor specific metrics or custom metrics, you can create a custom dashboard. You must have personal write privileges or higher and NPM module access to create and edit dashboards.
Custom dashboards are stored separately for each user that accesses the ExtraHop system. After you build a custom dashboard, you can share it with other ExtraHop users.
There are several ways to create your own dashboard:
- Create a custom dashboard or create a dashboard with dynamic sources from scratch
- Copy an existing dashboard, and then customize it
- Copy an existing chart, and then save it to a new dashboard
New dashboards are opened in Edit Layout mode, which enables you to add, arrange, and delete components within the dashboard. After creating a dashboard, you can complete the following tasks:
Click the command menu ![]() in
the upper right corner of the page to edit the dashboard properties or delete the
dashboard.
in
the upper right corner of the page to edit the dashboard properties or delete the
dashboard.
| Note: | You cannot recover a deleted dashboard. When deleting user accounts, ExtraHop administrators can transfer dashboard ownership to another system user. Otherwise, all custom dashboards associated with the user account are also deleted. To preserve dashboards, make a copy before the account is deleted. |
Learn how to monitor your network by completing a dashboard walkthrough.
Viewing dashboards
Dashboards are composed of chart widgets, alert widgets, and text box widgets that can present a concise view about critical systems or about systems managed by a particular team.
Click within a chart to interact with the metric data:
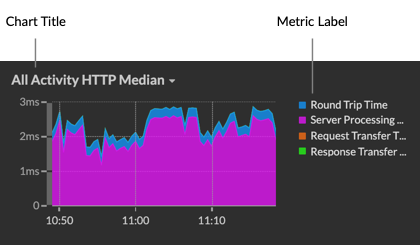
- Click a chart title to view a list of metric sources and menu options.
- Click a metric label to drill down and investigate by a metric detail.
- Click a metric label and click Hold Focus to display only that metric in the chart.
- Click a chart title or a metric label and then click Description to learn about the source metric.
- Click a detection marker to navigate to the detection detail page
Change the time selector to observe data changes over time:
Export and share dashboard data
By default, all custom dashboards are private and no other ExtraHop users can view or edit your dashboard.
Share your dashboard to grant view or edit permission to other ExtraHop users and groups, or share a collection to grant view-only permission to multiple dashboards.
You can only modify a shared dashboard if the owner granted you edit permission. However, you can copy and customize a shared dashboard without edit permission.
Export data by individual chart or by the entire dashboard:
- To export individual chart data, click the chart title and select one of the following options from the drop-down menu: Export to CSV or Export to Excel.
- To present or export the entire dashboard, click the command menu in the
upper right corner of the page and select one of the following
options: Presentation
Mode, Export to PDF or Scheduled
Reports (consoles only).
System dashboards
The ExtraHop system provides the following built-in dashboards that display common protocol activity about the general behavior and health of your network.
System dashboards are located in the default System Dashboards collection in the dashboard dock and they cannot be added to another collection that is shared with other users.
System dashboards can be viewed by any user except for restricted users The System Usage dashboard can only be viewed by users with System and Access Administration privileges.
- Network Activity dashboard (NPM module access required)
- Find top-talkers by application (L7) protocols and view recent alerts. For more information about charts in this dashboard, see Network Activity dashboard.
- Network Performance dashboard (NPM module access required)
- Identify traffic latency and bottlenecks over the data link (L2), network (L3), and transport (L4) layers. For more information about charts in this dashboard, see Network Performance dashboard.
- Security Hardening dashboard (NDR module access required)
- Monitor general information about potential security threats on your network. For more information about charts in this dashboard, see Security Hardening dashboard.
- Generative AI Tools dashboard
- Check for OpenAI traffic on your network and from internal endpoints communicating over OpenAI. For more information about charts in this dashboard, see Generative AI Tools dashboard.
- Active Directory dashboard
- Track Kerberos server activity for Active Directory user and computer accounts as well as services such as global catalog and group policies. For more information about charts in this dashboard, see Active Directory dashboard.
- System Health dashboard
- Ensure that your ExtraHop system is running as expected, troubleshoot issues, and assess areas that are affecting performance. For more information about charts in this dashboard, see System Health dashboard.
- System Usage dashboard (System and access administration privileges required)
- Monitor how users are interacting with detections, investigations, and dashboards in the ExtraHop system. For more information about charts in this dashboard, see System Usage dashboard.
Network Activity dashboard
The Network Activity dashboard enables you to monitor general information about application activity and performance from the transport through the application layers (L4 - L7) on your network.
Each chart in the Network Activity dashboard contains visualizations of network and protocol metric data that have been generated over the selected time interval, organized by region.
| Note: | From a console, you can display the Network Activity dashboard for each connected site. The site name appears in the navigation bar; click the down arrow next to the name to pivot the display to other sites. |
The Network Activity dashboard is a built-in, system dashboard that you cannot edit, delete, or add to a shared collection. However, you can copy a chart from the Network Activity dashboard and add it to a custom dashboard, or you can make a copy of the dashboard and edit it to monitor metrics that are relevant to you.
The following information summarizes each region and its charts.
- Traffic Overview
- Observe whether traffic bottlenecks are related to a specific application protocol or
network latency. The Traffic Overview region contains the following charts:
Network Packets by L7 Protocol Avg Rate chart: Find the protocol that has the highest volume of packet transmissions over the application layer (L7) during the selected time interval.
All Activity Network Round Trip Time: The 95th percentile line shows you the upper range of the time that it took for packets to traverse the network. If this value is over 250ms, then network issues could be slowing down application performance. Round trip time is a measurement of the time between when a client or server sent a packet and received an acknowledgment.
Alerts: View up to 40 of the latest alerts that were generated, and their severity levels. Alerts are user-configured conditions that establish baseline values for specific protocol metrics.
- Active Protocols
-
Observe how application performance is affected by the protocols that are actively communicating on the ExtraHop system. For example, you can quickly glance at charts that display server processing times and the ratio of errors to responses per protocol.
There is a chart for each active protocol. If you do not see a protocol you were expecting, applications might be not communicating over that protocol for the selected time interval.
-
For more information about protocols and to view metric definitions, see the ExtraHop Protocol Metrics Reference.
Network Performance dashboard
The Network Performance dashboard enables you to monitor how effectively data is transmitted over the data link, network, and transport (L2 - L4) layers.
Each chart in the Network Performance dashboard contains visualizations of network performance data that have been generated over the selected time interval, organized by region.
| Note: | From a console, you can display the Network Performance dashboard for each connected site. The site name appears in the navigation bar; click the down arrow next to the name to pivot the display to other sites. |
The Network Performance dashboard is a built-in, system dashboard that you cannot edit, delete, or add to a shared collection. However, you can copy a chart from the Network Performance dashboard and add the chart to a custom dashboard, or you can make a copy of the dashboard and edit the dashboard to monitor metrics that are relevant to you.
The following information summarizes each region.
- Network L2 Metrics
- Monitor the throughput rates over the data link (L2) layer by bits and packets, and monitor the types of frames transmitted. You can also determine how much data is sent to receivers by unicast, broadcast, or multicast distribution.
- Network L4 Metrics
- Monitor data transfer latency over the transport layer (L4). View TCP activity through connection, request, and response metrics. This data can indicate how effectively data is sent and received across the transport layer in your network.
- Network Performance
- Monitor how network performance is affecting applications. View overall network throughput by reviewing the throughput per application protocol and the magnitude of high TCP round trip times.
- Network L3 Metrics
- View data throughput at the network layer (L3) and see packets and traffic by TCP/IP protocols.
- DSCP
- View a breakdown of packets and traffic by Differentiated Services code points, which is part of the DiffServ network architecture. Every IP packet contains a field to express the priority of how the packet should be handled, which is called differentiated services. The values for the priorities are called code points.
- Multicast Groups
- View traffic that is sent to multiple receivers in a single transmission, and see packets and traffic by each receiver group. Multicast traffic on a network is organized into groups based on destination addresses.
Security Hardening dashboard
The Security Hardening dashboard enables you to monitor general information about potential security threats on your network.
| Video: | See the related training: Security Dashboard |
| Note: | From a console, you can display the Security Hardening dashboard for each packet sensor. Click down arrow next to the name of the sensor in the navigation bar to display the Security Hardening dashboard for other sensors. |
The Security Hardening dashboard is a built-in, system dashboard that you cannot edit, delete, or add to a shared collection. However, you can copy a chart from the Security Hardening dashboard and add it to a custom dashboard, or you can make a copy of the dashboard and edit it to monitor metrics that are relevant to you.
The following information summarizes each region and its charts.
- Threat Intelligence
- Observe the number of connections and transactions that contain suspicious hostnames, IP
addresses, or URIs found in threat
intelligence. Click a blue metric value or metric name in the legend to drill
down on a suspicious metric. A detail page appears that displays a red camera icon
 next to the suspicious object. Click
the red camera icon to learn about the threat intelligence source.
next to the suspicious object. Click
the red camera icon to learn about the threat intelligence source.Note: Threat intelligence metrics display a zero value for one or more of the following reasons: - Your ExtraHop Reveal(x) subscription does not include threat intelligence.
- You have not enabled threat intelligence for your ExtraHop Reveal(x) system.
- You have not directly uploaded custom threat collections to your sensors. Contact ExtraHop Support for help uploading a custom threat collection to you ExtraHop-managed sensors.
- No suspicious objects were found.
- SSL - Sessions
- Observe the number of active SSL sessions with weak cipher suites on your network. You
can see which clients and servers are participating in those sessions along with which
cipher suites those sessions are encrypted with. DES, 3DES, MD5, RC4, null, anonymous, and
export cipher suites are considered to be weak because they include an encryption
algorithm that is known to be vulnerable. Data encrypted with a weak cipher suite is
potentially insecure.
You can also observe the number of SSL sessions established with TLS v1.0 and which clients are participating in those sessions. Known vulnerabilities are associated with TLS v1.0. If you have a high number of TLS v1.0 sessions, consider configuring servers to support the latest version of TLS.
- SSL - Certificates
- Observe which SSL certificates in your network are self-signed, wildcard, expired, and
expiring soon. Self-signed certificates are signed by the entity that issues the
certificate, rather than a trusted certificate authority. Although self-signed
certificates are cheaper than certificates issued by a certificate authority, they are
also vulnerable to man-in-the-middle attacks.
A wildcard certificate applies to all first-level subdomains of a given domain name. For example, the wildcard certificate *.company.com secures www.company.com, docs.company.com, and customer.company.com. Although wildcard certificates are cheaper than individual certificates, wildcard certificates create a greater risk if they are compromised because they can apply to any number of domains.
- Vulnerability Scans
- Observe which devices are scanning applications and systems on your network to search for weaknesses and potential targets, such as high value devices. In the left chart, you can identify which devices are sending the most scan requests, which are HTTP requests associated with known scanner activity. In the right chart, you can see which user-agents are associated with the scan requests. The user-agent can help you determine if scan requests are associated with known vulnerability scanners such as Nessus and Qualys.
- DNS
- Observe which DNS servers are most active on your network and the total number of
reverse DNS lookup failures those servers have encountered. A reverse DNS lookup failure
occurs when a server issues an error in response to a client request for a pointer (PTR)
record. Failures in reverse DNS lookups are normal, but a sudden or steady increase in
failures on a specific host might indicate that an attacker is scanning your
network.
You can also observe the number of address mapping and text record queries on your network. A large or sudden increase in these types of queries can be an indicator of a potential DNS tunnel.
Generative AI Tools dashboard
The Generative AI dashboard enables you to monitor traffic from OpenAI tools on your network.
Each chart in the Generative AI Tools dashboard contains visualizations of traffic associated with the OpenAI cloud service for tools such as ChatGPT. View traffic that was generated during a selected time interval, organized by region.
| Note: | From a console, you can display the Generative AI Tools dashboard for each connected site. The site name appears in the navigation bar; click the down arrow next to the name to pivot the display to other sites. |
The Generative AI Tools dashboard is a built-in, system dashboard, and you cannot edit, delete, or add system dashboards to a collection. However, you can copy a chart from the Generative AI Tools dashboard and add the chart to a custom dashboard, or you can make a copy of the dashboard and edit the dashboard to monitor metrics that are relevant to you.
The following information summarizes each region and its charts.
- Generative AI Tools
- Monitor traffic to OpenAI-based tools observed on your network. Learn when traffic occurred, how much data was transferred, and which internal endpoints participated.
Active Directory dashboard
The Active Directory dashboard enables you to track Kerberos server activity for Active Directory user and computer accounts as well as services such as global catalog and group policies.
Each chart in the Active Directory dashboard contains visualizations of of Active Directory account data that have been generated over the selected time interval, organized by region.
The Active Directory dashboard is a built-in, system dashboard that you cannot edit, delete, or add to a shared collection. However, you can copy a chart from the Active Directory dashboard and add it to a custom dashboard, or you can make a copy of the dashboard and edit it to monitor metrics that are relevant to you.
| Note: | From a console, you can display the Active Directory dashboard for each connected site. The site name appears in the navigation bar; click the down arrow next to the name to pivot the display to other sites. |
The following information summarizes each region and its charts.
- Account Summary
- Observe the number of Active Directory accounts in your environment in the
following charts:
Total Accounts: Total number of user accounts and of computer accounts.
Privileged Accounts: Total number of privileged accounts that successfully logged in, that received a login error, and that sent a service access request.
- Authentication Errors
- Observe the number of Active Directory accounts with authentication errors in
the following charts:
User Account Errors: Total number of user account login errors due to invalid passwords, expired passwords, and disabled accounts. Displayed as a line chart and a list chart.
Computer Account Errors: Total number of computer account login errors due to invalid passwords, expired passwords, and disabled accounts. Displayed as a line chart and a list chart.
Account Errors: Total number of errors for any account type due to account lockouts and due to time errors. Displayed as a line chart and a list chart.
- Authentication Error Details
- Observe details about Active Directory accounts that had authentication errors
in the following charts:
User Accounts: Usernames associated with user accounts that failed to login. This chart also displays the number of times each user account received an error due to an invalid password or an expired account.
Computer Accounts: Client IP addresses and hostnames associated with user accounts that failed to login. This chart also displays the number of times each user account received an error due to an invalid password or an expired account.
- Ticket Granting Service
- Observe transaction data associated with the Kerberos ticket granting service in
the following charts:
Transactions: Total number of service ticket requests and the number of unknown service principal name (SPN) errors.
Transactions: Total number of service ticket requests.
Unknown SPN Errors by SPN: Number of unknown SPN errors listed by the SPN that sent the error.
Unknown SPN Errors by Client: Number of unknown SPN errors listed by the client that received the error.
Total Unknown SPN Errors: Total number of unknown SPN errors.
- Group Policy
- Observe CIFS/SMB transaction data associated with the group policy in the
following charts:
Transactions: Total number of group policy responses and of group policy errors.
Transactions: Total number of group policy responses and of group policy errors, in addition to the server processing time taken to send the first packet in response after receiving the last packet of the group policy request.
- LDAP
- Observe LDAP transaction data with the following charts:
Transactions: Total number of LDAP responses and errors.
Transactions: Total number of LDAP responses and errors, in addition to the server processing time taken to send the first packet in response after receiving the last packet of the request.
Insecure LDAP Credentials: Total number of plaintext bind requests. Displayed as a line chart and a list chart.
- Global Catalog
- Observe transaction data associated with the global catalog in the following
charts:
Transactions: Total number of global catalog responses and errors.
Transactions: Total number of global catalog responses and errors, in addition to the server processing time taken to send the first packet in response after receiving the last packet of the global catalog request.
- DNS Service Records
- Observe DNS service record transaction data in the following charts:
Transactions: Total number of service record responses and errors.
Transactions: Total number of service record responses and errors, in addition to the server processing time taken to send the first packet in response after receiving the last packet of the request.
System Health dashboard
The System Health dashboard provides a large collection of charts that enable you to make sure that your ExtraHop system is running as expected, to troubleshoot issues, and to assess areas that are affecting performance. For example, you can monitor the number of packets processed by the ExtraHop system to ensure that packets are continuously captured.
Each chart in the Network Performance dashboard contains visualizations of system performance data that have been generated over the selected time interval, organized by region.
The System Health dashboard is a built-in, system dashboard that you cannot edit, delete, or add to a shared collection. However, you can copy a chart from the System Health dashboard and add it to a custom dashboard, or you can make a copy of the dashboard and edit it to monitor metrics that are relevant to you.
| Note: | The Administration settings page also provides status information and diagnostic tools for all ExtraHop systems. |
Navigate the System Health dashboard
Access the System Health page by clicking the System Settings icon ![]() or by clicking
Dashboards from the top of the page. The System Health dashboard
automatically displays information about the ExtraHop system you are connected to. If you
are viewing the System Health dashboard from a console, you can click the site selector at
the top of the page to view data for a specific site or for all sites in your
environment.
or by clicking
Dashboards from the top of the page. The System Health dashboard
automatically displays information about the ExtraHop system you are connected to. If you
are viewing the System Health dashboard from a console, you can click the site selector at
the top of the page to view data for a specific site or for all sites in your
environment.
Charts on the System Health dashboard are divided into the following sections:
- Device Discovery
- View the total amount of devices on your network. See which devices have been discovered and how many of those devices are currently active.
- Data Feed
- Assess the efficiency of the wire data collection process with charts related to throughput, packet rate, desyncs, and capture drops.
- Records
- View the total amount of records that are being sent to an attached recordstore..
- Triggers
- Monitor the impact of triggers on your ExtraHop system. See how often triggers are running, how often they are failing, and which triggers are placing the largest load on your CPU.
- Open Data Stream and Recordstore
- Follow the activity of open data stream (ODS) transmissions to and from your system. View the total number of remote connections, message throughput, and details related to specific remote targets.
- SSL Certificates
- Review the status information for all SSL certificates on your ExtraHop system.
- Remote Packet Capture (RPCAP)
- View the number of packets and frames that are sent and received by RPCAP peers.
- Advanced Health Metrics
- Track heap allocation related to data capture, the system datastore, triggers, and remote transmissions. Monitor write throughput, working set size, and trigger activity on the system datastore.
Device Discovery
The Device Discovery section of the System Health dashboard provides a view of the total amount of devices on your network. See which types of devices are connected and how many of those devices are currently active.
The Device Discovery section provides the following charts:
Active Devices
An area chart that displays the number of L2, L3, gateway, and custom devices that have been actively communicating on the network over the selected time interval. Next to the area chart, a value chart displays the number of L2, L3, gateway, and custom devices that were active over the selected time interval.
Monitor this chart after making SPAN configuration changes to ensure that there were no unintended consequences that could put the ExtraHop system in a bad state. For example, accidental inclusion of a network can strain the capacity of the ExtraHop system capabilities by consuming more resources and requiring more packet handling, which results in poor performance. Check that the ExtraHop system is monitoring the expected number of active devices.
Data Feed
The Data Feed section of the System Health dashboard allows you to observe the efficiency of the wire data collection process with charts related to throughput, packet rate, desyncs, and capture drops.
The Data Feed section provides the following charts:
Throughput
An area chart depicting the throughput of incoming packets over the selected time interval, expressed in bytes per second. The chart displays throughput information for analyzed and filtered packets, as well as L2 and L3 duplicates.
Exceeding product thresholds might result in data loss. For example, a high throughput rate might result in packets dropped at the span source or at a span aggregator. Similarly, large amount of L2 or L3 duplicates can also indicate an issue at the span source or span aggregator and might result in skewed or incorrect metrics.
The acceptable rate of bytes per second depends on your product. Refer to the ExtraHop Sensors datasheet to discover what the limits are for your ExtraHop system and determine if the rate of bytes per second is too high.
Throughput by Interface
A line chart depicting the throughput of incoming packets, listed by each interface configured on the sensor. Throughput is expressed in bytes per second during the selected time interval. The chart displays throughput information for analyzed and filtered packets, as well as L2 and L3 duplicates.
When viewing multiple sensors from an ExtraHop console, the chart depicts the aggregated average rate of transfer from interfaces that share the same number.
Exceeding product thresholds might result in data loss. For example, a high throughput rate might result in packets dropped at the span source or at a span aggregator. Similarly, large amounts of L2 or L3 duplicates can also indicate an issue at the span source or span aggregator and might result in skewed or incorrect metrics.
The acceptable rate of packet per second depends on your product. Refer to the ExtraHop Sensors datasheet to discover what the limits are for your ExtraHop system and determine if the rate of packets per second is too high.
Monitor this chart to troubleshoot packet throughput issues at a granular level and make interface configuration adjustments if needed.
Packet Rate
An area chart that displays the rate of incoming packets, expressed in packets per second. The chart displays packet rate information for analyzed and filtered packets, as well as L2 and L3 duplicates.
The acceptable rate of packet per second depends on your product.Refer to the ExtraHop Sensors datasheet to discover what the limits are for your ExtraHop system and determine if the rate of packets per second is too high.
Packet Rate by Interface
A line chart chart that displays the rate of incoming packets and a column chart that displays the number of dropped packets, listed by each interface configured on the sensor. Packet rate is expressed in packets received per second during the selected time interval. The chart displays packet rate information for analyzed and filtered packets, as well as L2 and L3 duplicates.
When viewing multiple sensors from an ExtraHop console, the chart depicts the aggregated packet rate and the number of packets dropped by interfaces that share the same number.
Exceeding product thresholds might result in data loss. For example, a high packet rate might result in packets dropped at the span source or at a span aggregator. Similarly, large amounts of L2 or L3 duplicates can also indicate an issue at the span source or span aggregator and might result in skewed or incorrect metrics.
The acceptable rate of packet per second depends on your product. Refer to the ExtraHop Sensors datasheet to discover what the limits are for your ExtraHop system and determine if the rate of packets per second is too high.
Monitor this chart to troubleshoot packet rate issues at a granular level and make interface configuration adjustments if needed.
Packet Errors by Interface
A line chart that displays the number of packet errors received during the selected time interval, listed by each interface configured on the sensor. The chart displays packet error information for analyzed and filtered packets, as well as L2 and L3 duplicates.
When viewing multiple sensors from an ExtraHop console, the chart depicts the aggregated number of packet errors that occurred on interfaces that share the same number.
Monitor this chart to troubleshoot packet errors at a granular level. Increased packet errors might result in data loss. Ensure that packets are sent as expected and make interface configuration adjustments if needed.
Analyzed Flows
A line chart that displays the number of flows that the ExtraHop system analyzed over the selected time interval. The chart also displays how many unidirectional flows occurred over the same time period. Next to the line chart, a value chart displays the total number of analyzed and unidirectional flows that occurred over the selected time interval. A flow is a set of packets that are part of a transaction between two endpoints over a protocol such as TCP, UDP, or ICMP.
Desyncs
A line chart that displays occurrences of system-wide desyncs on the ExtraHop system over the selected time interval. Next to the line chart, a value chart displays the total number of desyncs that occurred over the selected time interval. A desync is when the ExtraHop data feed drops a TCP packet and, as a result, is no longer synchronized with a TCP connection.
If adjustments to your SPAN do not reduce a large number of desyncs, contact ExtraHop Support.
Truncated Packets
A line chart that displays occurrences of truncated packets on the ExtraHop system over the selected time interval. Next to the line chart, a value chart displays the total number of truncated packets that occurred over the selected time interval. A truncated packet occurs when the actual total length of the packet is less than the total length that is indicated in the IP header.
Capture Drop Rate
A line chart that displays the percentage of packets dropped at the network card interface on an ExtraHop system over the selected time interval.
Capture Load
A line chart that displays the percentage of cycles on the ExtraHop system that are consumed by active capture threads over the selected time interval, based on the total capture thread time. Click the associated Average Capture Load chart to drill down by thread and determine which threads are consuming the most resources.
Metrics Written to Disk (Log Scale)
A line chart that displays the amount of space consumed by metrics that were written to disk over the selected time interval, expressed in bytes per second. Because there is a large range between data points, the disk usage is displayed in logarithmic scale.
Metric Data Lookback Estimates
Displays the estimated datastore lookback metrics on the ExtraHop system. Lookback metrics are available in 24 hour, 1 hour, 5 minute, and 30 second time intervals based on the write throughput rate, which is expressed in bytes per second.
Refer to this chart to determine how far back you are able to look up historical data for given time intervals. For example, you might be able to look up 1 hour intervals of data as far back as 9 days.
Records
The Records section of the System Health dashboard enables you to observe the efficiency of the wire data collection process with charts related to record counts and throughput.
The Data Feed section provides the following charts:
Record Count
A line chart that displays the number of records sent to a recordstore over the selected time interval. Next to the line chart, a value chart displays the total number of records sent over the selected time interval.
An extremely high number of records sent to a recordstore can lead to long message queue lengths and dropped messages at the recordstore. View charts in the Open Data Stream and Recordstore section of the System Health dashboard for more information about recordstore transmissions.
Record Throughput
A line chart that displays the amount of records in bytes sent to a recordstore. Next to the line chart, a value chart displays the total amount of records sent in bytes over the selected time interval.
This chart does not reflect size adjustments based on compression or deduplication and should not be referenced to estimate recordstore costs. An extremely high record throughput can lead to long message queue lengths and dropped messages at the recordstore. View charts in the Open Data Stream and Recordstore section of the System Health dashboard for more information about recordstore transmissions.
Triggers
The Triggers section of the System Health dashboard allows you to monitor the impact of triggers on your system. See how often triggers are running, how often they are failing, and which triggers are placing the largest load on your CPU.
The Triggers section provides the following charts:
Trigger Load
A line chart that displays the percentage of CPU cycles allocated for trigger processes that have been consumed by triggers during the selected time interval.
Trigger Delay
A column chart that displays the maximum trigger delays that occurred over the selected time interval in milliseconds. Next to the column chart, a value chart displays the single longest trigger delay that occurred over the selected time interval. A trigger delay is the amount of time between when a trigger event is captured and a trigger thread is created for the event.
Long trigger delays might indicate processing issues, view the Trigger Exceptions by Triggerand Trigger Load by Trigger charts to see which trigger is committing the most unhandled exceptions and which ones are consuming the most resources.
Trigger Executes and Drops
A line and column chart where the line chart displays the number of times triggers were run, and the accompanying column chart displays the number of times triggers were dropped, over the selected time interval. Next to the line and column chart, a value chart displays the total number of trigger executes and drops that occurred over the selected time interval. These charts provide an overall snapshot of all triggers currently running on the ExtraHop system.
Trigger Details
A list chart that displays individual triggers and the number of cycles, executes, and exceptions attributed to each over the selected time interval. By default, the list of triggers is sorted in descending order by trigger cycles.
Trigger Load by Trigger
A line chart that displays the percentage of CPU cycles allocated for trigger processes that have been consumed by triggers during the selected time interval, listed by trigger name.
Trigger Executes by Trigger
A line chart that displays the number of times each active trigger ran over the selected time interval.
High activity might also indicate that a trigger is working harder than it needs to. For example, a trigger might run on multiple events where it would be more efficient to create separate triggers, or a trigger script might not adhere to recommended scripting guidelines as described in the Triggers Best Practices Guide.
Trigger Exceptions by Trigger
A line chart that displays the number of unhandled exceptions, sorted by trigger, that occurred on the ExtraHop system over the selected time interval.
Trigger Cycles by Thread
A line chart that displays the number of trigger cycles consumed by triggers for a thread.
Open Data Stream and Recordstore
The Open Data Stream (ODS) and Recordstore section of the System Health dashboard enables you to follow the activity of ODS and recordstore transmissions to and from your system. You can also view the total number of remote connections, message throughput, and details related to specific remote targets.
The Open Data Stream (ODS) and Recordstore section provides the following charts:
Message Throughput
A line chart that displays the throughput of remote message data, expressed in bytes. Next to the line chart, a value chart displays the average throughput rate of remote message data over the selected time interval. Remote messages are transmissions sent to a recordstore or to third-party systems from the ExtraHop system through an open data stream (ODS).
Messages Sent
A line chart that displays the average rate that remote messages were sent from the ExtraHop system to a recordstore or open data stream (ODS) target. Next to the line chart, a value chart displays the total number of messages sent out over the selected time interval.
Messages Dropped by Remote Type
A line chart that displays the average rate of remote messages that were dropped before they reached a recordstore or ODS target.
Message Send Errors
A line chart that displays the number of errors that occurred while sending a remote message to a recordstore or ODS target. Monitor this chart to make sure that packets are sent as expected. Transmission errors might involve the following:
- Target Server Errors
- The number of errors that are returned to the ExtraHop system by recordstores or ODS targets. These errors occurred on the target server and do not indicate an issue with the ExtraHop system.
- Full Queue Dropped Messages
- The number of messages sent to recordstores and ODS targets that were dropped because the message queue at the target server was full. A high number of dropped messages might indicate that message throughput is too high to be processed by the ExtraHop system or the target server. Look at the Exremote Message Queue Length by Target and the Target Details charts to see if your transmission errors might be related to a long message queue length.
- Target Mismatch Dropped Messages
- The number of remote messages dropped because the remote system specified in the Open Data Stream (ODS) trigger script does not match the name configured on the Open Data Streams page in Administration settings. Make sure that the names of remote systems are consistent in trigger scripts and Administration settings.
- Decoding Errors Dropped Messages
- The number of messages dropped as a result of internal encoding issues between ExtraHop Capture (excap) and ExtraHop Remote (exremote).
Connections
A line and column chart where the line chart displays the number of attempts the system made to connect to a remote target server and the accompanying column chart displays the number of errors that occurred as a result of those attempts. Next to the line and column chart, a value chart displays the total number of connection attempts and connection errors that occurred over the selected time interval.
Exremote Message Queue Length by Target
A line chart that displays the number of messages in the ExtraHop Remote (exremote) queue waiting to be processed by the ExtraHop system.
Excap Message Queue Length by Remote Type
A line chart that displays the number of remote target messages in the ExtraHop Capture (excap) queue waiting to be processed by the ExtraHop system.
Refer to the Messages Dropped by Remote Type chart to determine if message drops have occurred.
Target Details
A list chart that displays the following metrics related to recordstore or ODS remote targets over the selected time interval: target name, target message bytes out, target messages sent, target server errors, full queue dropped messages, decoding errors dropped messages, target server connection attempts, and target server connection errors.
SSL Certificates
The SSL Certificates section of the System Health dashboard allows you to review the status information for all SSL certificates on your system.
The SSL Certificates section provides the following chart:
Certificate Details
A list chart that displays the following information for each certificate:
- Decrypted Sessions
- The number of sessions that were successfully decrypted.
- Unsupported Sessions
- The number of sessions that could not be decrypted with passive analysis, such as DHE key exchange.
- Detached Sessions
- The number of sessions that were not decrypted or only partially decrypted due to desyncs.
- Passthrough Sessions
- The number of sessions that were not decrypted due to hardware errors, such as those caused by exceeding the specifications of SSL acceleration hardware.
- Sessions Decrypted with Shared Secret
- The number of sessions that were decrypted through a shared secret key.
Remote Packet Capture (RPCAP)
The Remote Packet Capture (RPCAP) section of the System Health dashboard enables you to view the number of packets and frames that were sent from RPCAP peers and received by the ExtraHop system.
The Remote Packet Capture (RPCAP) section provides the following charts:
Forwarded by Peer
A list chart that displays the following information regarding packets and frames that are forwarded by an RPCAP peer:
- Forwarded Packets
- The number of packets that an RPCAP peer attempted to forward to an ExtraHop system.
- Forwarder Interface Packets
- The total number of packets that were viewed by the forwarder. Forwarders on RPCAP devices will coordinate with each other to keep multiple devices from sending the same packet. This is the number of packets that were viewed before any frames were removed to reduce forwarded traffic, and before frames were removed by user-defined filters.
- Forwarder Kernel Frame Drops
- The number of frames that were dropped because the kernel of the RPCAP peer was overloaded with the stream of unfiltered frames. Unfiltered frames have not been filtered by the kernel to remove duplicate packets or packets that should not be forwarded because of user-defined rules.
- Forwarder Interface Drops
- The number of packets that were dropped because the RPCAP forwarder was overloaded with the stream of unfiltered frames. Unfiltered frames have not been filtered to remove duplicate packets or packets that should not be forwarded because of user-defined rules.
Received by the ExtraHop system
A list chart that displays the following information regarding packets and frames that are received by an ExtraHop system from a Remote Packet Capture (RPCAP) peer:
- Encapsulated Bytes
- The total size of all packets related to the UDP flow from the RPCAP device to the ExtraHop system, in bytes. This information shows you how much traffic the RPCAP forwarder is adding to your network.
- Encapsulated Packets
- The number of packets related to the UDP flow from the RPCAP device to the ExtraHop system.
- Tunnel Bytes
- The total size of packets, not including encapsulation headers, that the ExtraHop system received from an RPCAP device, in bytes.
- Tunnel Packets
- The number of packets that the ExtraHop system received from an RPCAP peer. This number should be very close to the Forwarded Packets number in the Sent by Remote Device chart. If there is a big gap between these two numbers, then packets are dropping between the RPCAP device and the ExtraHop system.
Tracking the encapsulated packets and bytes is a good way to make sure that RPCAP forwarders are not placing an unnecessary load on your network. You can monitor tunnel packets and bytes to make sure that the ExtraHop system is receiving everything that the RPCAP device is sending.
Advanced Health Metrics
The Advanced Health Metrics section of the System Health dashboard allows you to track heap allocation related to data capture, the system datastore, triggers, and remote transmissions. Monitor write throughput, working set size, and trigger activity on the system datastore.
The Advanced Health Metrics section provides the following charts:
Capture and Datastore Heap Allocation
A line chart that displays the amount of memory that the ExtraHop system dedicates to network packet capture and to the datastore.
Trigger and Remote Heap Allocation
A line chart that displays the amount of memory, expressed in bytes, that the ExtraHop system dedicates to processing capture triggers and to open data streams (ODS).
Store Write Throughput
An area chart that displays the datastore write throughput, expressed in bytes, on the ExtraHop system. The chart displays data for the selected time interval and for 24 hour, 1 hour, 5 minute, and 30 second intervals.
Working Set Size
An area chart that displays the write cache working set size for metrics on the ExtraHop system. The working set size indicates how many metrics can be written to the cache for the selected time interval and for 24 hour, 1 hour, 5 minute, and 30 second intervals.
Datastore Trigger Load
A line chart that displays the percentage of cycles consumed by datastore-specific triggers on the ExtraHop system, based on the total capture thread time.
Datastore Trigger Executes and Drops
A line and column chart where the line chart displays the number of times datastore-specific triggers on the ExtraHop system were run during the selected time interval, and the accompanying column chart displays the number of datastore-specific triggers dropped from the queue of triggers waiting to run on the ExtraHop system during the selected time interval.
From the Datastore Trigger Load chart, click on the Trigger Load metric label to drill down and see which datastore triggers are running most frequently.
Any drop data displayed on the column chart indicates that datastore trigger drops are occurring and that trigger queues are backed up.
The system queues trigger operations if a trigger thread is overloaded. If the datastore trigger queue grows too long, the system stops adding trigger operations to the queue and drops the triggers. Currently running triggers are unaffected.
The primary cause of long queues, and subsequent trigger drops, is a datastore long-running trigger.
Datastore Trigger Exceptions by Trigger
A list chart that displays the number of unhandled exceptions caused by datastore-specific triggers on the ExtraHop system.
Status and diagnostics tools in the Administration settings
The Administration settings is another source for system information and diagnostics.
For more metrics about the overall health of the ExtraHop system, and for diagnostic tools that enable ExtraHop Support to troubleshoot system errors, look at the Status and Diagnostics section of the Administration settings.
System Usage dashboard
The System Usage dashboard enables you to monitor how users are interacting with the ExtraHop system.
Each chart in the System Usage dashboard contains visualizations of user interactions with the ExtraHop system and detections that have been generated over the selected time interval, organized by region.
| Note: | The System Usage dashboard is a built-in, system dashboard that you cannot edit, delete, or add to a shared collection. You cannot make a copy of the System Usage dashboard or copy charts to custom dashboards. |
Before you begin
The System Usage dashboard can only be viewed from a console by users with System and Access Administration privileges.The following information summarizes each region and its charts.
- ExtraHop Users
- Observe user login activity and the current number of active users on the
ExtraHop system.
Active Users and Logins: The number of times users have logged in to the ExtraHop system, and current snapshots of active users. The line chart displays current active users, and the column chart displays the number of user logins over time. A login is counted every time a user logs in to the system, including multiple logins by a single user.
Top User Logins: Users with the most logins on the ExtraHop system over the selected time interval.
Active Users and Logins: The number of users that are currently active on the ExtraHop system, and the total number of user logins over the selected time interval.
- Dashboards
- Observe how often users are viewing dashboards and which dashboards are viewed the most.
Dashboard Views: Total dashboard views over time. A dashboard view is counted when a dashboard appears following a user login, click, or direct navigation through a shared URL.
Top Viewed Dashboards: Dashboards with the highest number of views.
Total Dashboard Views: The total number of dashboard views over the selected time interval.
- Detections
- Observe information about detections that are generated by the ExtraHop system and how users
are viewing and tracking detections.
Detection Views: Two values are displayed in this line chart: Detection List Views counts the number of clicks on the detection list when grouped by detection type, and Detection Detail Views counts the number of times a detection detail page appears following a user login, click, or direct navigation through a shared URL. Click on either metric name in the legend to drill down by detection type.
Top Viewed Detections: The detection types that were viewed the most over the selected time interval.
Total Detection Views: The total values for both detection list views and detection detail views over the selected time interval.
Detection Tracking (line chart): The number of detections that were closed with and without action taken, and the number of investigations that were created over time.
Detection Tracking (list chart): The total number of detections that were closed with and without action taken, the number of investigations created, and the total number of detections that were set to the Acknowledged status over the selected time interval. The list also includes the number of detections that are currently set to the In Progress status.
Total Closed Detections: The total number of detections that were closed with and without action taken over the selected time interval. The Total Closed Detections values include detections that were hidden after the detection status was set.
- Detection Types
- Observe which detection types were generated the most by the ExtraHop system and
how users are interacting with those detections.
Top Viewed Detection Types: The number of detection list views and detection detail views for the detection types that have occurred over the selected time interval.
Create a dashboard
Dashboards provide a single location for important metrics that you care about. When you create a custom dashboard, a dashboard layout opens containing a single region with an empty chart widget and an empty text box widget. Edit a chart to incorporate real-time metrics into your dashboard, and edit a text box to provide information. Finally adjust the layout and add more widgets to complete your dashboard and begin monitoring your network.
Before you begin
Determine which metrics you want to monitor on your dashboard. Ask yourself the following questions:- Do I want to track if my server is offline or unavailable? Add availability metrics such as requests and responses to your dashboard charts.
- Is my server functioning properly? Add reliability metrics such as errors to your dashboard charts.
- Is my server properly resourced? Add performance metrics such as server processing time to your dashboard charts.
Create the dashboard layout
The following steps show you how to create the framework for your dashboard, which includes two empty widget types: a chart and a text box. Your new dashboard opens in Edit Layout mode (which is displayed in the upper right corner). Edit Layout mode enables you to quickly edit your chart and text box, and arrange the placement of widgets and regions on a dashboard.
- Log in to the ExtraHop system through https://<extrahop-hostname-or-IP-address>.
- At the top of the page, click Dashboards.
-
On the Dashboards page, complete one of the following steps:
- Click Dashboards in the dashboard dock and then click Create Dashboard at the bottom of the dock.
- Click the command menu in the upper right corner of the page and
select New Dashboard.
- In the Dashboard Properties window, type a name for your dashboard.
- Enter any other meta data for your dashboard, such as a name for the author or a description. Note that the Permalink provides a direct URL to your dashboard for any users who have sharing privileges for your dashboard.
- Click Create.
Edit a basic chart
The following steps show the general flow for editing a chart widget in the Metric Explorer tool. Begin by specifying sources and metrics to add data to your chart. For example, you can now add the availability, reliability, or performance metrics that you considered at the beginning of this procedure to your dashboard. Then choose a chart type to visualize the data.
Next steps
- Learn more about charts from the Charts FAQ.
- Practice building charts by completing the following walkthroughs:
Edit a basic text box widget
The following steps show you how to display custom text in a dashboard region, which is a helpful tool for adding notes about a chart or data in a dashboard. The text box widget supports the Markdown syntax. A new text box widget contains sample text that is already formatted in Markdown to provide you with basic examples.
- Click the text box.
- Type and edit text in the left Editor pane. The HTML output text dynamically displays in the right Preview pane. For more formatting examples, see Format text in Markdown.
- Click Save.
Add more widgets and regions to your dashboard
Add and arrange the placement of regions and widgets on your dashboards.
Next steps
Now that your dashboard is complete, you can perform the following steps:
Chart editing tips
The following tips help you search for and select metrics when building a chart.
- Filter search results to a specific source type or protocol by clicking Any Type or Any Protocol underneath the search fields.
- You can only select the same source type that is currently in your metric set. A metric set contains one source type and metrics. For example, if you select the All Activity application as the source, you can only add more applications to that metric set.
- Create an ad hoc group of more than one source in your chart by selecting Combine Sources. For example, you can combine two applications and then view a single metric value in the chart for both of these applications.
- If you select a device group as your source, you can Drill down by Group Member to display individual metrics for up to 20 of the devices within the group.
Create a dashboard with dynamic sources
You can create a dashboard with dynamic sources to enable users to change the source of the dashboard at any time. If you have created a large number of dashboards that all have the same metrics, but different sources, you might want to consider replacing those dashboards with a single, dynamic-source dashboard.
| Tip: | If you want to hide the dynamic source menu from your dashboard, append
the following parameter to the end of the dashboard page URL:
&hideTemplatePanel=true. Before 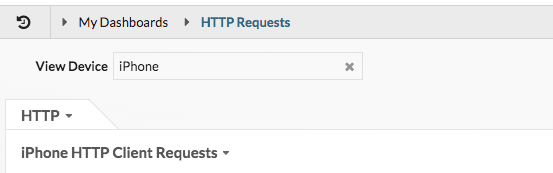
After 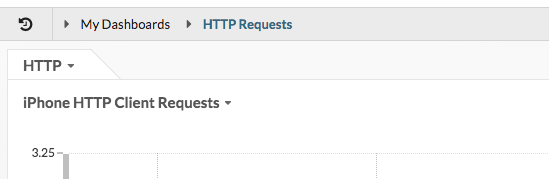
For example: https://eda/extrahop/#/Dashboard/XYFwM/?$device=16&from=30&interval_type=MIN&until=0&hideTemplatePanel=true |
Next steps
Copy a dashboard
If you want to duplicate a useful dashboard, you can copy a dashboard and then replace or modify sources to display different application, device, or network data. You can only copy one dashboard at a time.
| Note: | If you only want to copy a dashboard so you can change the source across the entire dashboard, you might want to consider creating a dashboard with dynamic sources instead of making multiple copies of a single dashboard. |
-
Click the command menu in the upper right corner of the dashboard
page.
-
To rename the copied dashboard, complete the following steps:
-
Click the command menu in the upper right corner and the
page.
- Select Dashboard Properties.
- In the Title field, type a new name.
- Click Save.
Tip: To quickly copy a dashboard, type the keyboard shortcut CD and then update Dashboard Properties or modify sources. -
Click the command menu
Edit a dashboard layout
Place your dashboard into Edit Layout mode to add, delete, or rearrange the widgets and regions on your dashboard layout. You can only add or delete widgets or regions when the dashboard is in Edit Layout mode.
When you create a new dashboard, the dashboard is automatically placed into Edit Layout Mode. To edit the layout of an existing dashboard, complete the following steps:
-
Click the command menu in the upper right corner of the page, and then
select Edit Layout.
Edit a chart with the Metric Explorer
The Metric Explorer is a tool for creating and editing charts, which lets you construct dynamic visualizations of device and network behavior.
| Video: | See the related training: Choosing a Metric |
Create and edit a basic chart
With the Metric Explorer, you can edit chart components, such as sources, metrics, and data calculations, and then preview how metric data appears in different chart types. When you are satisfied with your selections, save your chart to a dashboard.
The following steps show you the basic workflow and minimum requirements for completing a new chart.
-
Click Add Source and then select a source.
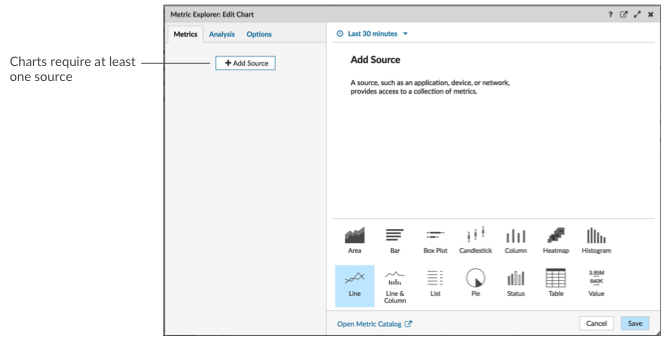
- You can select a static source for the chart by typing the name of an application, device, or network.
- You can also select a dynamic source that can be dynamically modified by dashboard viewers by typing $ and selecting a variable from the Source Type Variable list. For more information about source type variables and dashboard templates, see Create a dashboard with dynamic sources.
-
In the Metrics field, type a protocol and metric name. Then select the metric
from the list of results, as shown in the following figure.
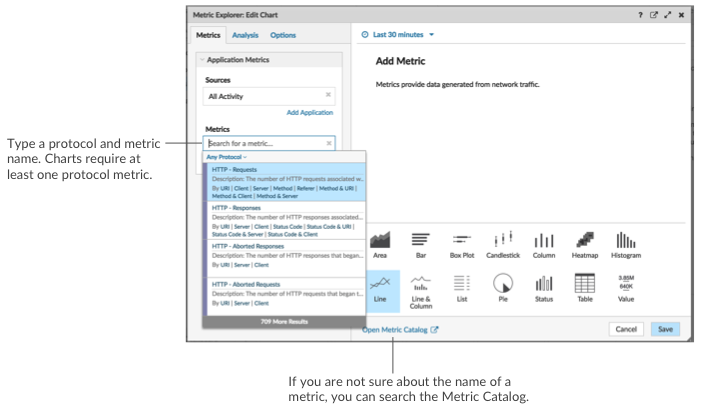
-
Select a chart from the bottom of the Metric Explorer, as shown in the
following figure.
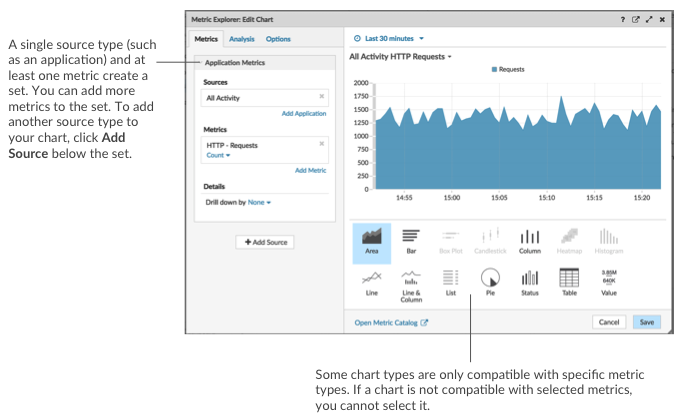
Configure advanced options for data analysis and chart customization
Depending on the metrics and chart type you select, you can configure advanced options for creating sophisticated visualizations with the Metric Explorer, as shown in the following figure.
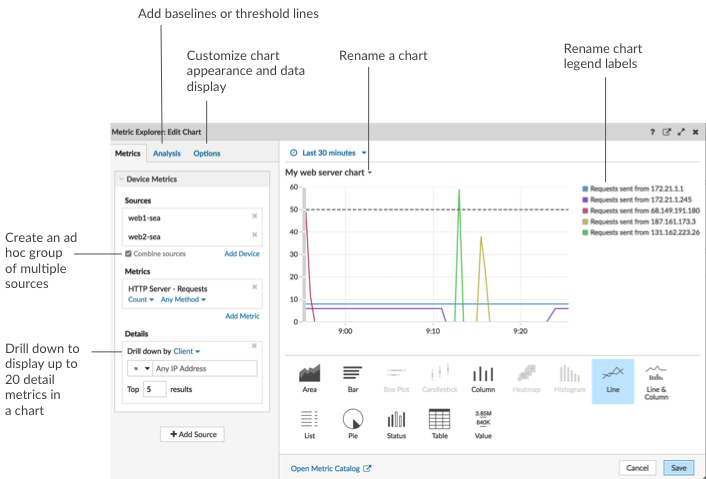
Drill down on metric data and sources to display details
In the Details section from the Metrics tab, you can drill down to display detail metrics or drill down on a device group to display individual devices within the chart. You can also filter detail metrics for exact matches, or create a regex filter.Add a baseline or threshold line from the Analysis tab
You add a dynamic baseline or static threshold line to your chart. Baselines are calculated after the chart is saved. To see a line that represents a threshold, such as an service level agreement (SLA) value, add a static threshold line to your chart.Rename legend labels and the chart title
For charts that display a legend, you can change a metric name in the chart legend with a custom label. In the Metric Explorer, click the label in the preview pane then select Rename. To rename a chart, click the chart title and select Rename.Customize your chart from the Options tab
You can access the following options for customizing chart properties and the display of metric data in your chart:- Convert metric data from bytes to bits
- Convert metric data from base 2 (Ki=1024) to base 10 (K = 1000)
- Change the y-axis in a time-series chart from linear to log scale
- Abbreviate metric values in a chart (for example, abbreviate 16,130,542 bytes to 16.1 MB)
- Sort metric data in ascending or descending order in a bar, list, or value chart
- Change the percentile precision in a pie chart
- Hide or display a chart legend
- Hide inactive metrics with a zero value so that these metrics are not visible in the chart, including the legend and label
- Include sparkline in a list or value chart
- Show the alert status for data displayed in list or value charts (for more information, see Alerts)
- Switch the color display for metric data to grayscale (with exception to charts that display an alert status)
- For IP address labels, display the hostname (if detected from DNS traffic in wire data) or origin IP address (if a proxy is detected from wire data)
- Show the relative time for an expiration date, such as the number of days until an SSL certificate expires.
| Note: | Some options are only available for specific chart types. For example, the option to include a sparkline only appears in the Options tab for list and value charts. |
Create an ad hoc group to combine data from multiple sources
From the Metric tab, you can create an ad hoc group of multiple sources within a set by selecting Combine Sources. For example, you can combine two applications and then view a single metric value in the chart for both of these applications.Next steps
Practice building charts by completing the following walkthroughs:Regular expression filters
Filter your search results by writing regular expression (regex) strings in certain search fields throughout the ExtraHop system. For example, you can filter for parameters in a detail metric key, such as a number within an IP address. You can also filter by excluding specific keys or a combination of keys from charts.
- Search fields with an asterisk
- Click the asterisk to enable regex strings.
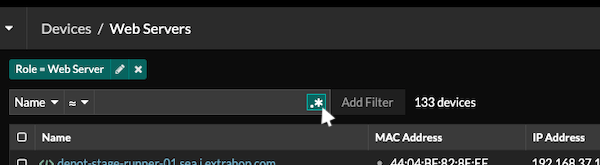
This type of field is available from the following system pages:- Filtering a table of devices
- Creating filter criteria for a dynamic device group
- Certain search fields with a trifield operator
- Click the operator drop-down to select the regex option.
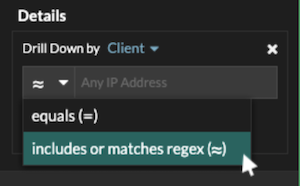
This type of field is available from the following system page:- Editing a chart in Metric Explorer
- Certain search fields with a tooltip
- Hover over the tooltip in the field to see when regex is required.
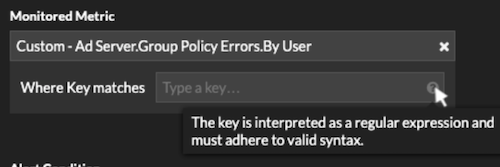
This type of field is available from the following system page:- Adding record relationships to a custom metric
The following table includes examples of standard regex syntax.
| Chart Scenario | Regex filter | How it works |
|---|---|---|
| Compare HTTP status codes 200 to 404. | (200|404) | The vertical bar symbol ( | ) is the OR operator. This filter matches 200, or 404, or both status codes. |
| Display any HTTP status code that contains a 4. | [41] | Square brackets ( [ and ] ) designate a range of characters. The filter searches for every character inside the brackets, regardless of order. This filter matches any value that contains a 4 or a 1. For example, this filter can return 204, 400, 101, or 201 status codes. |
| Display all 500-level HTTP status codes. | ^[5] | The caret symbol ( ^ ) outside square brackets ( [ and ] ) means "starts with." This filter matches any value that begins with a 5. For example, this filter can return 500 and 502 status codes. |
| Display all 400 and 500-level HTTP status codes. | ^[45] | Multiple values inside square brackets ( [ and ] ) are searched individually, even when preceded by the caret symbol ( ^ ). This filter does not search for values that begin with 45, but matches all values that begin with a 4 or 5. For example, this filter can return 400, 403, and 500 status codes. |
| Display any HTTP status codes except 200-level status codes. | ^(?!2) | A question mark ( ? ) and exclamation point ( ! ) inside parentheses specify a value to exclude. This filter matches all values except values beginning with a 2. For example, this filter can return 400, 500, and 302 status codes. |
| Display any IP address with a 187. | 187. | Matches 1, 8, and 7 characters in the IP address. This filter will not return IP addresses that end in 187 because the trailing period designates that something must come after the values. If you want to search the period as a literal value, you must precede it with a backslash ( \ ). |
| Review all IP addresses containing 187.18. | 187\.18. | Matches 187.18 and anything that follows. The first period is treated literally because it is preceded by a backslash ( \ ). The second period is treated as a wildcard. For example, this filter returns results for 187.18.0.0, 180.187.0.0, or 187.180.0.0/16. This filter does not return an address that ends with 187.18, because the wildcard requires that characters follow the specified values. |
| Display any IP address except 187.18.197.150. | ^(?!187\.18\.197\.150) | Matches anything except 187.18.197.150, where ^(?!) specifies the value to exclude. |
| Exclude a list of specific IP addresses. | ^(?!187\.18\.197\.15[012]) | Matches anything except 187.18.197.150, 187.18.197.151, and 187.18.197.152, where ^(?!) specifies the value to exclude and the square brackets ( [ and ] ) specify multiple values. |
Additional filters
When you create a custom detail metric from the Metric Catalog, you can add advanced regex syntax to the Additional Filters search field in the Record Relationships section.

The regex syntax in this field must meet the following requirements:
- If your key contains multiple values, your regex syntax must include a
single capture group. A capture group is designated by parenthesis. Your
capture group determines the filter value.
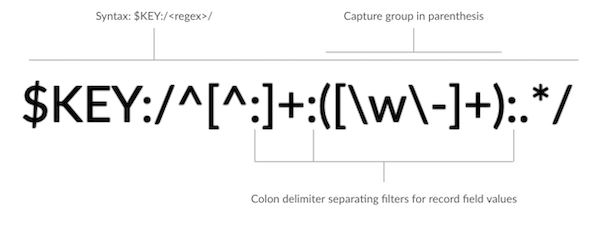
- If you want to return a specific value from a detail metric key that
contains multiple record field values, the regex must follow this syntax:
$KEY:/<regex>/
For example, if your detail metric key is ipaddr:host:cipher and you only want to return the IP address value, you would type the following:
$KEY:/^([^:]+):.+/
- If your key contains multiple record field values, the values are separated by a delimiter that is specified in the trigger that is generating the key. The placement of the delimiters in your regex syntax must match the delimiters in the detail key. For example, if you have a key with three values that are separated by a delimiter that is a colon, the three values for the key in your regex syntax must be separated by two colons.
| Tip: | If you want to return all record field values in a detail metric key, type $KEY. For example, if your detail metric key is ipaddr:host:cipher, type $KEY in the search field to return all three of those field record values (IP address, hostname, and SSL cipher suite). |
Edit a text box widget
If you want to include explanatory text next to your dashboard charts or display a company logo in your dashboard, you can edit a text box widget. With the text box widget, you can display text, links, images, or sample metrics in your dashboard.
| Video: | See the related training: Provide Context with Text Box Widgets |
The text box widget supports Markdown, which is a simple formatting syntax that converts plain text into HTML with non-alphabetic characters, such as "#" or "*". New text box widgets contain Markdown examples. A text box widget is automatically provided each time you create a dashboard. You can also add a text box widget to your dashboard layout.
To edit an existing text box widget, complete the following steps:
-
Click the command menu in the upper right corner and select
Edit Layout.
Format text in Markdown
The following table shows common Markdown formats that are supported in the text box widget.
| Note: | Additional Markdown format examples are provided in the GitHub Guides: Mastering Markdown. However, not all Markdown syntax formatting options are supported in the ExtraHop text box widget. |
| Format | Description | Example |
|---|---|---|
| Headings | Place a number sign (#) before your text to format headings. The level of heading is determined by the amount of number signs. | ####Example H4 heading |
| Unordered lists | Place a single asterisk (*) before your text. | * First example * Second example |
| Ordered lists | Place a single number and period (1.) before your text. | 1. First example 2. Second example |
| Bold | Place double asterisks before and after your text. | **bold text** |
| Italics | Place an underscore before and after your text. | _italicized text_ |
| Hyperlinks |
Place link text in brackets before the URL in parentheses. Or type your URL. Links to external websites open in a new browser tab. Links within the ExtraHop system, such as dashboards, open in the current browser tab. |
[Visit our home page](https://www.extrahop.com) https://www.extrahop.com |
| Blockquotes | Place a right angle bracket and a space before your text. |
On the ExtraHop website: > Access the live demo and review case studies. |
| Monospace font | Place a backtick (`) before and after your text. | `example code block` |
| Emojis | Adding emojis in Markdown syntax is unsupported; however, you can copy and
paste a Unicode emoji image into the text box. See the Unicode Emoji Chart website for images. |
Add images in Markdown
You can add images to the text box widget by linking to them. Make sure your image is hosted on a network that is accessible to the ExtraHop system.
Links to images must be specified in the following format:

Where <alt_text> is the alternative text for the image name and <file_path> is the path of the image. For example:

| Note: | You also can add images by encoding them to Base64. For more information, see the following post on the ExtraHop forum, "Putting Images in Text Boxes." |
Add metric examples in Markdown
You can write a metric query to include a metric value inline with text in the text box widget. For example, to show how many web servers have returned a 404 error, you can add a metric query to a sentence and the value is updated within the text.
The following example shows the basic format for writing metric queries:
%%metric:{
    "metric_category": "<metric_category>",
    "object_type": "<object_type>",
    "object_ids": [object_id],
    "metric_specs": [
        {
            "name": "<metric_spec>"
        }
    ]
}%%
To locate the object_type, metric_spec, and metric_category values for a metric, complete the following steps:
- Click Settings
- Click Metric Catalog.
- Type the metric name in the search field.
- Select the metric, and note the values for metric_category, object_type, and metric_spec in the REST API Parameters section.
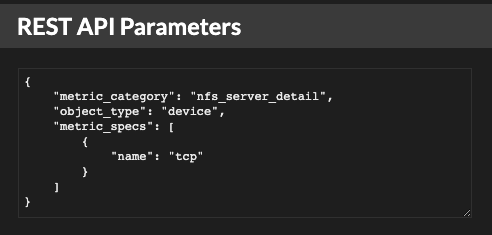
To locate the object_id for a device, device group, or other asset, complete the following steps:
- Click Assets, and then click an asset type from the left pane.
- Click the name of the asset you want, and then open the properties window.
- Note the value displayed for the REST API ID.
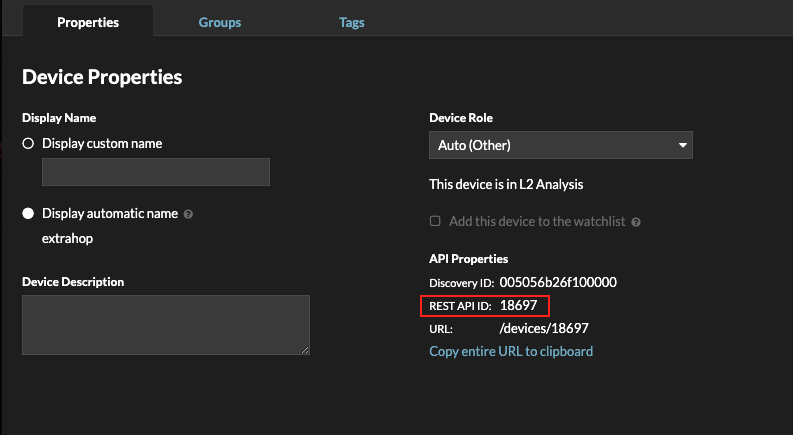
After you locate the values for the metric you want to display, add them to the metric query in the text editor. The value will be displayed in the text widget.
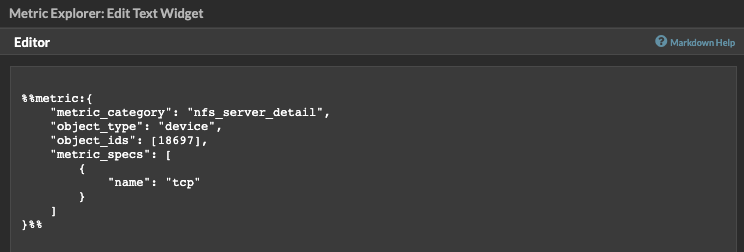
| Note: | The following metric queries are unsupported in the text box widget:
|
Metric query examples for the text box widget
The following examples show you how to write top-level, or base, metric queries for application, device, and network objects. You can also write a query for detail metrics.
Application metrics
To specify the All Activity object, the object_ids is "0".
This example query shows how you can retrieve HTTP metrics from the All Activity application object, and displays the following output: "Getting [value] HTTP requests and [value] HTTP responses from All Activity."
Getting
%%metric:{
"object_type": "application",
"object_ids": [0],
"metric_category": "http",
"metric_specs": [{"name":"req"}]
}%%HTTP requests and
%%metric:{
"object_type": "application",
"object_ids": [0],
"metric_category": "http",
"metric_specs": [{"name":"rsp"}]
}%%
HTTP responses from All Activity.
Device metrics
You must specify either a client ("_client") or server ("_server") in the metric_category. To retrieve metrics for a specific device, specify the device object ID number in object_ids. To retrieve the device object ID (deviceOid), search for the device object in the ExtraHop global search. Select the device from your search results. The "deviceOid=" value will be embedded in the URL query string.
This example query shows how to retrieve metrics from a device client object, and displays the following output: "Getting [value] CLIENT DNS response errors from a specific device."
Getting
%%metric:{"object_type": "device",
"object_ids": [8],
"metric_category": "dns_client",
"metric_specs": [{"name":"rsp_error"}]
}%%
CLIENT DNS response errors from a specific device.
This example query shows how to retrieve metrics from a device server object, and displays the following output: "Getting [value] SERVER DNS response errors from a specific device."
Getting
%%metric:{
"object_type": "device",
"object_ids": [156],
"metric_category": "dns_server",
"metric_specs": [{"name":"rsp_error"}]
}%%
SERVER DNS response errors from a specific device.
Network metrics
To specify All Networks, the object_type is "capture" and the object_ids is "0." To specify a specific VLAN, the object_type is "vlan" and the object_ids is the VLAN number.
This example query shows how to retrieve metrics for all networks, and displays the following output: "Getting [value] broadcast packets from all networks."
Getting
%%metric:{
"object_type": "capture",
"object_ids": [0],
"metric_category": "net","metric_specs": [{"name":"frame_cast_broadcast_pkts"}]
}%%
broadcast packets from all networks.
This example query shows how to retrieve metrics for a specific VLAN and displays the following output: "Getting [value] broadcast packets from VLAN 3."
Getting
%%metric:{
"object_type": "vlan",
"object_ids": [3],
"metric_category": "net",
"metric_specs": [{"name":"frame_cast_broadcast_pkts"}]
}%%
broadcast packets from VLAN 3.
Group metrics
To specify a group, the object_type is "device_group." You must specify either a client ("_client") or server ("_server") in the metric_category. The object_ids for the specific group must be retrieved from the REST API Explorer.
This example query shows how to retrieve metrics for all networks, and displays the following output: "Getting [value] HTTP responses from the HTTP Client Device Group."
Getting
%%metric:{
"object_type": "device_group",
"object_ids": [17],
"metric_category": "http_client",
"metric_specs": [{"name":"req"}]
}%%
HTTP responses from the HTTP Client Device Group.
Detail metrics
If you want to retrieve detail metrics, your metric query should contain additional key parameters, such as key1 and key2:
- object_type
- object_ids
- metric_category
- metric_spec
- name
- key1
- key2
| Important: | You must supply the object_ids in your query. |
This example shows how to retrieve HTTP requests by URI for the All Activity application (object_ids is "0"):
%%metric:{
"object_type": "application",
"object_ids": [0],
"metric_category": "http_uri_detail",
"metric_specs": [{"name":"req"}]
}%%
This example query shows you how to retrieve HTTP requests by URIs that contain a key value for "pagead2" for the All Activity application (object_ids is "0"):
%%metric:{
"metric_category": "http_uri_detail",
"object_type": "application",
"object_ids": [0],
"metric_specs": [
{
"name": "req",
"key1": "/pagead2/"
}
]
}%%
This example query shows how to retrieve count metrics for all networks and displays the following output: "Getting [value] detail ICA metrics on all networks."
Getting
%%metric:{
"object_type": "capture",
"object_ids": [0],
"metric_category": "custom_detail",
"metric_specs": [{
"name":"custom_count",
"key1":"network-app-byte-detail-ICA"
}]
}%%
detail ICA metrics on all networks.
This example query shows how to retrieve a custom dataset statistic with topn keys and percentiles, and displays the following output: "The fifth percentile is: [value]."
The fifth percentile is:
%%metric:{
"object_type": "vlan",
"object_ids": [1],
"metric_category": "custom_detail",
"metric_specs": [{
"name": "custom_dset",
"key1": "myCustomDatasetDetail",
"key2": "/10.10.7/",
"calc_type": "percentiles",
"percentiles": [5]
}]
}%%
.
| Note: | Sampleset metrics are unsupported in the text box widget. For example, adding the "calc_type": "mean" parameter to your text box query is unsupported. |
Edit a dashboard region
Dashboard regions, which contain charts and widgets, are highly customizable. As you work with dashboards, you might need to frequently change or copy a region. You can only delete, resize, or rearrange a region by editing the dashboard layout.
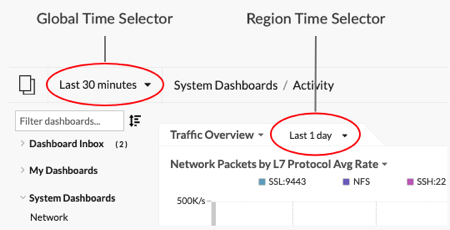
Edit dashboard properties
To rename a dashboard, change the theme, or change the URL, you must edit the dashboard properties. When you create a dashboard, you have an opportunity to specify dashboard properties. However, you can change dashboard properties at any time.
-
Click the command menu in the upper right corner of the page and then
select Dashboard Properties.
Present a dashboard
You can set your dashboard to display in fullscreen mode for presentations or for your network operation center screens.
The fullscreen mode provides the following viewing options:
- You can view and interact with the entire dashboard while in Presentation Mode.
- You can view a continuous cycle of each chart in the dashboard in a Widget Slideshow.
- You can view a single region in fullscreen display.
To present an entire dashboard in fullscreen display, complete the following steps:
-
In the upper right corner of the page, click the command menu and select one of the
following options:
- Presentation Mode
- The dashboard dock and top navigation menus collapse. You can interact with the time interval and dashboard components while in presentation mode.
- Widget Slideshow
- A continuous cycle of charts and widgets in fullscreen display begins. Select how long you want each widget to display (for example, 20 seconds, 15 seconds, etc.). Click the x icon in the upper right corner of the screen to return to the dashboard.
Tip: To open a dashboard in Presentation Mode, add /presentation to the end of the URL and then bookmark it. For example: https://<extrahop_ip>/extrahop/#/Dashboard/437/presentation
Share a dashboard
By default, all custom dashboards you create are private, which means that no ExtraHop users can view or edit your dashboard. However, you can share your dashboard by granting view or edit access to other ExtraHop users and groups.
Here are some importance considerations about sharing dashboards:
- How a user interacts with a shared dashboard and the information they can view in the ExtraHop system is determined by user privileges. For example, you can add a user with the Restricted read-only privilege, which allows that user to only view the dashboards that you share with them in the ExtraHop system. For more information, see the User privileges section in the ExtraHop Administrators Guide.
- When you grant a user edit permission, that user can modify and share the dashboard with others, and add it to a collection. However, other users cannot delete the dashboard. Only the dashboard owner can delete a dashboard.
- Group information is imported into the ExtraHop system from LDAP (such as OpenLDAP or Active Directory). User information is available after an ExtraHop user logs in to their account.
- To share a dashboard with a non-ExtraHop user, you can create a PDF file of the dashboard.
- You can create a scheduled dashboard report, which sends the PDF file of the dashboard to any email recipient on a regular basis. (Consoles only.)
-
Click the command menu in the upper right corner of the dashboard page and
select Share.
Remove access to a dashboard
You can remove or modify dashboard access that you granted to users and groups.
- Log in to the ExtraHop system through https://<extrahop-hostname-or-IP-address>.
- At the top of the page, click Dashboards.
- From the dashboard dock, select the custom dashboard that you want to modify.
-
Click the command menu in the upper right corner of the page and select
Share.
-
Remove access for users or groups by completing one of the following
steps:
- Remove all access for a user or group by clicking the red delete (x) icon next to the user or group name.
- Remove edit access by selecting Can view from the drop-down list next to the user or group name.
- Click Save.
Create a dashboard collection
You can create a collection to organize dashboards that you own and that have been shared with you.
Here are some important considerations about dashboard collections:
- Your user privileges determine whether you can create and share collections.
- You can add any dashboard to a collection that you own or have permission to view or edit.
- You can add a dashboard to multiple collections.
- You can share a collection if you own or have edit permission for all of the dashboards in that collection.
-
Type the name of a dashboard in the Contents drop-down
list and then select from the search results.
The name of the owner is displayed for each added dashboard.
Tip: The dashboard at the top of the list is displayed by default when the collection is selected in the dashboard dock. Click and drag the icon next to a dashboard name to re-order the list. 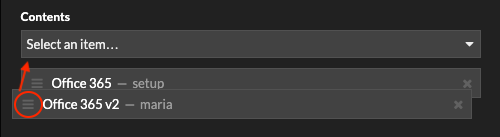
Share a dashboard collection
By default, all dashboard collections are private, which means that no other users can view or edit your collection. However, you can share your collection with other users and groups.
Here are some important considerations about sharing dashboard collections:
-
Click Add.
The user or group is displayed in a list of shared users.
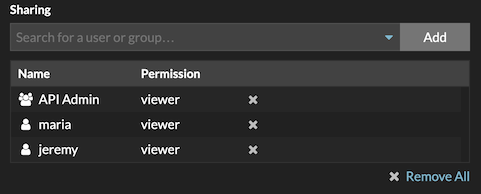
Tip: Remove a user or group by clicking the remove (X) icon next to the name.
Export data
You can export chart data from the ExtraHop system in CSV and XLSX formats.
You can also create PDFs of ExtraHop charts, pages, and dashboards.
Create a PDF file
You can export data from a dashboard, protocol page, or individual chart as a PDF file.
-
Find the dashboard or protocol page that contains the data you want to export
and complete of one of the following steps:
- To create a PDF file of the entire page, click the command menu in the upper right
corner of the page and select Print from a sensor or
Export to PDF from a console.
- To create a PDF file of an individual chart or widget, click the chart title and select Print from a sensor or select Export to PDF from the drop-down menu on a console.
- To create a PDF file of the entire page, click the command menu
Customize the format of a PDF file
When creating a PDF file of a dashboard or protocol page from a console, you have several options for customizing the appearance of your PDF file.
Next steps
The PDF file will download to your local computer. Each PDF file includes the dashboard title and time interval. Click View report on ExtraHop to open the original dashboard set to the time interval specified in the PDF file.Create a scheduled dashboard report
You can email a PDF file of selected dashboards to one or more recipients by creating a scheduled dashboard report on a console.
Create a dashboard report (Reveal(x) Enterprise)
When you create a scheduled dashboard report, you can specify how often the report is emailed and the time interval for the dashboard data included in the PDF file.
Before you begin
- Your user account must have limited write or higher privileges.
- You must log in to a Reveal(x) Enterprise console that is configured to send emails.
- You can only create a report for dashboards you own or have shared access to.
- If you create a report for a dashboard that is later deleted or becomes inaccessible to you, an email is still sent to recipients. However, the email does not include the PDF file and includes a note that the dashboard is unavailable to the report owner.
-
Click the System Settings icon
 and then click Dashboard
Reports.
and then click Dashboard
Reports.
Next steps
- To stop sending a dashboard report, clear the Enable report checkbox or delete the report.
Create a dashboard report (Reveal(x) 360)
When you create a scheduled dashboard report, you can specify how often the report is emailed and the time interval for the dashboard data included in the PDF file.
Before you begin
- Your user account must have limited write or higher privileges.
- You must log in to a Reveal(x) 360 console.
- You can only create a report for dashboards you own or have shared access to.
- If you create a report for a dashboard that is later deleted or becomes inaccessible to you, an email is still sent to recipients. However, the email does not include the PDF file and includes a note that the dashboard is unavailable to the report owner.
-
Click the System Settings icon and then click Dashboard
Reports.
Next steps
- To stop sending a dashboard report, clear the Enable report checkbox or delete the report.
Chart types
Dashboard charts in the ExtraHop system offer multiple ways to visualize metric data, which can help you answer questions about your network behavior.
- To learn how a metric changes over time, select a time-series chart such as the area, column, line, line & column, or status chart.
- To learn how a metric value compares to a complete set of data, select a distribution chart such as the box plot, candlestick, heatmap, or histogram chart.
- To learn the exact metric value for a time period, select a total value chart such as the bar, list, pie, table, or value chart.
- To learn the alert status of this metric, select the list, status, or value chart.
Find more answers in the Charts FAQ.
The following table provides a list of chart types and descriptions. Click on the chart type to see more details and examples.
| Chart Type | Description | Type |
|---|---|---|
| Area chart | Displays metric values as a line that connects data points over time, with the area between the line and axis filled in with color. | Time-series |
| Column chart | Displays metric data as vertical columns over a selected time interval. | Time-series |
| Line chart | Displays metric values as data points in a line over time. | Time-series |
| Line & Column chart | Displays metric values as a line, which connects a series of data points over time, with the option to display another metric as a column chart underneath the line chart. | Time-series |
| Status chart | Displays metric values in a column chart and the status of an alert assigned to both the source and metric in the chart. | Time-series |
| Box plot chart | Displays variability for a distribution of metric data. Each horizontal line in the box plot includes three or five data points. | Distribution |
| Candlestick chart | Displays variability for a distribution of metric data over time. | Distribution |
| Heatmap chart | Displays a distribution of metric data over time, where color represents a concentration of data. | Distribution |
| Histogram chart | Displays a distribution of metric data as vertical bars or bins. | Distribution |
| Bar chart | Displays the total value of metric data as horizontal bars. | Total value |
| List chart | Displays metric data as a list with optional sparklines that represent data changes over time. | Total value |
| Pie chart | Displays metric data as a portion or percentage of a whole. | Total value |
| Table chart | Displays multiple metric values in a table, which can be easily sorted. | Total value |
| Value chart | Displays the total value for one or more metrics. | Total value |
Area chart
Metric data is displayed as data points over time connected by a line, with the area between the line and the x-axis filled in with color.
If your chart contains more than one metric, data for each metric is displayed as an individual line, or a series. Each series is stacked together to illustrate the cumulative value of the data.
Select the area chart to see how the accumulation of multiple metric data points over time contribute to a total value. For example, an area chart can reveal how various protocols contribute to total protocol activity.
For more information about displaying rates in your chart, see the Display rates section.
| Note: | This chart supports detection markers, which indicate detections associated with chart data. |
| Note: | Machine learning detections require a connection to ExtraHop Cloud Services. |
The following figure shows an example of an area chart.
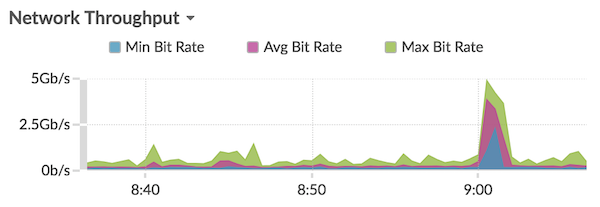
Bar chart
The total value of metric data is displayed as horizontal bars.
Select the bar chart when you want to compare the data for more than one metric for a selected time interval.
The following figure shows an example of a bar chart.
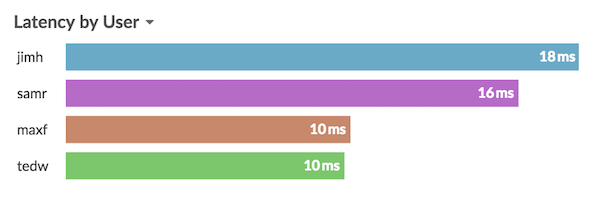
Box plot chart
The box plot chart displays variability for a distribution of metric data. You can only display data from dataset metrics, such as server processing time, in this chart.
Each horizontal line in the box plot includes three or five data points. With five data points, the line contains a body bar, a vertical tick mark, an upper shadow line, and a lower shadow line. With three data points, the line contains a vertical tick mark, an upper shadow, and lower shadow. For more information about displaying specific percentile values in your chart, see Display percentiles.
The following figure shows an example of a box plot chart.
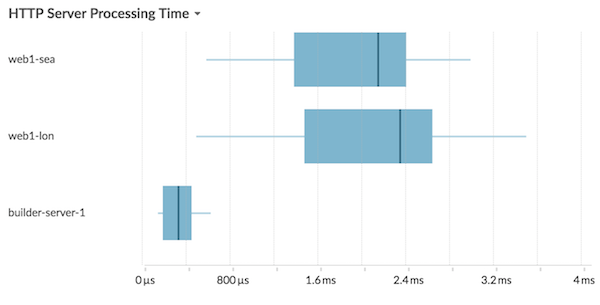
Candlestick chart
The candlestick chart displays variability for a distribution of metric data over time. You can only display data from dataset metrics or high-precision network (L2) byte and packet metrics.
Vertical lines at each time interval displays three or five data points. If the line has five data points, it contains a body, middle tick mark, an upper shadow line, and a lower shadow line. If the line has three data points, it contains a middle tick mark. For more information about displaying specific percentile values in your chart, see Display percentiles.
Select the candlestick chart to view the variability of data calculations for a specific period of time.
The following figure shows an example of a candlestick chart.
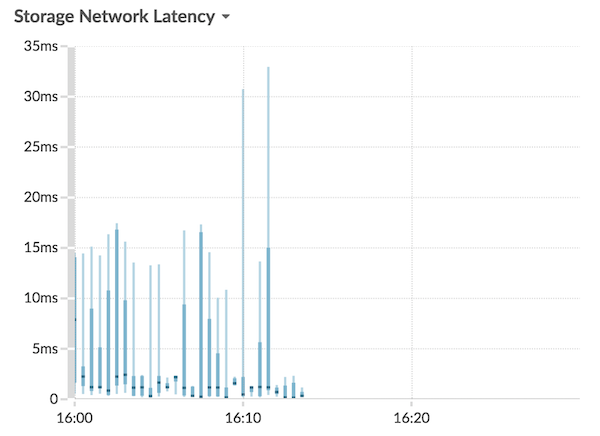
Column chart
Metric data is displayed as vertical columns over time. If your chart contains more than one metric, data for each metric is displayed as an individual column or as a series. Each series is stacked together to illustrate the cumulative value of the data.
Select the column chart to compare how accumulation of multiple metric data points at a specific time contribute to the total value.
| Note: | This chart supports detection markers, which indicate detections associated with chart data. |
The following figure shows an example of a column chart.
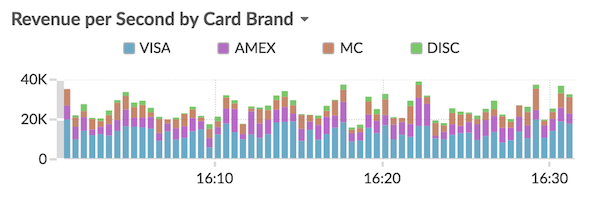
Heatmap chart
The heatmap chart displays a distribution of metric data over time, where color represents a concentration of data. You can only select a dataset metric to display in the chart, such as server processing time or round trip time.
Select the heatmap when you want to identify patterns in the distribution of data.
- The heatmap legend displays the color gradient that corresponds to the data range in the chart. For example, the darker color on the heatmap indicates a higher concentration of data points.
- The default data range is between the 5th and 95th percentiles, which filters outliers from the distribution. Outliers can skew the scale of data displayed in your chart, making it more difficult to spot trends and patterns for the majority of your data. However, you can choose to view the full range of data by changing the default filter in the Options tab. For more information, see Filter outliers.
- The selected theme, such as Light, Dark, or Space, affects whether a dark or light color indicates a higher concentration of data points.
The following figure shows an example of a heatmap chart.
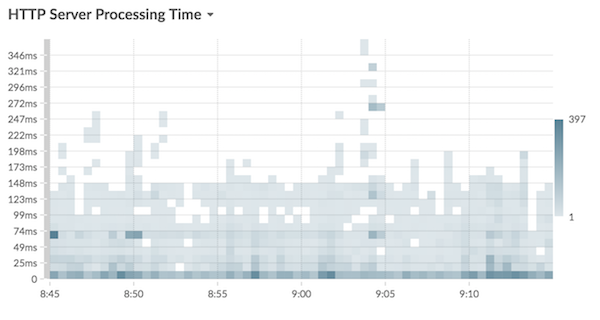
Histogram chart
The histogram chart displays a distribution of metric data as vertical bars, or bins. You can only select a dataset metric to display in this chart, such as server processing time or round trip time.
Select the histogram chart to view the shape of how data is distributed.
- The default data range is from the 5th to 95th percentile (5th-95th), which filters outliers from the distribution. The minimum to maximum (Min-Max) view displays the full data range. Click the magnifying glass in the upper right corner of the chart to toggle between the two views.
- Data is automatically distributed into bins on either a linear or log scale based on the data range. For example, when the data range spans several orders of magnitude, data is placed into bins on a log scale. Min-Max (log) appears in the upper right corner of the chart.
- Click-and-drag to zoom in on multiple bins or a specific bin. Click the magnifying
glass again in the upper right corner of the chart to zoom out to the original view
(either 5th-95th or Min to Max).
Note: Zooming in to view a custom time interval does not change the global or region time interval. - Your toggle selection (between the 5th-95th and Min-Max views) will persist for your chart, but not for the users that you shared your dashboard and chart with. To set a persistent toggle selection before sharing a dashboard, see Filter outliers.
The following figure shows an example of a histogram chart.
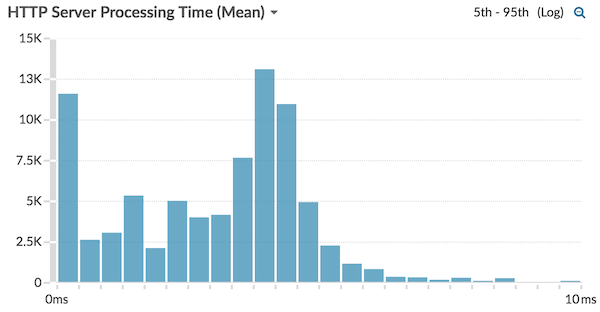
| Note: | This chart does not support baselines or threshold lines. |
Line chart
Metric data is displayed as data points over time that are connected in a line. If your chart contains more than one metric, data for each metric is displayed as an individual line or as a series. Each series overlaps.
Select the line chart to compare changes over time.
| Note: | This chart supports detection markers, which indicate detections associated with chart data. |
The following figure shows an example of a line chart.
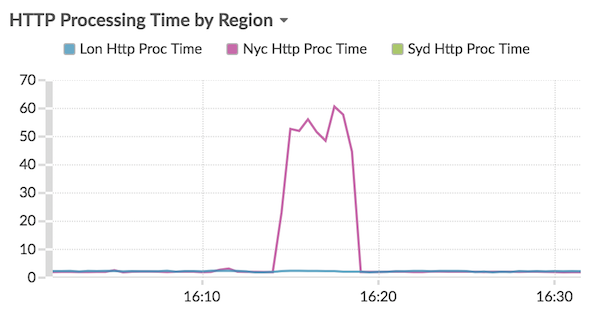
Line & column chart
Metric data is displayed as data points over time connected by a line, with the option to display a column chart underneath the line chart. For example, if your chart contains more than one metric (for example, HTTP Requests and HTTP Errors), you can select Display as Columns to display one of the metrics as a column chart underneath the line chart.
Columns are displayed in the color red by default. To remove the red color, click Options and deselect Display columns in red.
Select the line & column chart to compare different metrics at different scales in one chart. For example, you can view error rates and the total number of HTTP responses in one chart.
| Note: | This chart supports detection markers, which indicate detections associated with chart data. |
The following figure shows an example of a line & column chart.
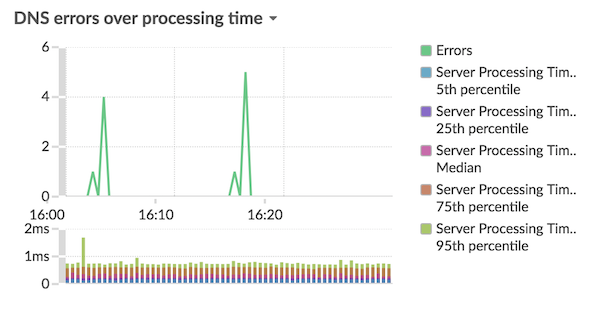
List chart
Metric data is displayed as a list. Select the list chart to view long lists of metric values, such as detail metrics.
- Add a sparkline, which is a simple area chart placed inline with the metric name and value. A sparkline shows how data changed over time. Click the Options tab and select Include sparklines.
- Display the metric value in an alert status color. Different colors indicate the severity of the configured alert. For example, if an alert threshold is crossed for a metric that is displayed in the list chart, the value for that metric appears in red. Click the Options tab and select Color indicates alert status.
| Note: | This chart does not support baselines or threshold lines. |
The following figure shows an example of a list chart.
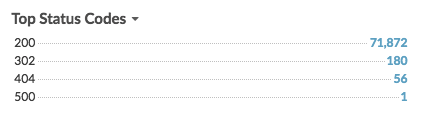
Pie chart
Metric data is displayed as a portion or percentage of a whole. If your chart contains more than one metric, data for each metric is represented as single slice, or series, in the pie chart.
Select the pie chart to compare the metric values that are mutually exclusive, such as status code detail metrics for the top-level HTTP Response metric.
- Display as a donut chart. Click the Option tab and select Show total value.
- Specify the decimal precision, or the number of digits, displayed in your chart. Percentile precision is useful for displaying ratios of data, especially for service-level agreements (SLAs) that might require precise data for reporting. Click the Options tab, and in the Units section, select Show percents instead of counts. Then select 0.00% or 0.000% from the drop-down list.
The following figure shows an example of a pie chart.
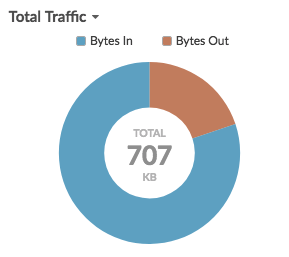
Status chart
Metric data is displayed in a column chart. The color of each column represents the most severe alert status of the configured alert for the metric. You can only select one source and metric to display in this chart.
To view the status of all of the alerts associated with the selected metric category, click Show Related Alerts. A list of alerts is then displayed below the column chart.
Select the status chart to see how data and the alert status for your metric change over time.
| Note: | This chart does not support baselines. |
The following figure shows an example of a status chart.
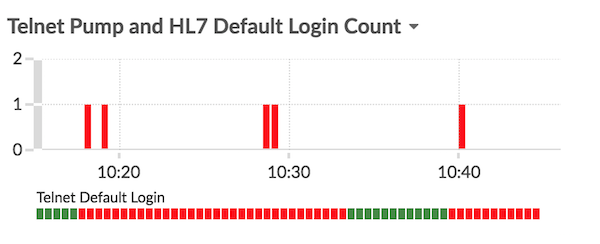
Table chart
Metric data is displayed across rows and columns in a table. Each row represents a source. Each column represents a metric. You can add multiple sources (of the same type) and metrics to a table.
| Note: | This chart does not support baselines or threshold lines. |
The following figure shows an example of a table chart.
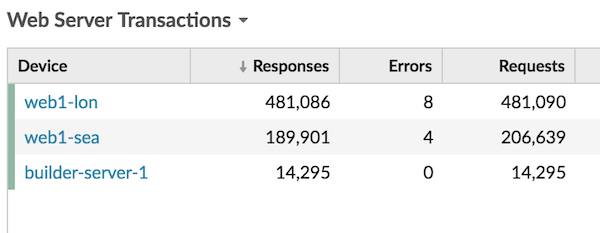
Value chart
The total value for one or more metrics is displayed as a single value. If you select more than one metric, metric values are displayed side-by-side.
Select the value chart to see the total value of important metrics, such as the total number of HTTP errors occurring on your network.
- Add sparklines, which is a simple area chart placed underneath the metric value. A sparkline shows how data changed over time. Click the Options tab and select Include sparklines.
- Display the metric value in an alert status color. Different colors indicate the severity of the configured alert. For example, if an alert threshold is crossed for a metric, the value appears in red. Click the Options tab and select Color indicates alert status.
| Note: | This chart does not support baselines or threshold lines. |
The following figure shows an example of a value chart.
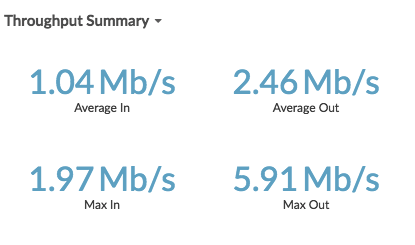
Create a chart
Charts are an essential tool for visualizing, analyzing, and understanding network behavior. You can create a custom chart from a dashboard or protocol page to visualize data from any of the 4,000+ built-in metrics or custom metrics available in the ExtraHop system. For example, if you observe an interesting server metric while troubleshooting, you can create a chart to visualize and further analyze that metric. Customized charts are then saved to dashboards.
-
Click the command menu in the upper right corner of the page and then
select Create Chart.
Next steps
After you create a chart, learn more about working with dashboards:
Copy a chart
You can copy a chart from a dashboard or protocol page and then save the copied chart to a dashboard. Copied widgets are always placed into a new region on the dashboard, which you can later modify.
| Tip: | If you want to copy a dashboard chart or text box without creating a
new region, click the command menu |
-
Click the title.
Note: You cannot click the title of a text box widget. To copy a text widget, you must first edit the dashboard layout. Click the command menu in the upper right corner of the text box widget, and then complete step
4.
Next steps
The chart is copied into a new region on the dashboard that is in Edit Layout mode. You can now edit your dashboard or chart in the following ways:Drill down
An interesting metric naturally leads to questions about the factors associated with that metric value. For example, if you find a large number of DNS request timeouts on your network, you might wonder which DNS clients are experiencing those timeouts. In the ExtraHop system, you can easily drill down from a top-level metric to view the devices, methods, or resources associated with that metric.
When you drill down on a metric by a key (such as a client IP address, method, URI, or resource), the ExtraHop system calculates a topnset of up to 1,000 key-value pairs. You can then investigate these key-value pairs, referred to as detail metrics, to learn which factors are linked to the interesting activity.
Drill down from a dashboard or protocol page
Clicking a metric in a chart or legend helps you see which key, such as client IP address, server IP address, method, or resource, contributed to that value.
The following steps show you how to locate a metric and then drill down:
-
Click on a metric value or a metric label in the chart legend, as shown in the
following figure. A menu appears.
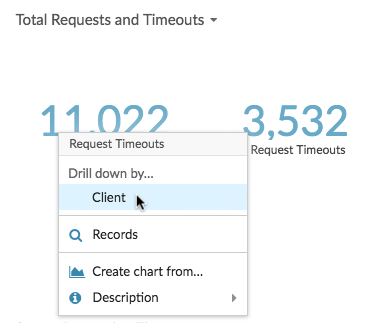
Tip: On a protocol page, you can also click a drill-down shortcut button in the Drill Down section, located in the upper right corner of the page. The type of shortcut buttons vary by protocol. 
Next steps
Drill down on network capture and VLAN metrics
Click an interesting top-level metric about network activity on a Network capture or VLAN page to identify which devices are linked to that activity.
| Note: | For information about how to drill down on metrics from a flow network or flow network interface page, see the Drill down from a dashboard or protocol page section. |
- Log in to the ExtraHop system through https://<extrahop-hostname-or-IP-address>.
- Click Assets.
- Click Networks in the left pane.
- Click a network capture or VLAN interface name.
- Click a network layer in the left pane, such as L3 or L7 Protocols. Charts that display metric values for the selected time interval appear. For most protocols and metrics, a Device table also appears at the bottom of the page.
- Click the chart data, which updates the list to display only the devices that are associated with the data.
- Click a device name. A Device page appears, which displays traffic and protocol activity associated with the selected device.
Drill down from a detection
For certain detections you can drill down to see more details about the metric or key that contributed to the unusual behavior. The metric name or key appears as a link at the bottom of an individual detection.
| Note: | Detections with metrics or keys that do not have detail metrics do not include a
drill down option. Detections that only display anomalous protocol activity instead
of a metric also do not include a metric drill down option. For example, you cannot
drill down on a detection for Anomalous DNS Client activity, as shown in the figure
below. Instead, click the links for the device or application name,
Activity Map, or Records to learn
more about the anomalous activity.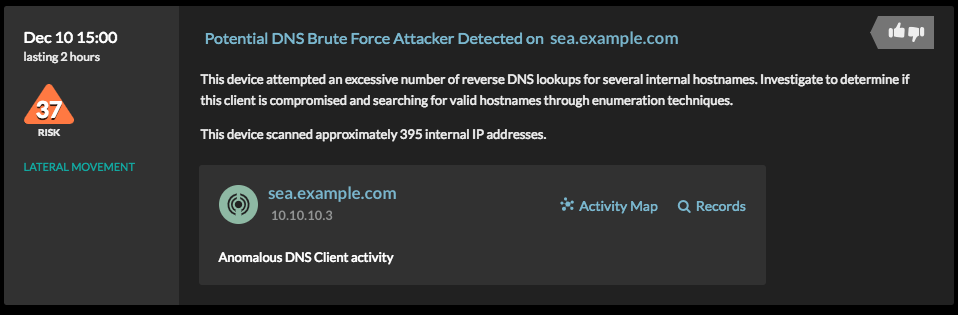 |
-
Find an interesting detection that is associated with a metric and click the
metric name or key. In the following figure, by clicking on the response code,
we can drill down to see all of the clients that received DNS responses with
NXDOMAIN/QUERY:A.
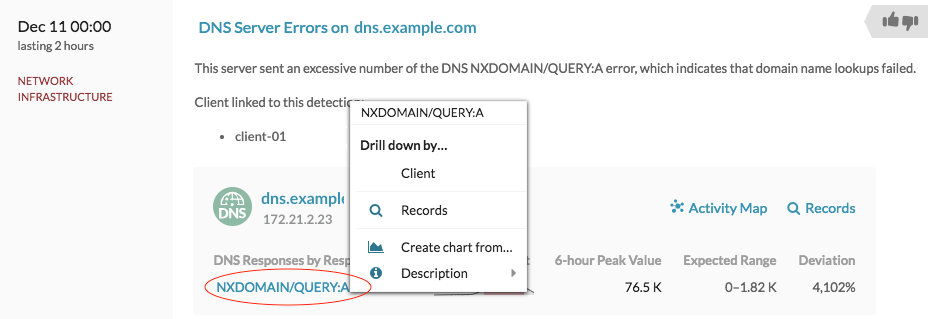
Drill down from an alert
Click the metric name or key in a threshold alert to see which key, such as client, server, method, or resource, contributed to the metric value or unusual behavior.
-
Click a metric name or key, as shown in the following figure.
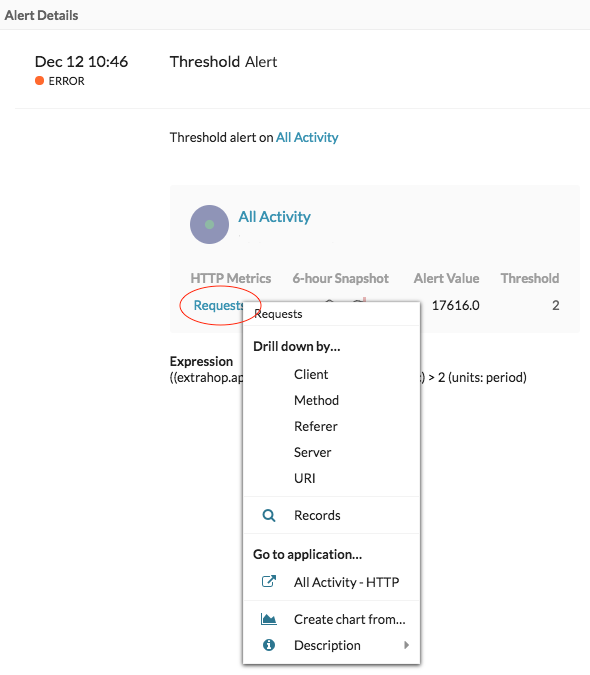
Investigate detail metrics
After you drill down on a metric from a dashboard, protocol page, detection, or alert, you can investigate metric values by key on a detail metric page. Filter metric data or select different keys, such as status codes or URIs, to view data from different perspectives.
The following figure shows you how to filter, pivot, sort, or export data on a detail metric page.
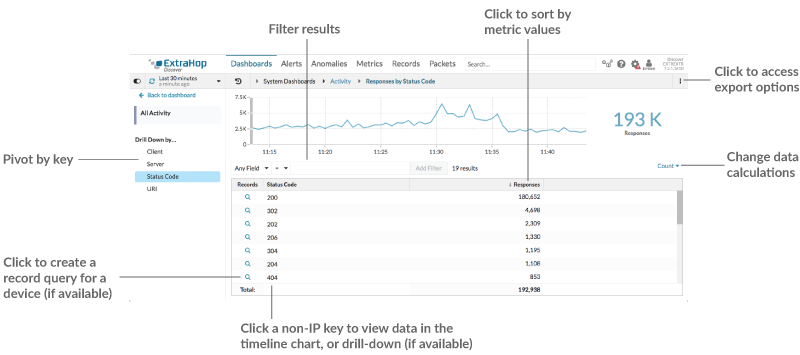
If you drilled-down on a metric by IP, Client, or Server, IP addresses and hostnames (if observed from DNS traffic) appear in the table. Additional options are now available to you. For example, you can directly navigate to a client or server protocol page, as shown in the following figure.
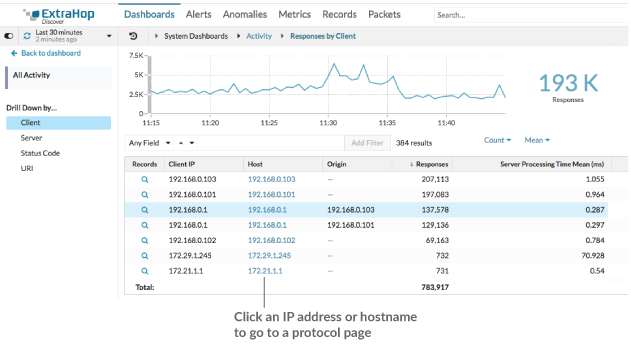
- Filter results
-
A detail page can contain up to 1,000 key-value pairs. There are two ways to find specific results from data: filter results or click a key in the table to create another drill-down filter.
To filter results, click Any Field, and then select a field, which varies by key. For example, you can select Network Locality for Client or Server keys. Then, select one of the following operators:
- Select = to perform an exact string match.
- Select ≈ to perform an approximate string match. The ≈
operator supports regular expression.
Note: To exclude a result, enter a regular expression. For more information, see Create regular expression filters. - Select ≉ to exclude an approximate string match from your results.
- Select > or ≥ to perform a match for values greater than (or equal to) a specified value.
- Select < or ≤ to perform a match for values less than (or equal to) a specified value.
- Click Add filter to save the filter settings. You can save multiple filters for one query. Saved filters are cleared if you select another key from the Details section in the left pane.
To complete the filter, enter or select a value that you want to filter results by, and then click Add Filter.
- Investigate threat intelligence data (ExtraHop Reveal(x) Premium and Ultra only)
- Click the red camera icon to
view threat intelligence details about
a suspicious host, IP address, or URI found in detail metric data.
- Highlight a metric value in the top chart
- Select an individual row or multiple rows to change chart data in the top chart on the detail metric page. Hover over data points in the chart to view more information about each data point.
- Pivot to more data by key
- Click key names in the Details section to see more detail metric values, broken down by other keys. For IP address or host keys, click a device name in the table to navigate to a Device protocol page, which displays traffic and protocol activity associated with that device.
- Adjust the time interval and compare data from two time intervals
- By changing the time interval, you can view and compare metric data from different times
in the same table. For more information, see Compare time intervals to find the metric delta.
Note: The global time interval in the upper left corner of the page includes a blue refresh icon and gray text that indicates when the drill-down metrics were last polled. To reload the metrics for the specified time interval, click the refresh icon in the Global Time Selector display. For more information, see View the latest data for a time interval. - Sort metric data in columns
- Click the column header to sort by metrics to view which keys are associated with the largest or smallest metric values. For example, sort on processing time to see which clients experienced the longest website load times.
- Change data calculation for metrics
- Change the following calculations for metric values displayed in the table:
- If you have a count metric in the table, click Count in the Options section in the left pane and then select Average Rate. Learn more in the Display a rate or count in a chart topic.
- If you have a dataset metric in the table, click Mean in the Options section in the left pane and then select Summary. When you select Summary, you can view the mean and the standard deviation.
- Export data
- Right-click a metric value in the table to download a PDF, CSV, or Excel file.
Drill-down a second time by a key filter
After you first drill down on a top-level metric by key, a detail page appears with a topnset of metric values broken down by that key. You can then create a filter to drill down a second time by another key. For example, you can drill down on HTTP responses by status code, and then drill down again by the 404 status code to find more information about the servers, URIs, or clients associated with that status code.
| Note: | The option to drill-down a second time is only available for certain topnsets. |
The following steps show you how to drill down from a chart and then drill down again from a detail metric page:
-
In the Drill down by… section, select a key, as shown in
the following figure.
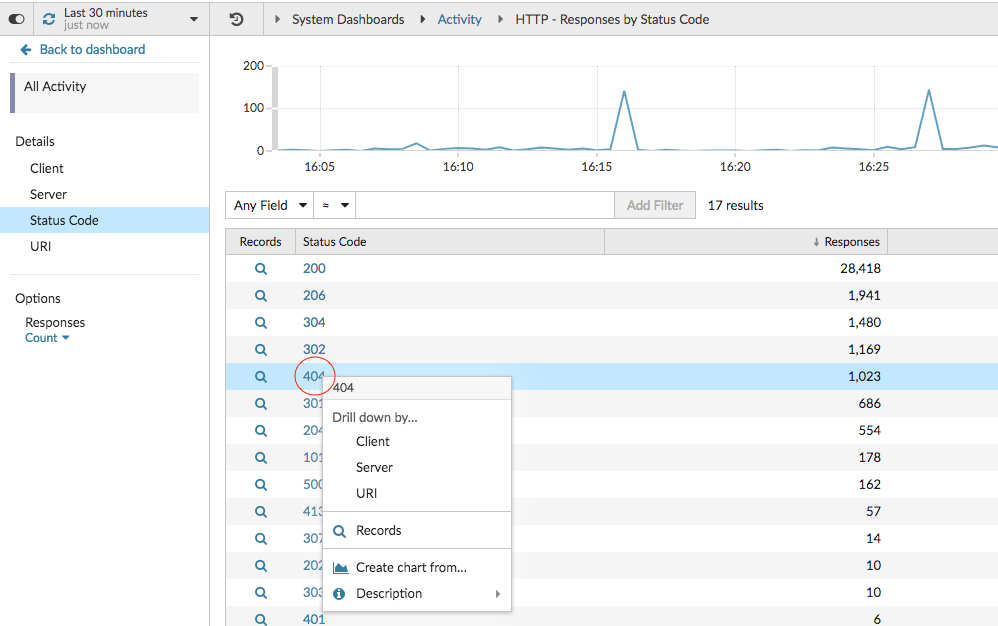
The key filter appears above the table. You can now view all the detail metrics associated with that single key. -
To remove this filter from the table and then apply the filter to the top
chart, click the x icon, as shown in the following
figure.
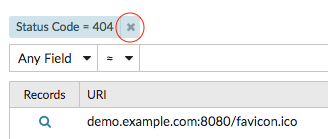
The filter in the chart persists as you select other keys in the Details section.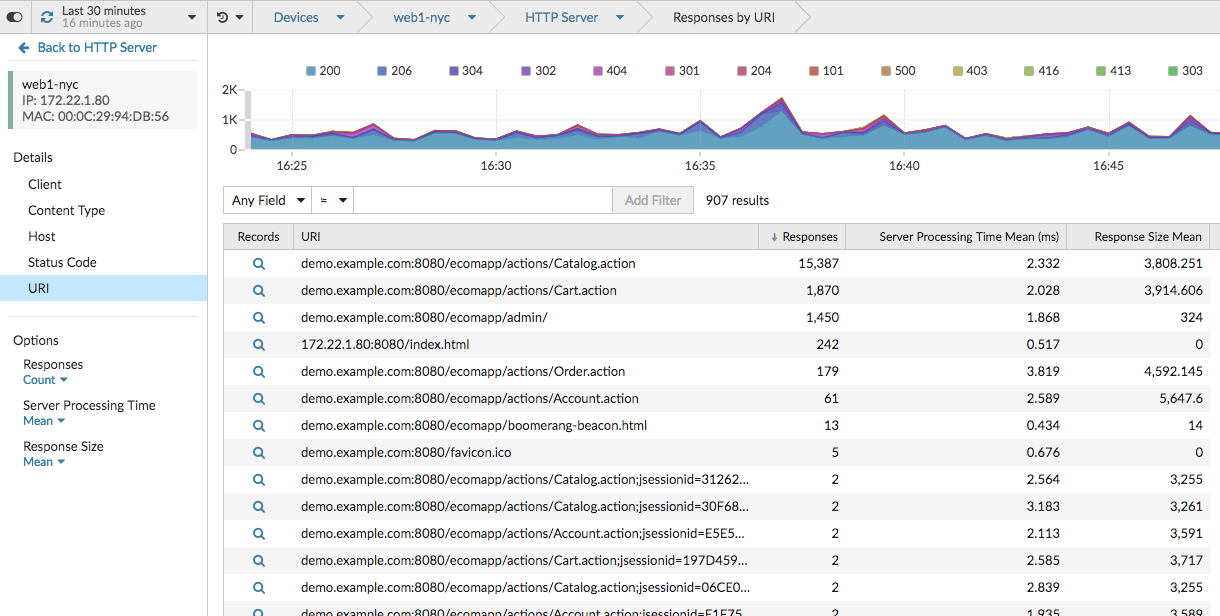
Add detail metrics to a chart
If you want to quickly monitor a set of detail metrics in a dashboard, without repeatedly performing the same drill-down steps, you can drill down on a metric when editing a chart in the Metric Explorer. Most charts can display up to 20 of the top detail metric values broken down by key. A key can be a client IP address, hostname, method, URI, referrer, or more. Table and list widgets can display up to 200 top detail metric values.
For example, a dashboard for monitoring web traffic might contain a chart displaying the total number of HTTP requests and responses. You can edit this chart to drill down on each metric by IP address to see the top talkers.
The following steps show you how to edit an existing chart and then drill down to display detail metrics:
-
Select a key from the drop-down list.
Note: If you have more than one source selected in your metric set, such as two devices, the sources are automatically combined into an ad hoc source group as you drill down. You cannot deselect the Combine Sources checkbox. To view drill-down metrics for each source, you must remove a source from the metric set and then click Add Source to create a new metric set. If detail metric data for a common key is available for all of the metrics in a metric set, the key for the detail metric automatically appears in the drop-down list, as shown in the following figure. If a key in the list is grayed out, the detail metric associated with that key is unavailable for all of the metrics in that metric set above. For example, client, server, and URI data are available for both HTTP Requests and HTTP Responses metrics in the metric set.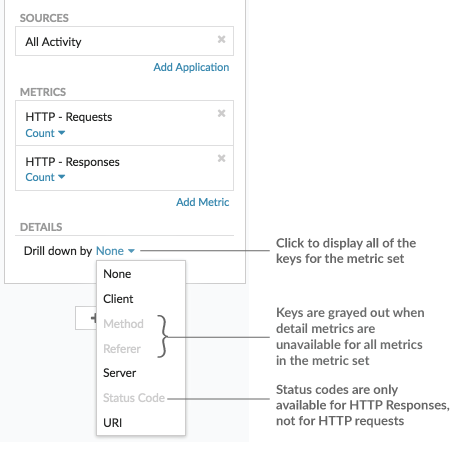
-
To remove a drill-down selection, click the x
icon.
Note: You can display an exact key match per metric, as shown in the following figure. Click the drill-down metric name (such as All Methods) to select a specific drill-down metric key (such as GET) from the drop-down list. If a key appears gray (such as PROPFIND), drill-down metric data is unavailable for that specific key. You can also type a key that is not in the drop-down list. 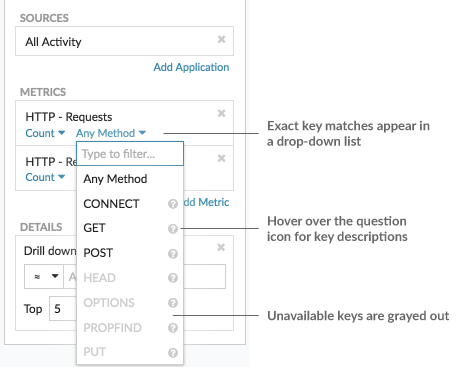
Display a rate or count in a chart
You can visualize errors, responses, requests, and other count metric data in a chart as a per second rate or as a total number of events over time. For high-precision Network Bytes and Network Packets metrics, you have the additional options to view the maximum, minimum, and average rate per second in a chart.
When editing a chart in the Metric Explorer, you can select a count or rate by clicking the drop-down link below the metric name, as shown in the following figure.
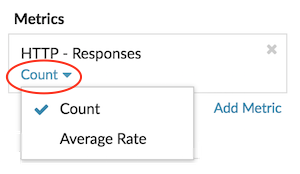
In addition, you can select from the following options for displaying rates and counts. Note that the type of metric you select affects which rate or count is automatically displayed.
- Average rate
- Calculates the average metric value per second for the selected time interval. For network-related metrics, such as Response L2 Bytes or NetFlow Bytes, the average rate per second is automatically displayed.
- Count
- Displays the total count of events for the selected time interval. For the majority of count metrics, such as errors, requests and responses, the count is automatically displayed.
- Rate summary
- Calculates the maximum, minimum, and average metric value per second. For high-precision metrics, such as Network Bytes and Network Packets, these three rates are automatically displayed in the chart as a summary. You can also select to view only the maximum, minimum, or average rate in a chart. High-precision metrics are collected with a 1-second level of granularity and are only available when you configure your chart with a network or device source.
Display the average rate in a chart
If you configured a chart with an error, response, request, or other type of count metric, then the total number of events over time is automatically displayed. You can further edit the chart to display an average rate per second for your data.
Before you begin
Create a chart and select a count metric, such as errors, requests, or responses, as your source. Save your chart to a dashboard.-
Click Count below the metric name.
Display the maximum rate in a chart
To display a maximum rate per second of a metric in a chart, you must configure a chart with a high-precision metric.
The following steps show you how to configure a chart that displays a maximum rate:
-
Complete one of the following steps:
- To create a new chart, click the command menu in the upper right
corner of the page and then select Create
chart.
- To edit an existing chart, click Dashboards at the top of the page. From the dashboard dock, select a dashboard containing the chart that you want to edit. Click the chart title and select Edit.
- To create a new chart, click the command menu
-
Click Rate Summary below the metric name.
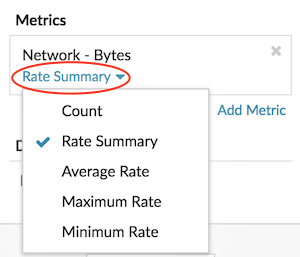
Display percentiles or a mean in a chart
If you have a set of servers that are critical to your network, viewing the 95th percentile of server processing time in a chart can help you gauge how much servers are struggling. Percentiles are statistical measures that can show you how a data point compares to a total distribution over time.
You can only display percentile value and mean (average) calculations in charts that contain dataset or sampleset metrics. Dataset metrics are associated with timing and latency, such as server processing time and round trip time metrics. Sampleset metrics provide summaries of detail timing metrics, such as server processing time broken down by server, method, or URI.
When editing a chart in the Metric Explorer, you can select percentiles or the mean by clicking the drop-down link below the dataset or sampleset metric name, as shown in the following figure.
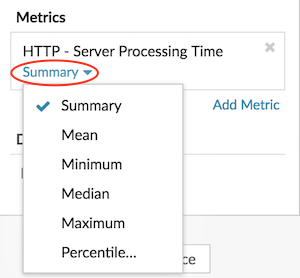
The Metric Explorer provides the following calculations for displaying percentiles and the mean.
- Summary
-
For dataset metrics, the Summary is a range that includes the 95th, 75th, 50th, 25th, and 5th percentile values.
For example, each line in a candlestick chart contains five data points. If Summary is selected, the main body of the line represents the range from the 25th percentile to the 75th percentile. The middle tick mark represents the 50th percentile (median). The upper shadow above the body line represents the 95th percentile. The lower shadow represents the 5th percentile.
For sampleset metrics, the Summary displays the +/-1 standard deviation and the mean values. In the candlestick chart, the vertical tick mark in the line represents the mean, and the upper and lower shadows represent the standard deviation values.
- Mean
- The calculated average of data.
- Median
- The 50th percentile value of a dataset metric.
- Maximum
- The 100th percentile value of a dataset metric.
- Minimum
- The 0th percentile value of a dataset metric.
- Percentile
- A custom range of three or five percentile values for a dataset metric.
Display a custom range of percentiles
You can display a custom range of three or five percentile values for server processing time or round trip time metrics. You cannot display custom percentiles in a pie or status chart.
The following steps show you how to add a custom percentile range to an existing dashboard chart:
Before you begin
Create a chart and select a dataset or sampleset metric, and save it to a dashboard.- Log in to the ExtraHop system through https://<extrahop-hostname-or-IP-address>.
- At the top of the page, click Dashboards.
-
Launch the Metric
Explorer to edit the chart by completing the following steps:
- From the dashboard dock, select a dashboard containing the chart you want to edit.
- Click the chart title and select Edit.
- Click Summary below the metric name.
- Select Percentile... from the drop-down list.
- In the Set Percentiles field, type a number for each percentile value, separated by a comma. For example, to view the 10th, 30th, and 80th percentiles, type 10, 30, 80.
- Click Save. Your custom range is now displayed in the chart. You can toggle between your custom range and other percentile selections, such as Summary or Maximum, at any time.
- Click Save again to close the Metric Explorer.
Filter outliers in histogram or heatmap charts
Histogram and heatmap charts display a distribution of data. However, outliers can skew how the distribution displays in your chart, making it difficult to notice patterns or average values. The default filter option for these charts excludes outliers from the data range and displays the 5th-95th percentiles. You can change the filter to view the full range of data (minimums to maximums), including outliers, in your chart by completing the following procedure.
- Click the chart title and then select Edit to launch the Metric Explorer.
- Click the Options tab.
- From the Default filter drop-down list in the Filters section, select Min to Max.
- Click Save to close the Metric Explorer.
Edit metric labels in a chart legend
You can change the default metric label in a chart to a custom label. For example, you can change the default label, "Network Bytes," to a custom label such as "Throughput."
Custom labels only apply to individual charts. A custom label for a metric will persist if you copy the chart to another dashboard, share a dashboard with another user, or add new metrics to your chart.
However, if you make changes to the original metric, such as updating the data calculation (from median to 95th percentile, for example) or drilling down on the metric, the custom label will automatically clear. The label clears to prevent mislabeling or potential inaccuracy of the custom label when metric data changes.
Here are some considerations about changing the label of a chart legend:
- For detail metrics, a custom label is
automatically appended to all the keys displayed in the chart. However, you can
change the order of the key in the label by including the variable,
$KEY:
- Type $KEY errors to display 172.21.1.1 errors
- Type [$KEY] errors to display [172.21.1.1] errors
- You cannot change labels in the box plot, candlestick, heatmap, table, or status charts.
- You cannot rename metric delta or dynamic baseline labels.
Before you begin
Create a chart and select a metric.The following steps show you how to change metric labels in an existing dashboard chart:
Add a dynamic baseline to a chart
Dynamic baselines help distinguish between normal and abnormal activity in your chart data. Baselines are only supported in the area, candlestick, column, line, and line & column charts.
The ExtraHop system calculates dynamic baselines based on historical data. To generate a new data point on a dynamic baseline, the system calculates the median value for a specified period of time.
| Warning: | Deleting or modifying a dynamic baseline can delete baseline data from the system. If a dynamic baseline is not referenced by any dashboards, the data will be deleted from the system to free unused system resources. You cannot recover a dynamic baseline after it is deleted. |
Select a baseline type that best fits your environment. For example, if you regularly see dramatic changes from one day to another, select an hour-of-week baseline that compares activity seen on specific days of the week. If HTTP activity spikes on Saturdays, the hour-of-week baseline can help you compare the current spike in HTTP activity with the level seen on other Saturdays at the same hour. The following table describes how each type of baseline is calculated:
| Baseline type | Historical data | What the baseline compares | New baseline data points added |
|---|---|---|---|
| Hour of day | 10 days | Metric values from a given hour of a day. For example, every day at 2:00 PM. | Every hour |
| Hour of week | 5 weeks | Metric values for a given hour on a specific day of the week. For example, every Wednesday at 2:00 PM. | Every hour |
| Short-term trend | 1 hour | Metric values from each minute in one hour. | Every 30 seconds |
Here are some important considerations about adding a baseline to a chart:
- Dynamic baselines calculate and store baseline data. Therefore, creating a baseline consumes system resources, and configuring too many baselines might degrade system performance.
- Deleting or modifying a dynamic baseline can delete dynamic baseline data from the system.
- Detail metrics, also referred to as topnsets, are unsupported. Sampleset, maximum rate, and minimum rate metrics are also unsupported. If any of these types of metrics are selected in your chart, you will be unable to generate a dynamic baseline for this data.
- The system can begin building a dynamic baseline only if the necessary amount of historical data is available. For example, an Hour of day baseline requires 10 days of historical data. If the system has only been collecting data for six days, the baseline does not begin plotting until it has four more days worth of data.
- The system does not retroactively plot a dynamic baseline for historical data. The system only plots a dynamic baseline for new data.
- If two identical dynamic baselines exist in separate dashboards, the dashboards reuse the baseline data; however, the baselines must be identical. If you select a new baseline type, the new dynamic baseline will not share data with the previous dynamic baseline.
The following steps show you how to add a dynamic baseline to an existing dashboard chart:
-
Click Save to close the Metric Explorer and return to
the dashboard.
The ExtraHop system will begin calculating the dynamic baseline. New baseline data points are added every hour or 30 seconds, as shown in the following figure.
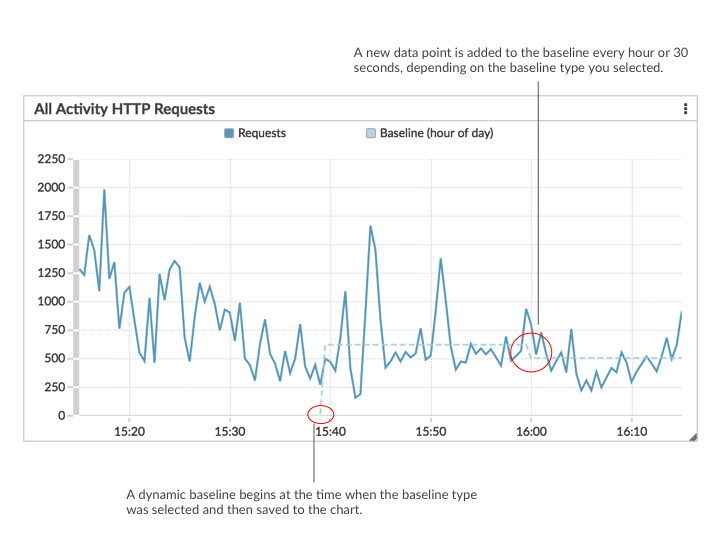
Add a static threshold line to a chart
Displaying a static threshold line in a chart can help you determine which data points are either below or above a significant value.
For example, you can create a line chart for server processing time to help you monitor the performance of an important database in your network environment. By adding a threshold line that defines a service level agreement (SLA) boundary of acceptable processing time, you can see when database performance is slowing down and address the issue.
You can add one or more threshold lines as you edit a chart with the Metric Explorer. These lines are local to the chart and not associated with other widgets or alerts. Threshold lines are only available for area, candlestick, column, line, line & column, and status charts.
The following steps show you how to add a static threshold line to an existing dashboard chart:
Display device group members in a chart
If you have a chart that displays a device group, you can view metrics by top devices in the group, instead of viewing a single value for the entire device group. Drilling down by group member in the Metric Explorer lets you view up to 20 devices in the chart.
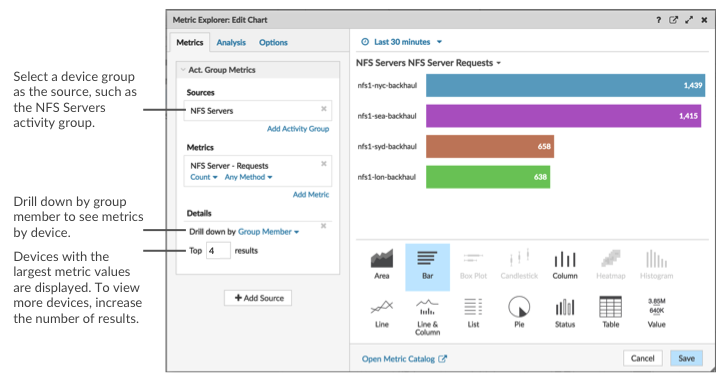
If you see fewer groups members in a chart than the number of results you specified, this could be because you selected a built-in device group with a small number of devices. For built-in device groups, devices are dynamically placed into a group based on the type of protocol traffic they are associated with or the role they are assigned.
Before you begin
Create a chart that contains a device group as the selected source. Save the chart to a dashboard.Regular expression filters
Filter your search results by writing regular expression (regex) strings in certain search fields throughout the ExtraHop system. For example, you can filter for parameters in a detail metric key, such as a number within an IP address. You can also filter by excluding specific keys or a combination of keys from charts.
- Search fields with an asterisk
- Click the asterisk to enable regex strings.
This type of field is available from the following system pages:- Filtering a table of devices
- Creating filter criteria for a dynamic device group
- Certain search fields with a trifield operator
- Click the operator drop-down to select the regex option.
This type of field is available from the following system page:- Editing a chart in Metric Explorer
- Certain search fields with a tooltip
- Hover over the tooltip in the field to see when regex is required.
This type of field is available from the following system page:- Adding record relationships to a custom metric
The following table includes examples of standard regex syntax.
| Chart Scenario | Regex filter | How it works |
|---|---|---|
| Compare HTTP status codes 200 to 404. | (200|404) | The vertical bar symbol ( | ) is the OR operator. This filter matches 200, or 404, or both status codes. |
| Display any HTTP status code that contains a 4. | [41] | Square brackets ( [ and ] ) designate a range of characters. The filter searches for every character inside the brackets, regardless of order. This filter matches any value that contains a 4 or a 1. For example, this filter can return 204, 400, 101, or 201 status codes. |
| Display all 500-level HTTP status codes. | ^[5] | The caret symbol ( ^ ) outside square brackets ( [ and ] ) means "starts with." This filter matches any value that begins with a 5. For example, this filter can return 500 and 502 status codes. |
| Display all 400 and 500-level HTTP status codes. | ^[45] | Multiple values inside square brackets ( [ and ] ) are searched individually, even when preceded by the caret symbol ( ^ ). This filter does not search for values that begin with 45, but matches all values that begin with a 4 or 5. For example, this filter can return 400, 403, and 500 status codes. |
| Display any HTTP status codes except 200-level status codes. | ^(?!2) | A question mark ( ? ) and exclamation point ( ! ) inside parentheses specify a value to exclude. This filter matches all values except values beginning with a 2. For example, this filter can return 400, 500, and 302 status codes. |
| Display any IP address with a 187. | 187. | Matches 1, 8, and 7 characters in the IP address. This filter will not return IP addresses that end in 187 because the trailing period designates that something must come after the values. If you want to search the period as a literal value, you must precede it with a backslash ( \ ). |
| Review all IP addresses containing 187.18. | 187\.18. | Matches 187.18 and anything that follows. The first period is treated literally because it is preceded by a backslash ( \ ). The second period is treated as a wildcard. For example, this filter returns results for 187.18.0.0, 180.187.0.0, or 187.180.0.0/16. This filter does not return an address that ends with 187.18, because the wildcard requires that characters follow the specified values. |
| Display any IP address except 187.18.197.150. | ^(?!187\.18\.197\.150) | Matches anything except 187.18.197.150, where ^(?!) specifies the value to exclude. |
| Exclude a list of specific IP addresses. | ^(?!187\.18\.197\.15[012]) | Matches anything except 187.18.197.150, 187.18.197.151, and 187.18.197.152, where ^(?!) specifies the value to exclude and the square brackets ( [ and ] ) specify multiple values. |
Additional filters
When you create a custom detail metric from the Metric Catalog, you can add advanced regex syntax to the Additional Filters search field in the Record Relationships section.
The regex syntax in this field must meet the following requirements:
- If your key contains multiple values, your regex syntax must include a
single capture group. A capture group is designated by parenthesis. Your
capture group determines the filter value.
- If you want to return a specific value from a detail metric key that
contains multiple record field values, the regex must follow this syntax:
$KEY:/<regex>/
For example, if your detail metric key is ipaddr:host:cipher and you only want to return the IP address value, you would type the following:
$KEY:/^([^:]+):.+/
- If your key contains multiple record field values, the values are separated by a delimiter that is specified in the trigger that is generating the key. The placement of the delimiters in your regex syntax must match the delimiters in the detail key. For example, if you have a key with three values that are separated by a delimiter that is a colon, the three values for the key in your regex syntax must be separated by two colons.
| Tip: | If you want to return all record field values in a detail metric key, type $KEY. For example, if your detail metric key is ipaddr:host:cipher, type $KEY in the search field to return all three of those field record values (IP address, hostname, and SSL cipher suite). |
Find all devices talking to external IP addresses
The following steps show you how to find all of the external IP addresses that your internal devices are talking to. You can then see if any devices are making or receiving unauthorized connections from other devices outside of your network.
| Tip: | By default, any device with an RFC1918 IP address (included in a 10/8, 172.16/12, or 192.168/16 CIDR block) that the ExtraHop system automatically discovers is classified as an internal device. Because some network environments include non-RFC1918 IP addresses as part of their internal network, you can specify the locality of an IP address on the Network Localities page. |
Monitor a device for external IP address connections
If you have an authentication server or database that should not connect to IP addresses outside of your internal network, you can create a value chart in a dashboard that tracks External Accepted and External Connected metrics. From your dashboard, you can then monitor the number of external connections for a specific device.
| Tip: | By default, any device with an RFC1918 IP address (included in a 10/8, 172.16/12, or 192.168/16 CIDR block) that the ExtraHop system automatically discovers is classified as an internal device. Because some network environments include non-RFC1918 IP addresses as part of their internal network, you can specify the locality of an IP address on the Network Localities page. |
The following steps show you how to create a value chart for these TCP metrics and then add the chart to a dashboard.
-
In the left pane in the Metric section, click the x icon
to delete each TCP metric that you do not want to view in the chart, as shown in
the following figure.
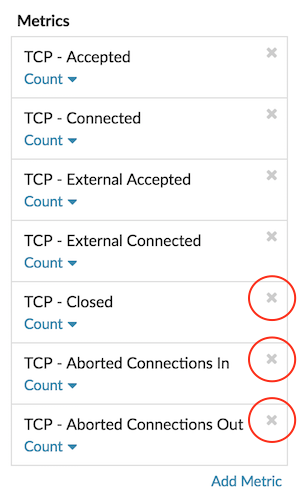
Your dashboard now contains metrics that help you track the ratio of all accepted connections to external accepted connections, and the ratio of all initiated connections to external initiated connections.
Next steps
Share a dashboardCompare time intervals to find the metric delta
Comparing metric data between two time intervals helps you see the difference, or the delta, in metric data side-by-side in the same chart. If you create a comparison and navigate to another area of the ExtraHop system, the comparison is disabled temporarily. When you return to your original page, the comparison you saved is enabled again.
-
Click Save. New metric data from the comparison time
interval is placed on the original chart.
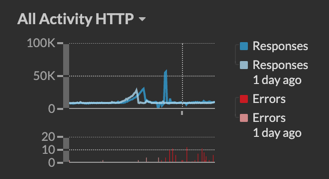
Assets
All of the metric activity collected from the data on your network is logically grouped into sections on the Assets page, where you can navigate to find the data you need.
| Video: | See the related training: Assets |
Devices
Devices, also known as assets and endpoints, are objects on your network with a MAC address or IP address that have been automatically discovered and classified by the ExtraHop system. Assign any device to a chart, alert, or trigger as a metric source. Learn more about Devices.
Device Groups
Device groups are user-defined sets of devices that can be collectively assigned as a metric source to a chart, alert, or trigger. You can create a dynamic device group that adds devices that matches your specified criteria or you can create a static device group and manually add or remove devices. The ExtraHop system also includes built-in dynamic device groups by role and by protocol activity that you can assign as a metric source. Click a role or protocol link from the Devices page to view metrics for a built-in device group.
Users
The Users page displays a list of all active users found on your network and the devices the user logged in to. The user name is extracted from the authentication protocol, such as LDAP or Active Directory. Search for devices accessed by a specific user.
| Note: | These users are not associated with user accounts for the ExtraHop system. |
Applications
Applications are user-defined containers that represent distributed systems on your network. Create an application to view all of the metric activity associated with your website traffic—web transactions, DNS requests and responses, and database transactions. See the Applications FAQ.
Basic applications that filter built-in metrics by protocol activity can be created through the ExtraHop system. Complex applications that collect custom metrics or metrics from non-L7 traffic must be created through a trigger, which requires JavaScript code. Learn more about building Triggers.
Devices
The ExtraHop system automatically discovers and classifies devices, also known as endpoints, that are actively communicating over your network, such as clients, servers, routers, load balancers, and gateways. Each device receives the highest level of analysis available, based on your system configuration.
The ExtraHop system can discover and track devices by their MAC address (L2 Discovery) or by their IP addresses (L3 Discovery). Enabling L2 Discovery offers the advantage of tracking metrics for a device even if the IP address is changed or reassigned through a DHCP request. If L3 Discovery is enabled, it is important to know that devices might not have a one-to-one correlation to the physical devices in your environment. For example, if a single physical device has multiple active network interfaces, that device is identified as multiple devices by the ExtraHop system.
After a device is discovered, the ExtraHop system begins to collect metrics based on the analysis level configured for that device. The analysis level determines the types of metrics that are generated and which features are available for organizing metric data.
Navigating devices
Click Assets from the top menu and then click Devices to display the following charts that provide insight about the active devices discovered on your network during the selected time interval:
- Active Devices
- Displays the total number of devices that have been discovered by the ExtraHop system. Click the number to view a list of all discovered devices. From the Active Devices list, you can search for specific devices or click a device name to view device details on the Device Overview page.
- New Devices
- Displays the number of devices that have been discovered within the past month and the percentage rate of change. Click the number to view a list of all of these devices.
- Devices by Role
- Displays each device role and the number of devices assigned to each role that is active during the specified time interval. Click a device role to see a built-in Device Group Overview page that includes metric data, peer IPs, and protocol activity for that group of devices. You can also add additional filter criteria and save the group as a new dynamic device group.
- Devices by Protocol Activity
- Displays a list of protocol activity found on your network. Click a protocol name or device count to see a built-in Device Group Overview page with specific metric charts about that protocol activity. Click an activity map to see all device-to-device connections. You can also add additional filter criteria and save the group as a new dynamic device group.
Device Overview page
By clicking on a device name, you can view all of the information discovered about the device by the ExtraHop system on the Device Overview page. The Device Overview page is divided into three sections: a top-level summary, a properties panel, and an activity panel.
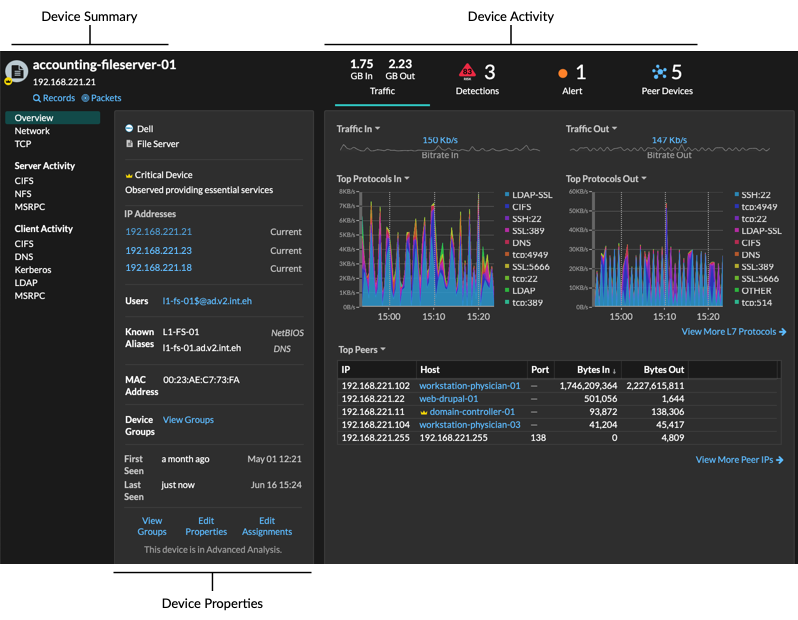
Device summary
The device summary provides information such as the device name, the current IP address or MAC address, and the role assigned to the device. If viewing from a console, the name of the site associated with the device is also displayed.
- Click Records to start a record query that is filtered by this device.
- Click Packets to start a packet query that is filtered by this device.
Device properties
The device properties section provides the following known attributes and assignments for the device.
- High Value Device
- A high value icon
 appears if the ExtraHop system observed the
device providing authentication or essential services; you can also manually specify a device as high
value. Risk scores are increased for detections on high value
devices.
appears if the ExtraHop system observed the
device providing authentication or essential services; you can also manually specify a device as high
value. Risk scores are increased for detections on high value
devices. - IP Addresses
- A list of IP addresses observed on the device at any time during the selected time interval. If L2 Discovery is enabled, the list might display both IPv4 and IPv6 addresses that are simultaneously observed on the device, or the list might display multiple IP addresses assigned through DHCP requests at different times. A timestamp indicates when the IP address was last observed on the device. Click an IP address to view other devices where the IP address has been seen.
- Associated IP Addresses
- A list of IP addresses, usually outside of the network, that are associated with the device at any time during the selected time interval. For example, a VPN client on your network might be associated with an external IP address on the public internet. A timestamp indicates when the IP address was last associated with the device. Click an associated IP address to view details such as the geographic location and other devices the IP address has been associated with.
- Cloud Instance Properties
-
The following cloud instance properties appear for the device when you configure the properties through the REST API:
- Cloud Account
- Cloud Instance Type
- Virtual Private Cloud (VPC)
- Subnet
- Cloud Instance Name (appears in the Known Alias property)
- Cloud Instance Description (instance metadata appears automatically for devices in Flow Analysis)
See Add cloud instance properties through the ExtraHop API Explorer for more information.
- Users
- A list of authenticated users logged into the device. Click a user name to go to the Users page and view which other devices the user is logged into.
- Known Aliases
- A list of alternative device
names and the source program or protocol.
Note: Multiple DNS names are supported. - Hardware and Software
- The hardware or vendor make and model of the device and any operating
systems running on the device.
The ExtraHop system observes the network traffic on devices to automatically determine the vendor make and model, or you can manually assign a new make and model.
Tip: (CrowdStrike integration on Reveal(x) 360 only) Click links from CrowdStrike devices to view device details in CrowdStrike Falcon and initiate containment of CrowdStrike devices that are participants in a security detection. - Tags
- The tags assigned to the device. Click a tag name to view the other devices that the tag is assigned to.
- First and Last Seen
- The timestamps from when the device was first discovered and when activity was last observed on the device. NEW appears if the device was discovered within the last five days
- Analysis
- The level of analysis that this device receives.
Here are some ways you can view and modify device properties:
- Click View Groups to view the device group membership for the device.
- Click Edit Properties to view or modify device properties such as device role, device group memberships, or device tags.
- Click Edit Assignments to view or modify which alerts and triggers are assigned to the device.
Device activity
The device activity section provides information about how the device is communicating with other devices and which detections and alerts are associated with the device.
- Click Traffic to view charts for protocol and peer data,
and then drill
down on metrics in traffic charts.
Note: Traffic charts are not available if the device analysis level is Discovery Mode. To enable traffic charts for the device, elevate the device to Advanced Analysis or Standard Analysis. - Click Detections to view a list of detections, and then click a detection name to view detection details.
- Click Similar Devices to view a list of devices with similar network traffic behavior observed by machine-learning analysis. Similar devices can help you gain insight into normal device behavior when threat hunting. This tab is only displayed if there are similar devices associated with the device.
- (NPM module access required.) Click Alerts to view a list of alerts, and then click an alert name to view alert details. This tab is only displayed if there are alerts associated with the device.
- Click Peer Devices to view an activity map, which is a visual representation of the L4-L7 protocol activity between devices in your network. To modify the activity map with additional filters and steps, click Open Activity Map.
| Tip: | You can bookmark the Device Overview page to a specific activity view
by setting the tab URL parameter to one of the following values:
For example, the following URL always displays detection activity for the specified device: https://example-eda/extrahop/#/metrics/devices//0026b94c03810000/overview/&tab=detections |
Device metrics
Metrics are real-time measurements of your network traffic that the ExtraHop system calculates from network or flow data. Metrics collected from device traffic can be viewed in built-in charts and graphs from a device page.
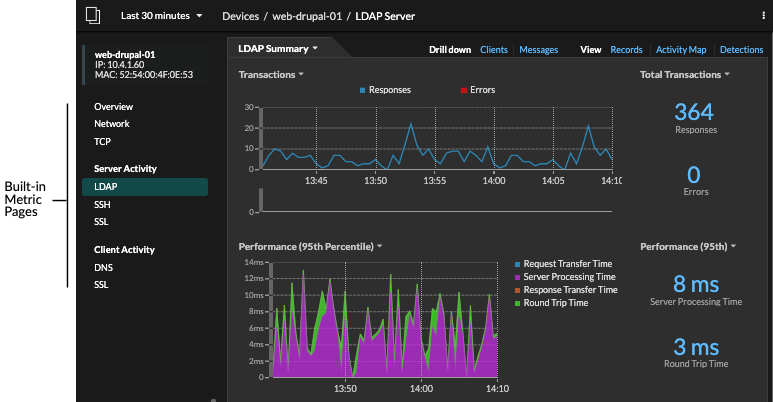
Click a built-in metric page from the left pane to view top-level device metrics or client and server metrics by protocol. Click a chart to drill down to detail metric pages, which display metric values for a specific key (such as a client or server IP address).
In addition to network and TCP built-in pages, devices display built-in metric pages for associated cloud services if data is available. See the Protocol Metrics Reference for more information about what data is available on built-in device pages.
The ExtraHop system provides thousands of built-in metrics. Here are some ways you can gain further insight about your devices
IP address details
Type an IP address in the global search field or click an IP address link from a Device Overview page to view details about an IP address.
The following information appears for an IP address seen on a device:
- Each device where the IP address is currently observed, regardless of the selected time interval.
- Each device where the IP address was previously observed within the selected time interval, including the timestamp from when the IP address was last seen on the device.
If L2 Discovery is enabled, both IPv4 and IPv6 addresses might be simultaneously observed on the device, or different IP addresses might be assigned to the device by DHCP over time.
The following information appears for an IP address associated with a device:
- The geolocation of the IP address and links to the ARIN Whois website.
- Each device where the associated IP address was seen outside of the network at any time during the selected time interval. For example, a VPN client on your network might be associated with an external IP address on the public internet.
- Any cloud services associated with the IP address.
- The IP address of the device as seen by the ExtraHop system on your network.
- The timestamp when the associated IP address was last seen on the device.
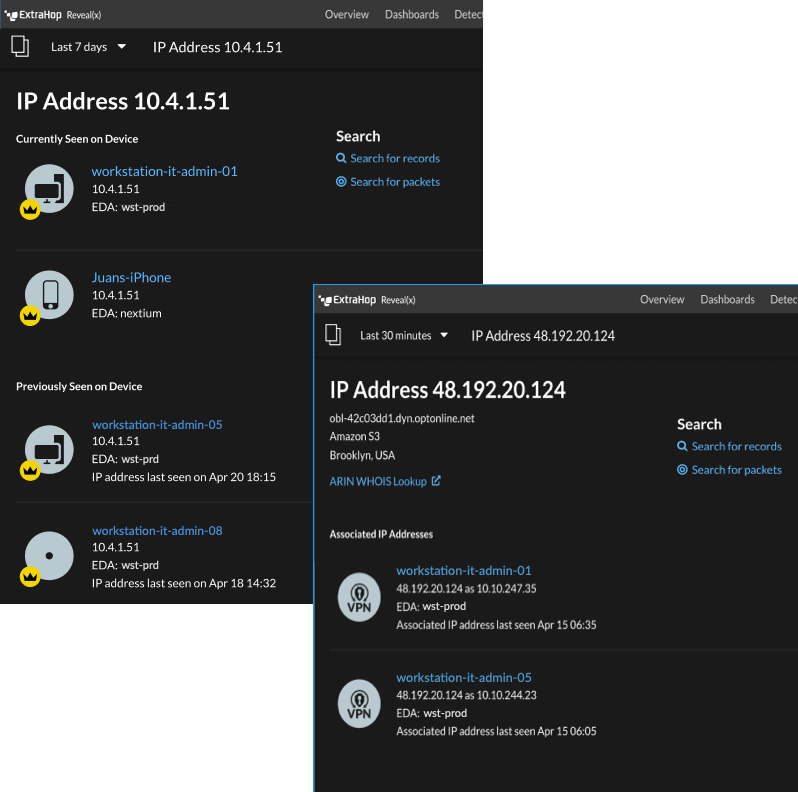
Here are some ways you can view additional IP address and device information:
- Hover over a device name to view device properties.
- Click a device name to view the Device Overview page.
- Click Search for Records to start a record query that is filtered by the IP .
- Click Search for Packets to start a packet query that is filtered by this device.
Grouping devices
Both custom devices and device groups are ways that you can aggregate your device metrics. Custom devices are user-created devices that collect metrics based on specified criteria, while device groups gather metrics for all of the specified devices in a group. With device groups, you can still view metrics for each individual device or group member. The metrics for a custom device are collected and displayed as if for a single device—you cannot view individual device metrics.
Both device groups and custom devices can dynamically aggregate metrics based on your specified criteria. We recommend selecting reliable criteria, such as the device IP address, MAC address, VLAN, tag, or type. While you can select devices by their name, if the DNS name is not automatically discovered, the device is not added.
| Device Groups | Custom Devices | |
|---|---|---|
| Criteria |
|
|
| Performance cost | Comparatively low. Because device groups only combine metrics that have already been calculated, there is a relatively low effect on metric collection. However, a high number of device groups with a large number of devices and complex criteria will take more time to process. | Comparatively high. Because the metrics for custom devices are aggregated based on user-defined criteria, large numbers of custom devices, or custom devices with extremely broad criteria, require more processing. Custom devices also increase the number of system objects to which metrics are committed. |
| View individual device metrics | Yes | No |
| Edit control for limited write users | Yes Users with limited write privileges can create and edit device groups. This global privilege policy must be enabled from Administration settings. |
No |
| Best practices | Create for local devices where you want to view and compare the metrics in a single chart. Device groups can be set as a metric source. | Create for devices that are outside of your local network, or for types of traffic that you want to organize as a single source. For example, you might want to define all physical interfaces on a server as a single custom device to better view metrics for that server as a whole. |
Custom devices
Custom devices enable you to collect metrics for devices that are outside of your local network or when you have a group of devices that you want to aggregate metrics for as a single device. These devices can even be different physical interfaces that are located on the same device; aggregating the metrics for these interfaces can make it easier to understand how heavily taxed your physical resources are as a whole, rather than by interface.
You might create a custom device to track individual devices outside of your local broadcast domain or to collect metrics about several known IP addresses or CIDR blocks from a remote site or cloud service. You can collect remote site metrics for custom devices to learn how remote locations consume services and to gain visibility into traffic between remote sites and a data center. See the Protocol Metrics Reference for a full list of remote site metrics and descriptions.
After you create a custom device, all of the metrics associated with the IP addresses and ports are aggregated into a single device that collects L2-L7 metrics. A single custom device counts as one device towards your licensed capacity for Advanced Analysis or Standard Analysis, which enables you to add a custom device to the watchlist. Any triggers or alerts are also assigned to the custom device as a single device.
While custom devices aggregate metrics based on their defined criteria, the metric calculations are not treated the same as for discovered devices. For example, you might have a trigger assigned to a custom device that commits records to a recordstore. However, the custom device is not shown as either a client or a server in any transaction records. The ExtraHop system populates those attributes with the device that corresponds to the conversation on the wire data.
Custom devices can affect the overall system performance, so you should avoid the following configurations:
- Avoid creating multiple custom devices for the same IP addresses or ports. Custom devices that are configured with overlapping criteria might degrade system performance.
- Avoid creating a custom device for a broad range of IP addresses or ports, which might degrade system performance.
If a large number of custom devices is affecting your system performance, you can delete or disable a custom device. The unique Discovery ID for the custom device always remains in the system. See Create a custom device to monitor remote office traffic to familiarize yourself with custom devices.
Device groups
A device group is a user-defined collection that can help you track metrics across multiple devices that are typically grouped by shared attributes such as protocol activity.
You can create a static device group that requires you to manually add or remove a device from the group. Or, you can create a dynamic device group that includes criteria that determines which devices are automatically included in the group. For example, you can create a dynamic device group based on the device discovery time that adds devices that are discovered during a specific time interval.
By default, the Device Group page includes the following dynamic device groups that you can overwrite or delete:
- New Devices (Last 24 Hours)
- Includes assets and endpoints that were first seen by the ExtraHop system over the last 24 hours.
- New Devices (Last 7 Days)
- Includes assets and endpoints that were first seen by the ExtraHop system over the last 7 days.
The ExtraHop system also includes built-in dynamic device groups by role and by protocol. You can assign built-in device groups as a metric source for objects such as charts, alerts, triggers, and activity maps. You cannot overwrite or delete a built-in device group, but you can add filter criteria and save it as a new device group.
From the Devices page, click a device count for a role or protocol, such as Domain Controller or CIFS clients, to view the Device Group Overview page. Clicking the filter at the top of the page enables you to add additional criteria and update the page data on demand instead of requiring you to create a device group.
There is no performance impact to collecting metrics with device groups. However, we recommend that you prioritize these groups by their importance to make sure that the right devices receive the highest level of analysis.
Device groups are a good choice when you have devices that you want to collectively apply as a source. For example, you could collect and display metrics for all of your high-priority production web servers in a dashboard.
By creating a device group, you can manage all of those devices as a single metric source instead of adding them to your charts as individual sources. However, note that any assigned triggers or alerts are assigned to each group member (or individual device).
Device names and roles
After a device is discovered, the ExtraHop system tracks all of the traffic associated with the device to determine the device name and role.
Device names
The ExtraHop system discovers device names by passively monitoring naming protocols, including DNS, DHCP, NETBIOS, and Cisco Discovery Protocol (CDP).
If a name is not discovered through a naming protocol, the default name is derived from device attributes, such as MAC addresses and IP addresses. For some devices discovered on flow sensors, the ExtraHop system assigns names based on the role of the device such as Internet Gateway or Amazon DNS Server. You can also create a custom name or set a cloud instance name for a device.
A device can be identified by multiple names, which appear as Known Aliases on the Device Overview page. If a device has multiple names, the order of display precedence is specified in Administration settings. You can search by any name to find a device.
| Note: | Custom names are not synchronized across connected ExtraHop systems. For example, a custom name created on a sensor is not available from a connected console. |
If a device name does not include a hostname, the ExtraHop system has not yet observed naming protocol traffic associated with that device. The ExtraHop system does not perform DNS lookups for device names.
Device roles
Based on the type of traffic associated with the device or the device model, the ExtraHop system automatically assigns a role to the device, such as a gateway, file server, database, or load balancer. The Other role gets assigned to devices that cannot be identified.
A device can only be assigned one role at a time. You can manually change a device role, or the ExtraHop system might re-assign a different role if observed traffic and behavior changes. For example, if a PC has been repurposed into a Web server, you might change the role immediately, or the change might be observed over time and the role updated by the system.
The ExtraHop system identifies the following roles:
| Icon | Role | Description |
|---|---|---|
| Custom Device | A user-created device that collects metrics based on specified criteria. The ExtraHop system automatically assigns this role when you create a custom device. You cannot manually assign the Custom role to a device. | |
| Attack Simulator | A device that runs breach and attack simulation (BAS) software to simulate attacks in a network. | |
| Database | A device that primarily hosts a database instance. | |
| DHCP Server | A device that primarily processes DHCP server activity. | |
| DNS Server | A device that primarily processes DNS server activity. | |
| Domain Controller | A device that acts as a domain controller for Kerberos, CIFS, and MSRPC server activity. | |
| File Server | A device that responds to read and write requests for files over NFS and CIFS/SMB protocols. | |
| Firewall | A device that monitors incoming and outgoing network traffic and blocks traffic according to security rules. The ExtraHop system does not automatically assign this role to devices. | |
| Gateway | A device that acts as a router or gateway. The ExtraHop system looks for devices associated with a large amount of unique IP addresses (past a certain threshold) when identifying gateways. Gateway device names include the router name such as Cisco B1B500. Unlike other L2 parent devices, you can add a gateway device to the watchlist for Advanced Analysis. | |
| IP Camera | A device that sends image and video data through the network. The ExtraHop system assigns this role based on the device model. | |
| Load Balancer | A device that acts as a reverse proxy for distributing traffic across multiple servers. | |
| Medical Device | A device designed for healthcare needs and medical environments. The ExtraHop system might assign this role if a device is a known medical make and model or if the device processes DICOM traffic. | |
| Mobile Device | A device that has a mobile operating system installed, such as iOS or Android. | |
| NAT Gateway | A device that acts as a Network Address Translation (NAT) gateway. The ExtraHop system might assign this role if a device is associated with four or more OS fingerprint families or with four or more hardware or vendor makes and models. After a device is assigned this role, device properties for software, hardware make and model, and authenticated users no longer appear for the device. | |
| PC | A device such as a laptop, desktop, Windows VM, or macOS device that processes DNS, HTTP, and SSL client traffic. | |
| Printer | A device that enables users to print text and graphics from other connected devices. The ExtraHop system assigns this role based on the device model or on traffic observed over mDNS (multicast DNS). | |
| VoIP Phone | A device that manages voice over IP (VoIP) phone calls. | |
| VPN Client | An internal device that communicates with a remote IP address. If VPN client discovery is enabled, the ExtraHop system automatically assigns this role to internal devices communicating with remote IP addresses through a VPN gateway. You cannot manually assign the VPN Client role to a device. | |
| VPN Gateway | A device that connects two or more VPN devices or networks together to bridge remote connections. The ExtraHop system assigns this role to devices with a large number of external VPN peers if automatic classification for this role is enabled in the running configuration file. | |
| Vulnerability Scanner | A device that runs vulnerability scanner programs. | |
| Web Proxy Server | A device that processes HTTP requests between a device and another server. | |
| Web Server | A device that primarily hosts web resources and responds to HTTP requests. | |
| Wi-Fi Access Point | A device that creates a wireless local area network and projects a wireless network signal to a designated area. The ExtraHop system assigns this role based on the device model. |
Find a device
The ExtraHop system automatically discovers devices such as clients, servers, routers, load balancers, and gateways that are actively communicating with other devices over the wire. You can search for a specific device on the system and then view traffic and protocol metrics on a protocol page.
There are several ways to search for a device:
Find a device from a global search
You can search for devices from the global search field at the top of the page. Global search compares a search term to multiple device properties such as the hostname, IP address, known alias, vendor, tag, description, and device group. For example, if you search for the term vm, the search results might display devices that include vm in the device name, device vendor, or device tag.
-
Click Any Type and then select
Devices.
The search results are displayed in a list below the search field. Click More Results to scroll through the list.
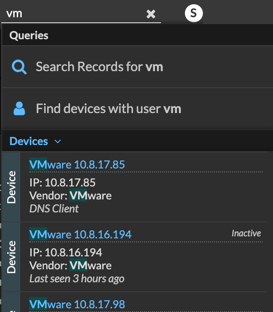
Matching devices with no activity during the specified time interval have an Inactive label.
Tip: Devices inactive for more than 90 days are excluded from global search results. However, you can immediately exclude all devices that have been inactive for fewer than 90 days through the Administration settings.
Search for a device by details
You can search for devices by information observed over the wire, such as IP address, MAC address, hostname, or protocol activity. You can also search for devices by customized information such as device tags.
The trifield search filter enables you to search by multiple categories at once. For example, you can add filters for device name, IP address, and role to view results for devices that match all of the specified criteria.
-
In the search field, type the string to be matched, or select a value from the
drop-down list. The input type is based on the selected category.
For example, if you want to find devices based on Name, type the string to be matched in the search field. If you want to find devices based on Role, select from the drop-down list of roles.
Tip: Depending on the selected category, you can click the Regex icon in the text field to enable matching by regular expression. 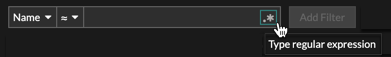
Next steps
- Click a device name to view device properties and metrics on the Device Overview page.
- Click Create Dynamic Group from the upper right corner to create a dynamic device group based on the filter criteria.
- Click the command menu and then select PDF or CSV to export the device
list to a file.
Search for devices by protocol activity
The Devices page displays all protocols that are actively communicating on the ExtraHop system during the selected time interval. You can quickly locate a device that is associated with a protocol, or discover a decommissioned device that is still actively communicating over a protocol.
-
From the Devices by Protocol Activity chart, click the number of HTTP servers,
as shown in the following figure.
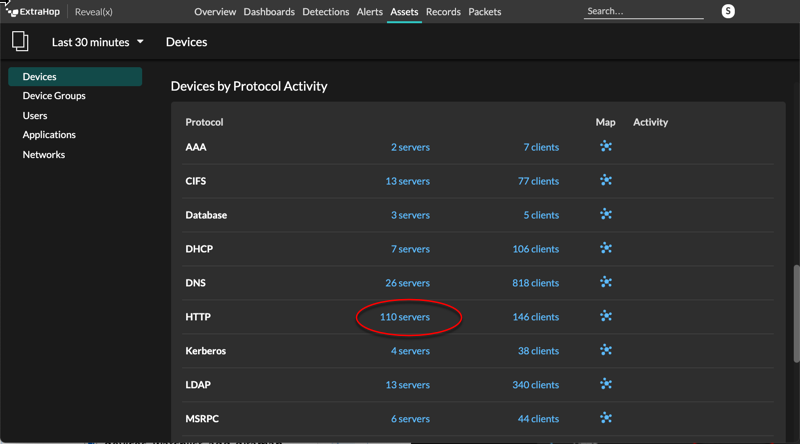
Note: If you do not see the protocol you want, the ExtraHop system might not have observed that type of protocol traffic over the wire during the specified time interval, or the protocol might require a module license. For more information, see the I don't see the protocol traffic I was expecting? section in the License FAQ. The page displays traffic and protocol metrics associated with the group of HTTP servers. -
From the table, click a device name.
The page displays traffic and protocol metrics associated with that device, similar to the following image.
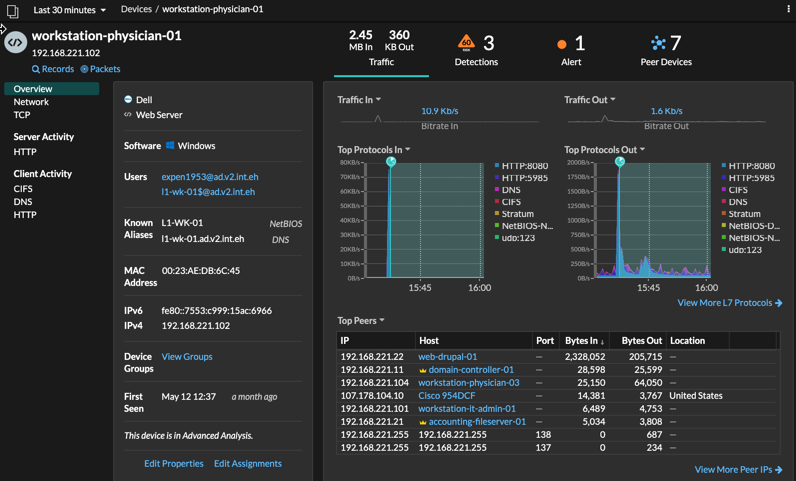
Search for devices accessed by a specific user
From the Users page, you can see active users and the devices they have logged in to the ExtraHop system during the specified time interval.
| Tip: | You can also search for users from the global search field at the top
of the page.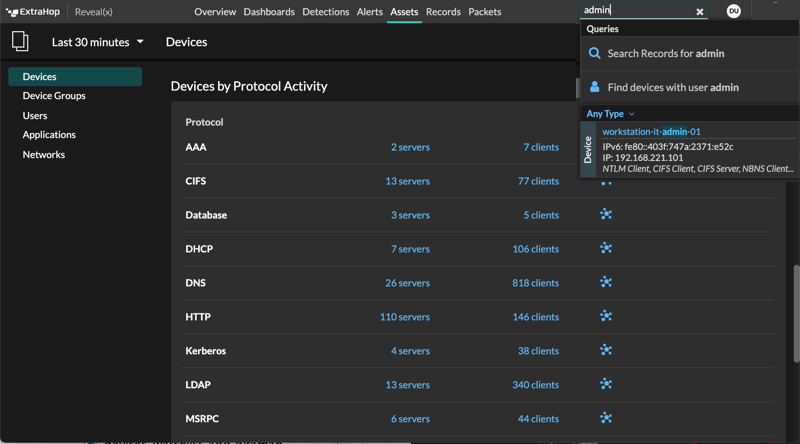 |
This procedure shows you how to perform a search from the Users page.
-
In the text field, type the name of the user or device you want to match or
exclude.
The Users page displays a list of results similar to the following figure:
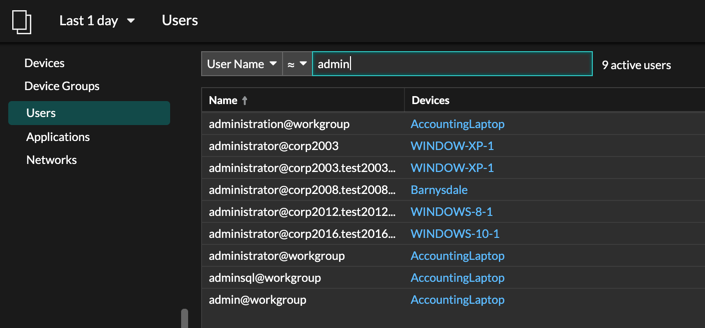
Search for peer devices
If you want to know which devices are actively talking to each other, you can drill down by Peer IPs from a device or device group protocol page.
-
On the Overview page for the selected device or device group, click one of the
following links:
Option Description For devices Click View More Peer IPs, located at the bottom of the Top Peers chart. 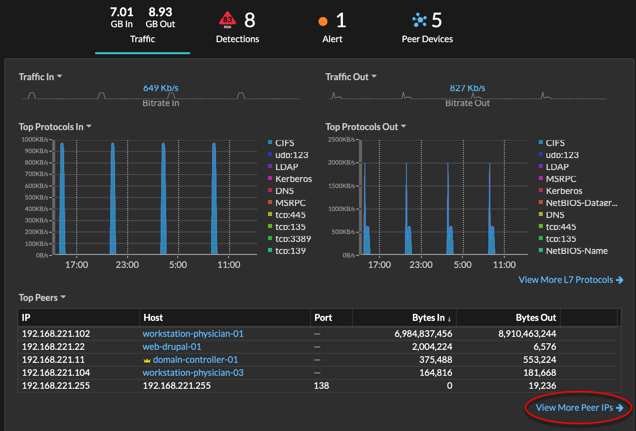
For device groups Click Peer IPs, located in the Details section near the upper right corner of the page. 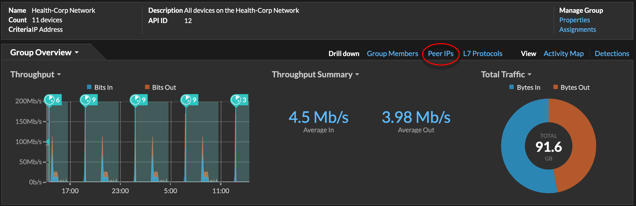 A list of peer devices appears, which are broken down by IP address. You can investigate network bytes and packets information for each peer device, as shown in the following figure.
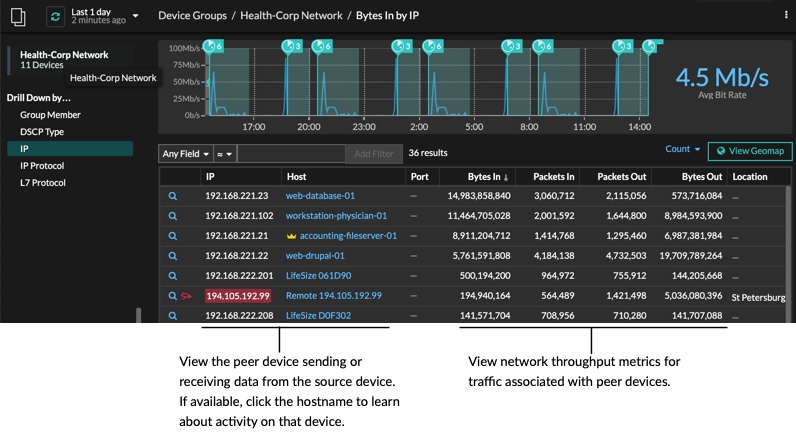
Change a device name
The ExtraHop system automatically names devices by passively monitoring naming protocol traffic (DNS, DHCP, NETBIOS, CDP). If naming protocol traffic is not observed for a device, the device name displays either the IP address or the MAC address. In either condition, you can change the automatic device name to a custom name. The custom name will appear throughout the ExtraHop system.
- Custom names are not synchronized across connected ExtraHop systems. For example, a custom name created on a sensor is not available from a connected console.
- The ExtraHop system does not perform DNS lookups for device names. The ExtraHop system derives the DNS name for a device by observing DNS traffic over wire data. For more information, see Device discovery.
- If a device has multiple names, the order of display precedence is specified in Administration settings.
Change a device role
The ExtraHop system automatically discovers and classifies devices on your network based on the protocol activity or device model and assigns a role to each device, such as a gateway, file server, database, or load balancer. You can change the role assigned to a device at anytime.
- After you change the device role, the device might be removed from or added to dynamic device groups that include a device role as criteria.
- Device role changes are not synchronized across connected ExtraHop systems. For example, if you change a device role on a sensor, the role is not changed from a connected console.
Change a device model
The ExtraHop system observes the network traffic on devices to automatically determine the vendor make and model, but you can manually change the device model.
Here are some important considerations about changing a device model:
- Devices are automatically added and removed from dynamic device groups with criteria based on device models.
- You can change a device model from sensors and consoles. When the device is updated on a console, the change is synchronized to connected sensors. However, the change is not synchronized from individual sensors to the connected console.
Before you begin
You must have full write privileges or higher.Manually identify a device as high value
While the ExtraHop system automatically identifies devices that provide authentication or essential services as high value, you can also manually identify a device as high value or not.
- Risk scores are increased for detections on high value devices.
- Devices are automatically added and removed from dynamic device groups with criteria based on high value.
- You can manually identify high value devices from sensors and consoles. When the device is updated on a console, the change is synchronized to connected sensors. However, the change is not synchronized from individual sensors to the connected console.
Before you begin
You must have full write privileges or higher.Create a device tag
Tags are user-defined labels that you can attach to a device. Tags can help differentiate devices on the ExtraHop system that share a common attribute or characteristic. You can then search for devices or create dynamic device groups based on the device tag.
| Note: | You cannot rename a device tag after it is created. |
| Note: | You can also automate this task through the REST API. |
-
Click the System Settings icon and then click Tags.
Create a device group
You can create both dynamic and static device groups. Dynamic groups automatically add all devices that match specified criteria to the group, while static groups require you to manually add each device.
Create a dynamic device group
| Tip: | You can
quickly create a dynamic device group from a filtered list of devices on the Devices
page. Click Create Dynamic Group from the upper right
corner. You can also create a dynamic device group from a built-in device
group. From the Devices page, click a role or protocol, update the filter
criteria, and then click the Save |
-
In the Filter Criteria section, click Match
All and then select one of the following match operators from
the drop-down list:
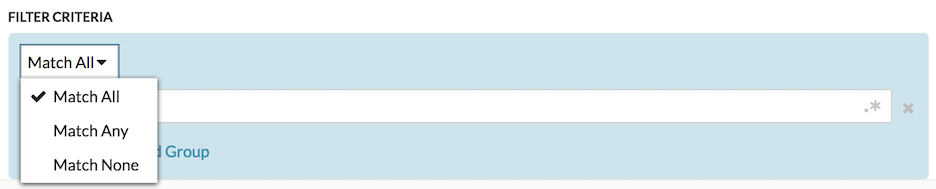
Option Description Match All Filters only devices that match all of the specified criteria. Match Any Filters devices that matches any of the specified criteria. Match None Filters devices that do not match any of the specified criteria. -
Click Name and select one of the following categories
from the drop-down list:
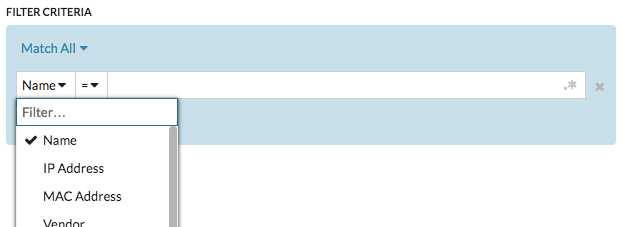
Option Description Name Filters devices by the discovered device name. For example, a discovered device name can include the IP address or hostname. MAC Address Filters devices by the device MAC address. IP Address Filters devices by IP address in IPv4, IPv6, or CIDR block formats. Site Filters devices associated with a connected site. Console only.
Discovery Time Filters devices automatically discovered by the ExtraHop system within the specified time interval. For more information, see Create a device group based on discovery time. Analysis Level Filters devices by analysis level, which determines what data and metrics are collected for a device. You cannot create a dynamic device group for devices filtered by analysis level.
Model Filters devices by make and model name. The following tips can help you find the device model you want: - Select the exact match operator (=) to view a drop-down list of existing models and model sets.
- Select the exact match operator (=) and then select Custom Models to filter all devices assigned to a custom model set.
Activity Filters devices by protocol activity associated with the device. For example, selecting HTTP Server returns devices with HTTP server metrics, and any other device with a device role set to HTTP Server. Also filters devices that accepted or initiated an external connection, which can help you determine whether devices are engaged in suspicious activity.
Cloud Account Filters devices by the cloud service account associated with the device. Cloud Instance ID Filters devices by the cloud instance ID associated with the device. Cloud Instance Type Filters devices by the cloud instance type associated with the device. High Value Filters devices that are considered high value because they provide authentication services, support essential services on your network, or are user-specified as high value. Currently Active Filters devices by activity observed on a device in the last 30 minutes. Network Locality Type Filters devices by all internal or external network localities. Network Locality Name Filters devices by network locality name. Role Filters devices by the assigned device role, such as gateway, firewall, load balancer, and DNS Server. Software Filters devices by operating system software detected on the device. Subnet Filters devices by the subnet associated with the device. Tag Filters devices by user-defined device tags. Vendor Filters devices by the device vendor name, as determined by the Organizationally Unique Identifier (OUI) lookup. Virtual Private Cloud Filters devices by the VPC associated with the device. VLAN Filters devices by the device VLAN tag. VLAN information is extracted from VLAN tags, if the traffic mirroring process preserves them on the mirror port. Only available if the devices_accross_vlans setting is set to False in the running configuration file.
CDP Name Filters devices by the CDP name assigned to the device. Cloud Instance Name Filters devices by the cloud instance name assigned to the device. Custom Name Filters devices by the custom name assigned to the device. DHCP Name Filters devices by the DHCP name assigned to the device. DNS Name Filters devices by any DNS name assigned to the device. NetBIOS Name Filters devices by the NetBIOS name assigned to the device. -
Select one of the following operators from the drop-down list; the operators
available are based on the selected category:
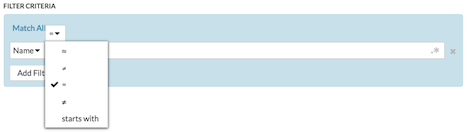
Option Description = Filters devices that are an exact match of the search field for the selected category. ≠ Filters devices that do not exactly match the search field. ≈ Filters devices that include the value of the search field for the selected category. ≈/ Filters devices that exclude the value of the search field for the selected category. starts with Filters devices that start with the value of the search field for the selected category. exists Filters devices that have a value for the selected category. does not exist Filters devices that do not have a value for the selected category. match Filters devices that include the value of the search field for the selected category. -
In the search field, type the string to be matched, or select a value from the
drop-down list. The input type is determined by the selected category.
For example, if you want to find devices based on Name, type the string to be matched in the search field. If you want to find devices based on Role, select from the drop-down list of roles.
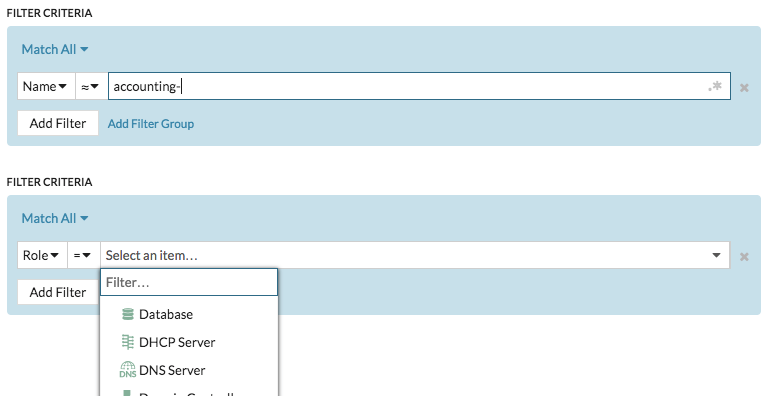
Tip: Depending on the selected category, you can click the Regex icon in the text field to enable matching by regular expression. 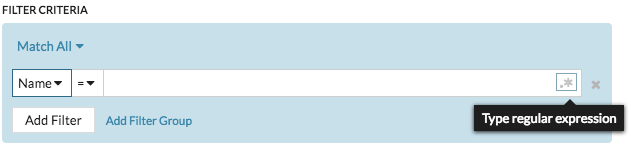
Create a custom device
Collect metrics for a segment of traffic across multiple IP addresses and ports by creating a custom device. Custom devices are useful for monitoring traffic outside of your local broadcast domain, such as branch offices, stores, or clinics.
Here are some important considerations about custom devices:
- Custom devices only appear in the ExtraHop system after traffic that matches your specified criteria is observed.
- Avoid creating multiple custom devices for the same IP addresses or ports. Custom devices that are configured with overlapping criteria might degrade system performance.
- Avoid creating a custom device for a broad range of IP addresses or ports, which might degrade system performance.
- A single custom device counts as one device towards your licensed capacity for Advanced Analysis and Standard Analysis.
- You can also automate this task through the REST API.
Before you begin
You must have full write privileges or higher.-
Click the System Settings icon and then click Custom
Devices.
Delete or disable a custom device
Custom devices are manually created on an ExtraHop system to collect metrics for traffic observed across multiple IP addresses and ports. If a large number of custom devices is affecting your system performance, you can delete or disable a custom device.
Before you begin
Full privileges or higher are required to create or delete a custom device.- When you delete or disable a custom device, the device becomes inactive, which means that the system stops collecting metrics for that device.
- When you delete or disable a custom device, the device continues to appear as an asset until all metrics collected for that device are overwritten in the local datastore.
- When you delete a custom device, the unique Discovery ID for the custom device always remains in the system and cannot be applied to a new custom device.
-
Click the System Settings icon and then click Custom
Devices.
Configure remote sites for custom devices
Custom devices are useful for monitoring traffic outside of your local broadcast domain, such as branch offices, stores, or clinics. You can collect remote site metrics about custom devices to easily learn how remote locations consume services and to gain visibility into traffic between remote sites and a data center.
For example, build a dashboard and add a custom device as the metric source to see remote site metrics such as inbound and outbound throughput, retransmission timeouts, round trip times, and zero windows. See the Protocol Metrics Reference for a full list of remote site metrics and descriptions.
Here are some important considerations about remote sites for custom devices:
- Remote site configuration applies to all enabled custom devices; you cannot configure remote sites for an individual custom device.
- Remote site metrics are only displayed in the Metric Catalog and the Metric Explorer if remote site metric collection is enabled.
Before you begin
You must have full write privileges or higher.- Log in to the ExtraHop system through https://<extrahop-hostname-or-IP-address>.
-
Click the System Settings icon and then click Custom
Devices.
- Click Configure Remote Sites.
- Select or clear the Collect remote site metrics checkbox.
- Click Save.
Specify network localities and trusted domains
By providing details about your network specifications, you can improve the metrics and detections generated by your ExtraHop system. The Network Localities page enables you to specify internal and external IP addresses and add trusted domains that your devices regularly connect to.
Here are some important considerations about these settings:
- If your ExtraHop deployment includes a console, we recommend that you transfer management of all connected sensors to the console.
- For ExtraHop Reveal(x) 360, these settings are synchronized across all connected sensors. You should not configure these settings on individual sensors.
- For ExtraHop Reveal(x) Enterprise, when you transfer management to a connected console, these settings are synchronized across all sensors. Otherwise, network locality settings must be configured on all sensors and consoles.
- You must have full write privileges to change these settings.
| Video: | See the related training: Configure Network Localities |
Specify a network locality
Network localities enable you to classify traffic from IP addresses and CIDR blocks as internal or external to your network. You can also specify a name for each locality such as "DMZ" or "guest network" and filter by that name in devices and records.
- Log in to the ExtraHop system through https://<extrahop-hostname-or-IP-address>.
-
Click the System Settings icon and then click Network
Localities.
- Click Add Network Locality.
- In the Network Locality Name field, type a unique name.
- In the Network Locality Type section, select Internal or External, based on the classification you want to apply to the IP addresses and CIDR blocks.
- In the IP Addresses and CIDR Blocks field, type the IP addresses and CIDR blocks you want to add to the locality. You must enter a unique range of addresses or blocks.
- (Optional): In the Description field, type information about network locality.
- Click Save.
- To add more entries, click Add Network Locality.
Next steps
- Filter devices by selecting Internal or External as the Network Locality Type in the trifield filter.
- Filter devices by specifying the Network Locality Name in the trifield filter.
- Drill down on a metric by client, server, or IP address and select Internal or External as the Network Locality in the trifield filter.
- Filter records by specifying one of the following filters:
- Network Locality Name
- Client Network Locality Name
- Server Network Locality Name
- Sender Network Locality Name
- Receiver Network Locality Name
Add a trusted domain
Certain detections are generated when a device makes a connection to an external domain. If you know that a domain is legitimate, add it to the Trusted Domains list, and future detections that target malicious domain activity are suppressed for that domain.
For detections that have an associated domain, you can also add a trusted domain directly from a detection card.
| Note: | If your ExtraHop system includes a console, and that system is configured to manage tuning parameters, these trusted domains will apply to all connected sensors. |
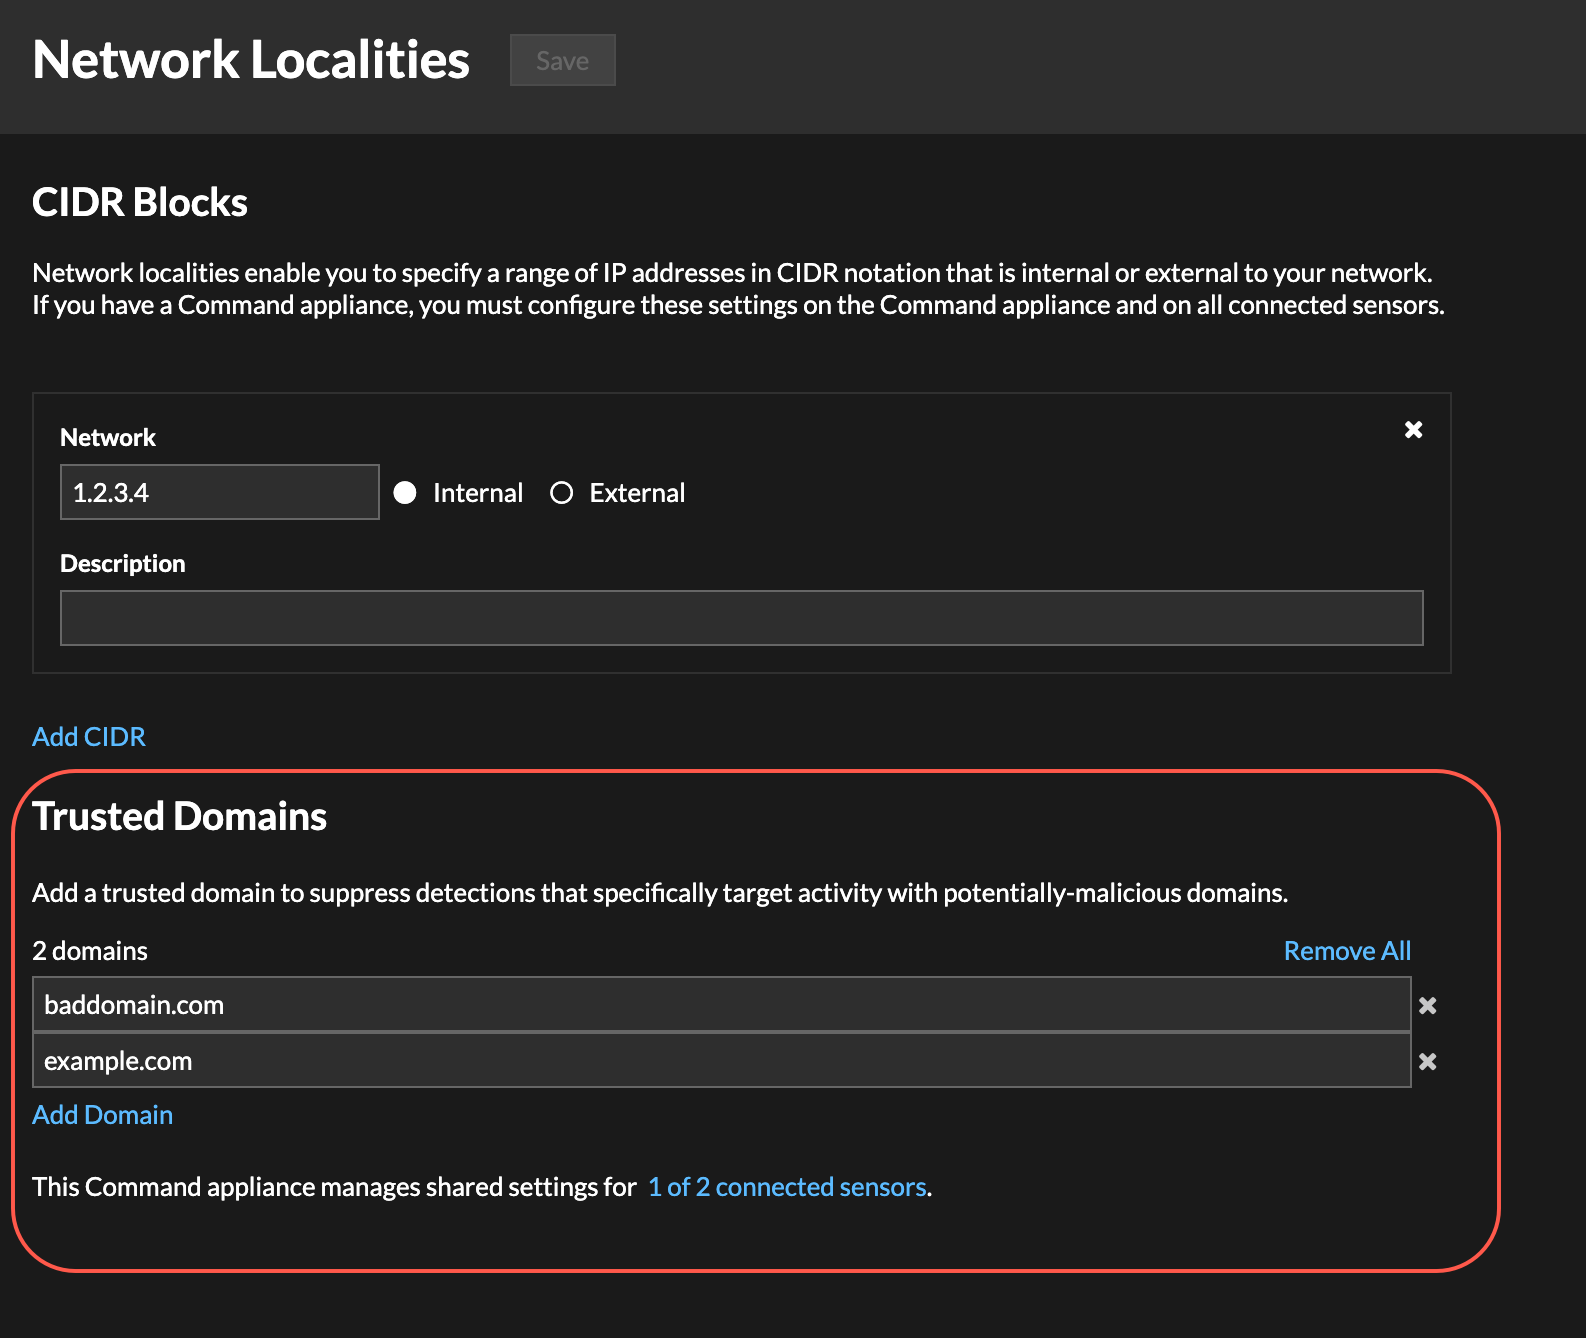
-
Click the System Settings icon and then click Network
Localities.
Analysis priorities
The ExtraHop system analyzes traffic and collects data from all discovered devices on a single sensor. Each discovered device receives an analysis level that determines what data and metrics are collected for a device. Analysis priorities determine which analysis level a device receives.
| Important: | Analysis priorities can be centrally managed from a console. |
| Video: | See the related training: Analysis Priorities |
Prioritizing devices and groups
The ExtraHop system can analyze hundreds of thousands of devices and automatically determine which analysis level each device receives, but you can control which devices are prioritized for Advanced and Standard Analysis.
Most devices can be added to a watchlist to ensure Advanced Analysis or you can add device groups to an ordered list to prioritize them for Advanced Analysis and Standard Analysis.
Here are some important considerations about prioritizing devices through the watchlist:
- Devices remain on the watchlist even when they are inactive, but metrics are not collected for inactive devices.
- The number of devices in the watchlist cannot exceed your Advanced Analysis capacity.
- Devices can only be added to the watchlist from a device properties page or the device list page. You cannot add devices to the watchlist from the Analysis Priorities page.
- If you want to add several devices to the watchlist, we recommend that you create a device group and then prioritize that group for Advanced Analysis.
- Devices receiving L2 Parent Analysis or Flow Analysis cannot be added to the watchlist.
Here are some important considerations about prioritizing device groups:
- Order device groups from the highest to lowest priority in the list.
- Click-and-drag groups to change their order in the list.
- Make sure that each device in the group is active; groups that contain a large number of devices take up capacity and inactive devices do not generate metrics.
- You cannot prioritize more than 200 device groups for each level.
By default, the ExtraHop system automatically fills Advanced and Standard Analysis levels to maximum capacity. Here are some important considerations about capacity levels and the automatic fill option:
- Devices prioritized in the watchlist or through a prioritized group fill the higher analysis levels first, and then by the earliest-discovered devices.
- Devices are prioritized for Advanced Analysis if the device is associated with certain detections, if the device has accepted or initiated an external connection, or if the device is running common attack tools.
- Device properties such as the role, hardware and software, protocol activity, detection history, and high value can also determine analysis levels.
- The Automatically Fill option is enabled by default. If disabled, all devices that are not in prioritized groups or in the watchlist are removed and the ExtraHop system sets the priority for each device.
- Your ExtraHop subscription and license determine maximum capacity levels.
See the Analysis Priorities FAQ to learn about analysis level capacities.
Compare analysis levels
| Analysis Level | Features | How to Receive this Level |
|---|---|---|
| Discovery Mode |
|
Devices automatically receive Discovery Mode if not in Standard, Advanced, or L2 Parent Analysis. |
| Standard Analysis |
|
Prioritize device groups for Standard Analysis. |
| Advanced Analysis |
|
Prioritize device groups for Advanced Analysis or add individual devices to the watchlist. |
| L2 Parent Analysis (Only applicable if L3 Discovery is enabled) |
|
L2 parent devices automatically receive L2 Parent Analysis, except for gateways and routers. |
| Flow Analysis |
|
Devices automatically receive Flow Analysis if discovered on a flow sensor. |
Transfer management of analysis priorities
Each packet sensor can manage its own analysis priorities, which determine which devices receive Advanced Analysis or Standard Analysis. If your sensor is connected to a console, you can transfer priority management to that console for a centralized view of these settings.
Here are some important considerations about transferring management:
- You must have full write privileges to edit analysis priorities.
- After management is transferred to a console, any further changes you make on individual sensors are inactive. See which other settings are also transferred.
- Analysis Priorities settings are not available for flow sensors; management cannot be transferred.
The following steps show you how to transfer priority management to a console:
-
Click the System Settings icon and then click Analysis
Priorities.
| Tip: | To avoid analysis disruptions, you can save a draft of the analysis priorities settings for each sensor before transferring management to a console. |
Prioritize groups for Advanced Analysis
You can specify device groups for Advanced Analysis based on their importance to your network. Groups are ranked in an ordered list.
Here are some important considerations about Advanced Analysis:
- Devices on the watchlist are guaranteed Advanced Analysis and are prioritized over device groups.
- Devices within a device group that are inactive do not affect Advanced Analysis capacity.
- Custom metrics are only available for devices in Advanced Analysis. If you want to see custom metrics for a specific device, prioritize a group that contains the device or add the device to the watchlist.
- You must have full write privileges to edit analysis priorities.
- You cannot prioritize more than 200 device groups for Advanced Analysis.
-
Go to the settings for Standard Priorities.
- On a console, click the System Settings icon and then click
Analysis Priorities. Then, click Edit
Priorities next to the sensor you want to modify.
- On a sensor, click the System Settings icon and then click
Analysis Priorities.
- On a console, click the System Settings icon
-
Prioritize groups by completing the following steps:
-
In the For Advanced Analysis section, click
adding a group to add the initial group or
Add Group to add additional groups.
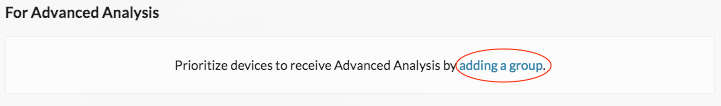
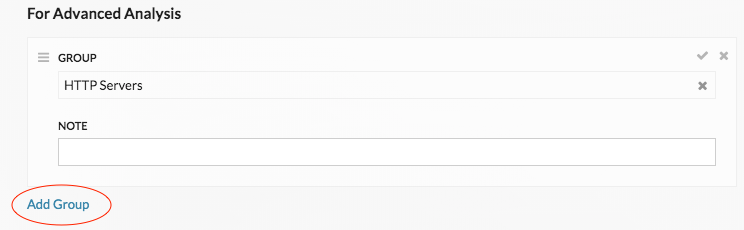
-
In the For Advanced Analysis section, click
adding a group to add the initial group or
Add Group to add additional groups.
Next steps
Here are some additional ways to manage and refine groups that receive Advanced Analysis:
- If you add multiple groups, the groups are prioritized from top to bottom. Click
the upper left icon next to Group, and then drag the group
to another position in the ordered list.

- Click the check
 icon to collapse the group. Click the pencil
  icon to
expand the group again, as shown in the following figure.
icon to
expand the group again, as shown in the following figure.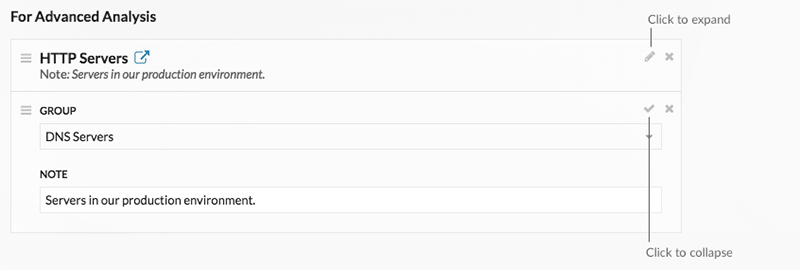
- Click the go to
 icon next
to a group name to navigate to the device group page. The device group page
displays which devices and how many devices are in the group. The icon is only
available when the group is collapsed.
icon next
to a group name to navigate to the device group page. The device group page
displays which devices and how many devices are in the group. The icon is only
available when the group is collapsed.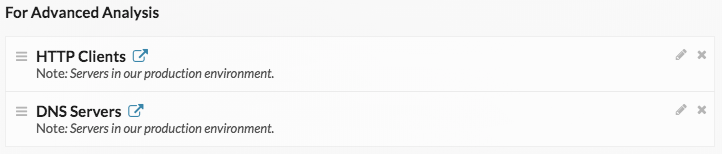
- Click the x icon to remove a group from the list, as shown in the following
figure.

Prioritize groups for Standard Analysis
You can specify device groups for Standard Analysis based on their importance to your network. Groups are ranked in an ordered list.
Here are some important considerations about Standard Analysis:
- Devices prioritized for Standard Analysis section receive Advanced Analysis when there is capacity.
- You must have full write privileges to edit analysis priorities.
- You cannot prioritize more than 200 device groups for Standard Analysis.
-
Go to the settings for Standard Priorities.
- On a console, click the System Settings icon and then click
Analysis Priorities. Then, click Edit
Priorities next to the sensor you want to modify.
- On a sensor, click the System Settings icon and then click
Analysis Priorities.
- On a console, click the System Settings icon
-
Prioritize groups by completing the following steps:
-
In the For Standard Analysis section, click
adding a group to add the initial group or
Add Group to add additional groups.
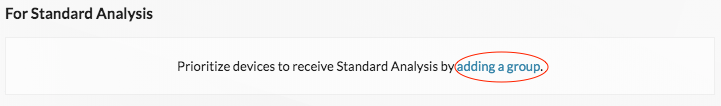
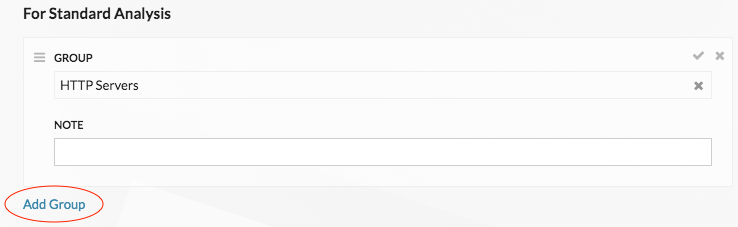
-
In the For Standard Analysis section, click
adding a group to add the initial group or
Add Group to add additional groups.
Next steps
Here are some additional ways to manage and refine groups that receive Standard Analysis:
- If you add multiple groups, the groups are prioritized from top to bottom. Click
the upper left icon next to Group, and then drag the group
to another position in the ordered list.
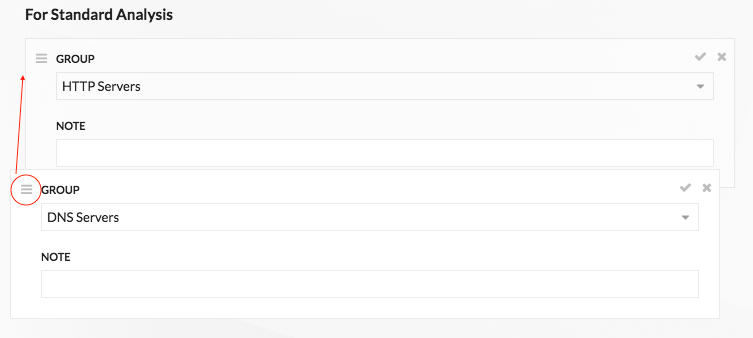
- Click the check icon to collapse the group. Click the pencil icon to
expand the group again, as shown in the following figure.
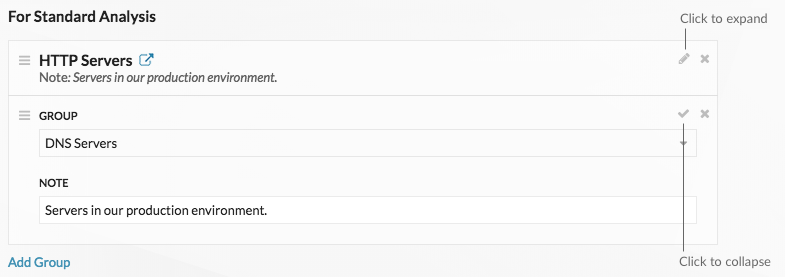
- Click the go to icon next
to a group name to navigate to the device group page. The device group page
displays which devices and how many devices are in the group. The icon is only
available when the group is collapsed.
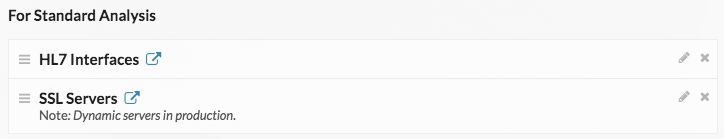
- Click the x icon to remove a group from the list, as shown in the following
figure.
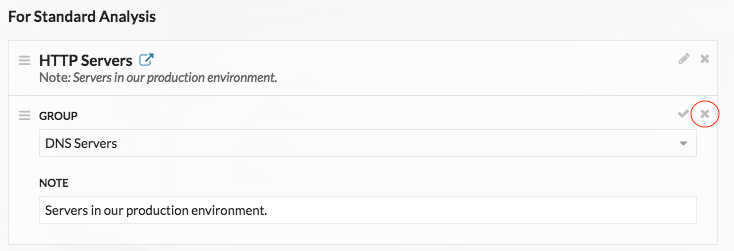
Add a device to the watchlist
Add devices to the watchlist to ensure Advanced Analysis. You can add a custom device to the watchlist, but you cannot add an L2 parent device to the watchlist, unless the device is a gateway or router, and you cannot add a device in Flow Analysis. Devices stay on the watchlist whether they are inactive or active, but a device must be active for the ExtraHop system to collect Advanced Analysis metrics.
| Tip: | Instead of adding several devices to the watchlist, create a device group and then
prioritize that
group for Advanced Analysis. Or add multiple devices to the watchlist
from the Device list page. Click the checkbox next to one or more devices and then
click the Add to Watchlist icon 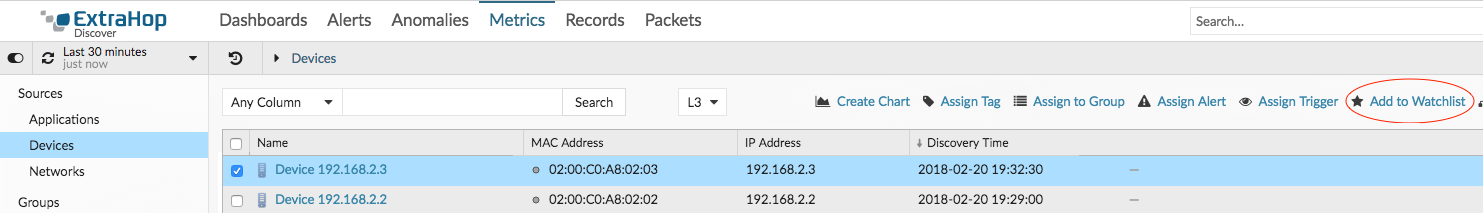 Learn more about Analysis Priorities. |
-
Click Edit Properties.
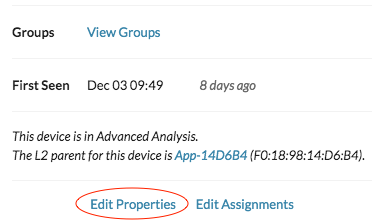
Remove a device from the watchlist
You can remove devices that are on the watchlist from the Analysis Priorities page.
-
Go to the settings for Standard Priorities.
- On a console, click the System Settings icon and then click
Analysis Priorities. Then, click Edit
Priorities next to the sensor you want to modify.
- On a sensor, click the System Settings icon and then click
Analysis Priorities.
- On a console, click the System Settings icon
| Note: | It is possible to add devices to a blocklist, based on their unique MAC addresses, by modifying the running configuration file on the ExtraHop system. Contact your ExtraHop administrator to add devices to a blocklist. |
Activity maps
An activity map is a dynamic visual representation of the L4-L7 protocol activity between devices in your network. You can see a 2D or 3D layout of device connections in real-time to learn about the traffic flow and relationships between devices.
Activity maps can help you with the following use cases:
- Complete a data center or cloud migration
- As part of your migration strategy, you must determine which services can be turned off and when. An activity map helps you identify which devices are still connected so you can prevent unexpected service disruptions during the migration process. For more information, see the Plan and monitor your migration with activity maps walkthrough.
- Identify the root cause behind a slow application
- Applications often depend on multiple tiers of services within a network. An activity map can help you identify the delivery chain of traffic to your slow application server. Click a device to investigate related metrics, which can shed more light onto the root cause of the slow-down.
- Track suspicious devices or unexpected connections
- During a security event, an activity map can help you identify affected devices by tracking the real-time east-west traffic associated with a suspicious device. As part of a daily security monitoring strategy, you can create an activity map to confirm that devices are not making unexpected connections with other devices.
Here are some important considerations about activity maps:
- You can create activity maps for devices in Advanced, Standard, L2 Parent Analysis, and Flow Analysis. You cannot create an activity map for devices in Discovery Mode. For more information, see Analysis priorities.
- If you create an activity map for a device or device group that has no protocol activity during the selected time interval, the map appears without any data. Change the time interval or your origin selection and try again.
- You can create an activity map from a console to view device connections across all of your sensors.
- You can save and share an activity map , granting view or edit access to other system users or groups. You can also load a saved activity map to modify map properties.
For more information about activity maps, see the Activity Maps FAQ.
Navigate activity maps
After creating an activity map, you can start investigating data. The following sections provide details about how to interact with an activity map and find information about the data you are viewing.
Layout
Devices are represented by circles and connections are represented by lines.
The placement of devices is optimized to display information. The layout can change as data about device activity is updated in real-time. For example, the layout is updated as new connections are observed or devices become inactive.
| Note: | When the time interval in the upper left corner of the page is set to Last 30 minutes, Last 6 hours, or Last 1 day, activity map data continually updates every minute with real-time data. Set a custom time interval with a specific start and end time to stop real-time layout updates. |
2D or 3D layout
By default, activity maps are displayed in a 2D layout, but you can click 3D to change the display to a rotating 3D model. For example, you might want to showcase 3D maps on a large screen in a network or security operations center.
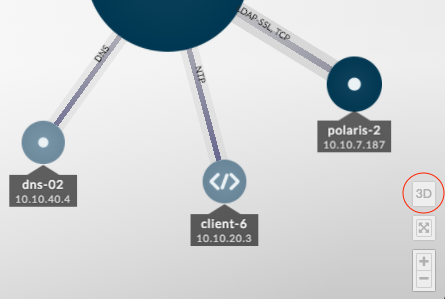
Reposition, rotate, and zoom
Zoom in and out of a map with controls located in the bottom right corner of the page or zoom with your mouse wheel. Click-and-drag your mouse to reposition a 2D map or rotate a 3D map.
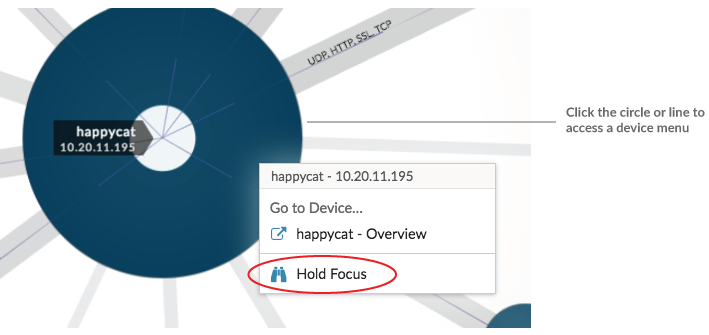
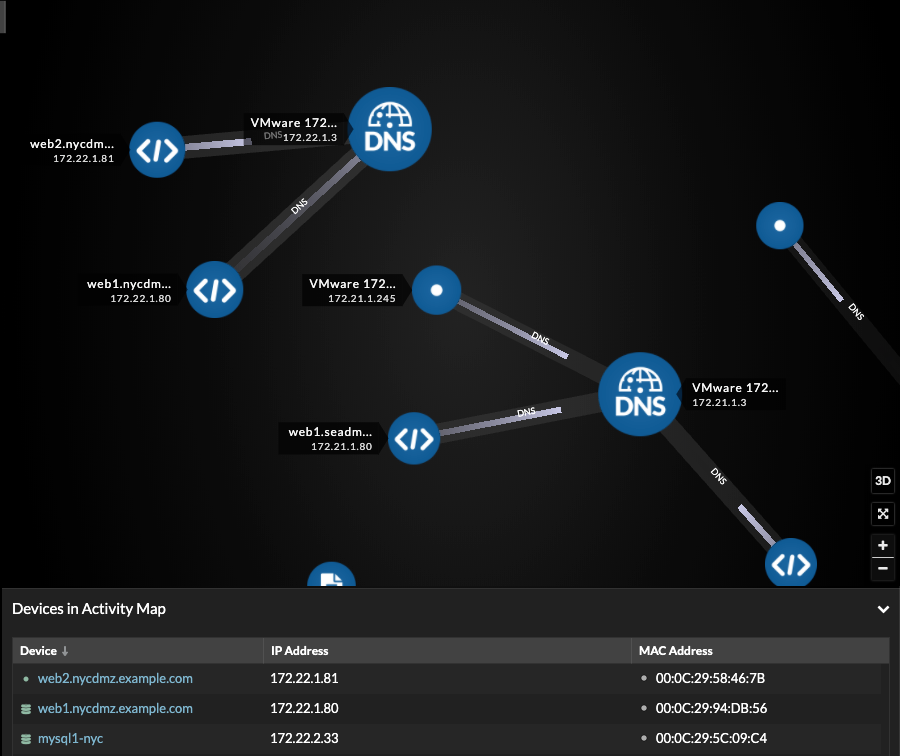
Labels and icons
Circle labels contain details such as the device hostname, IP address, or MAC address.
Line labels contain protocol names associated with the device connection and the direction of traffic flowing between the devices, which is displayed as animated pulses. Specific device roles are represented by an icon.
To optimize the display of information, not every label is displayed. Hover over any circle or line to display its label, as shown in the following figure.
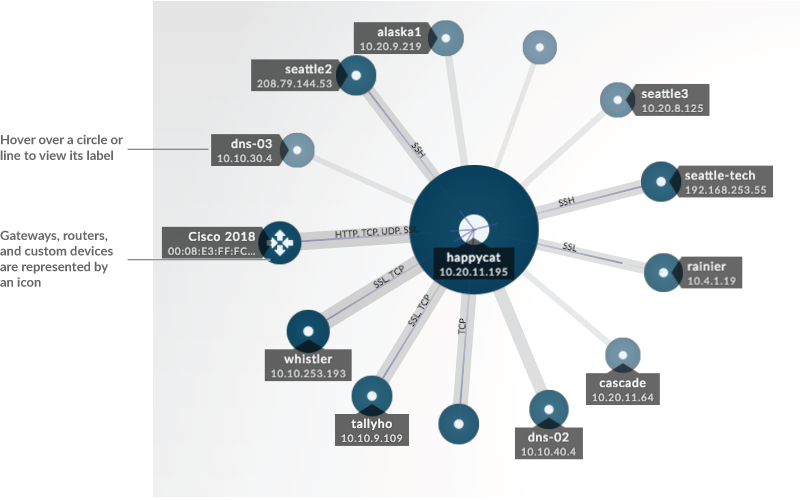
| Note: | Device roles are automatically assigned to a device based on the type of traffic the ExtraHop system observes for that device. For more information, see Change a device role. |
Circle and line size
The size of objects in the map corresponds with a metric value, which helps to highlight
areas of increased activity, such as the number of bytes, or traffic volume, associated with a
device connection.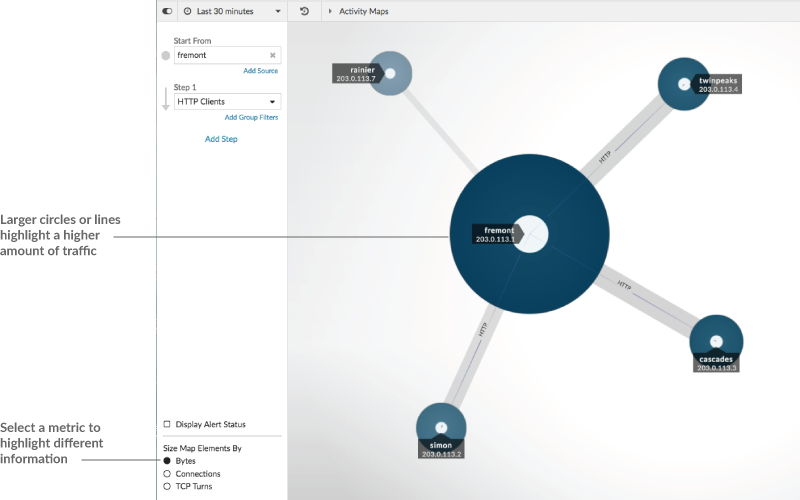
At the bottom of the left pane, you can select a different metric for map elements:
Bytes: See all of the devices transmitting or receiving data during the time interval.
Connections: See only the devices that have established a new connection at least once during the time interval.
TCP Turns: See only the devices that switched between transmitting and receiving data at least once during the time interval.
Color
Blue and gray are default colors for circles and lines. These default colors are optimized to display information in a map. However, you can apply different colors to your map to highlight the severity level of an alert or show when a device connection was established.
Detections
Detections associated with a device on the map appear around the circle as animated pulses, known as detection markers. The color of the pulse is red if the device is the offender and teal if the device is the victim of the detection. The participant status also appears on the device label.
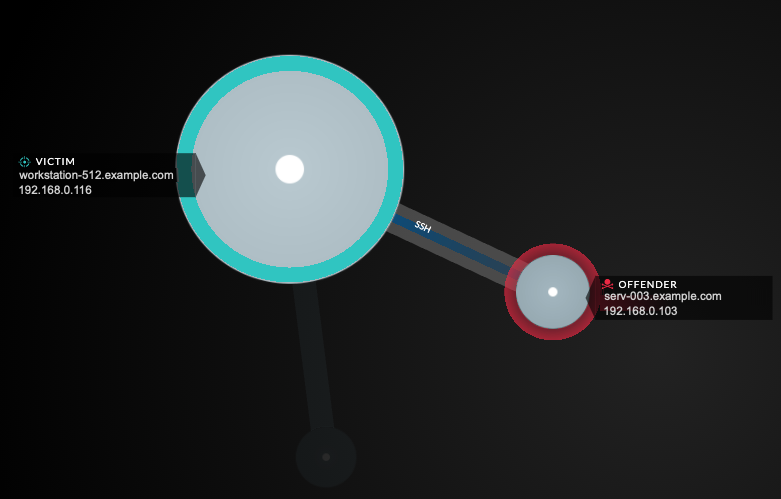
| Note: | Machine learning detections require a connection to ExtraHop Cloud Services. |
Click a circle with a detection marker to view and navigate to associated detections or the Device Overview page.
If detection markers do not appear on your activity maps as expected, detection markers might be disabled. You can enable or disable detection markers from the User menu.
Alert status (NPM module access required)
To see the severity level of an alert for a device in your map, select Display alert status in the lower left corner or the page, as shown in the following figure. The circle color then corresponds to the most severe status for all alerts assigned to a device during the time interval. If there is no alert assigned to a device or the alert level is informational, the default circle color is green.
To investigate the alert, click the circle and then select the device name in the Go to Device… section. On the device's protocol page, scroll down to view the Alerts page.
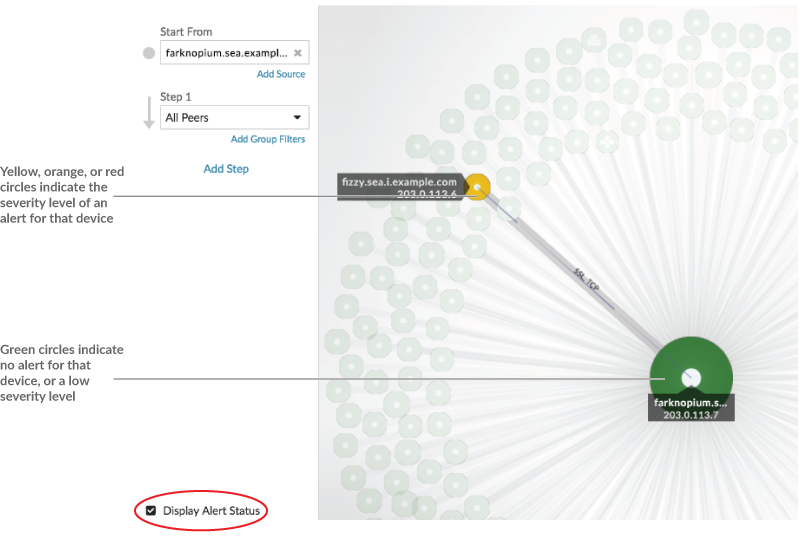
Time interval comparison
When you compare two time intervals to find metric deltas, different colors in the map help you determine when device connections were established or when the protocol activity for a device changed. For example, after creating a comparison between Yesterday and the Last 30 minutes, new device connections or activity that only appear in the more recent time interval appear green. Previous device connections or activity that only appear in the earlier time interval are red. Devices connections that did not change between time intervals are blue. In the following figure, new connections that were established in the last thirty minutes are represented by green circles and lines.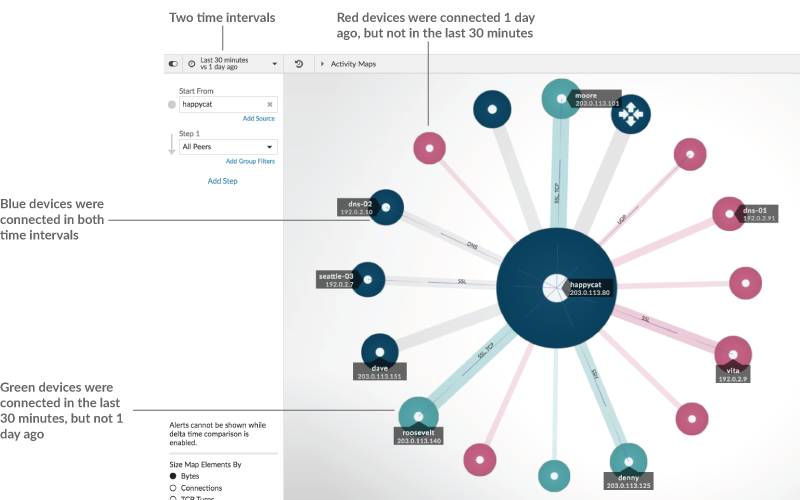
| Note: | If all the devices are a single color, such as green, this means that the query did not produce results in the earlier time interval. For example, the origin device did not have any protocol activity in the earlier time interval. |
Add steps and filters to a map
A step is a level of connections between devices. Devices in each step have a
relationship to devices in previous step. These relationship are defined by their protocol
activity. 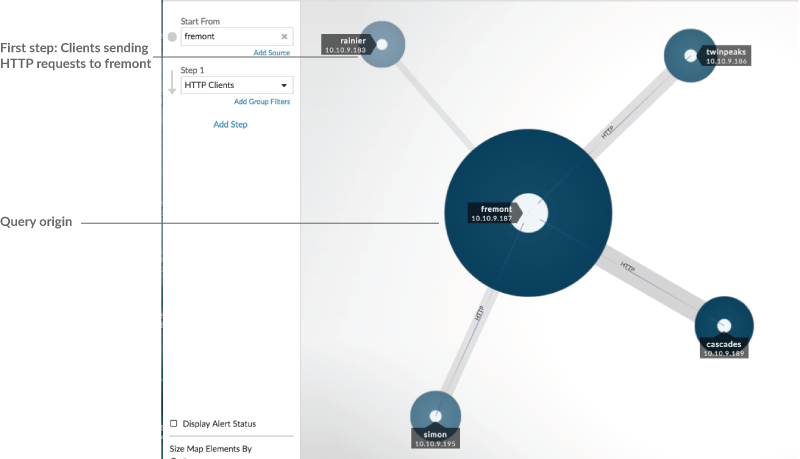
Add a new step to an activity map to add another layer of information to your map. Click the drop-down list for a particular step, and then select a protocol activity.
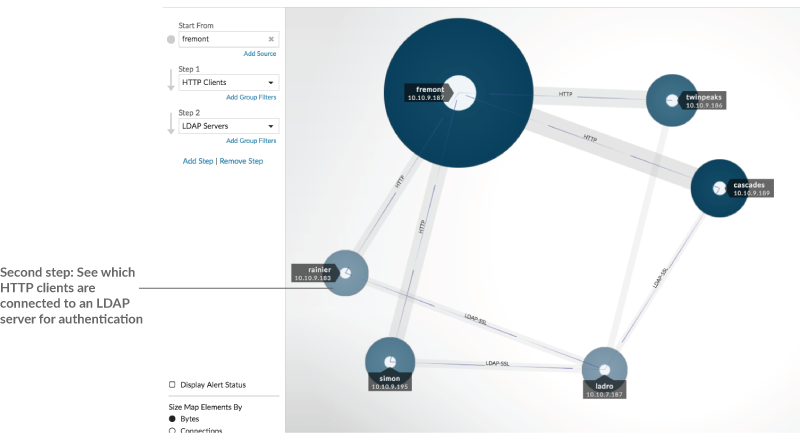
You can also filter devices in a step by their group membership. For example, if you select HTTP Servers but only want to see your test servers in the map, you can filter HTTP Servers by a device group, such as My Test Servers.
For more information on how to add steps and filters to a map, see Create an activity map.
Manage activity maps
The following options for managing your activity map are available from the command menu in the upper right corner:
- Save and share an activity map
- Load and manage a saved activity map
- Export activity map as a PDF, PNG, or SVG file
Best practices for investigating activity map data
If you find a device on your map that is worth investigating, you have several options to gather more information about that device.
- Find recently-connected devices
-
Click the time interval in the top left corner of the page and click Compare. You can see how device connections changed between two different time intervals.
For more information, see Time interval comparison.
- Navigate to protocol pages to find related metric activity
-
Click a circle or line to access a drop-down menu as shown in the following figure.
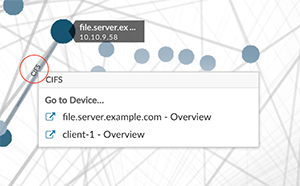
Select the device name from the menu to view the Device Overview page. From the left pane, click a protocol name to view the protocol page, which contains a summary of important protocol metrics that were observed and associated with the device. From a protocol page, you can find related metrics such as errors, requests, responses, and server processing time. You can also drill down on a metric from a protocol page to view metric details, such as server IP address, client IP address, status codes, methods, and URIs.
- Navigate to detections identified on the device
- Devices on an activity map that have associated detections are displayed as animated
pulses around the circle label. Click a circle with this detection marker to access a
drop-down menu, as shown in the following figure.
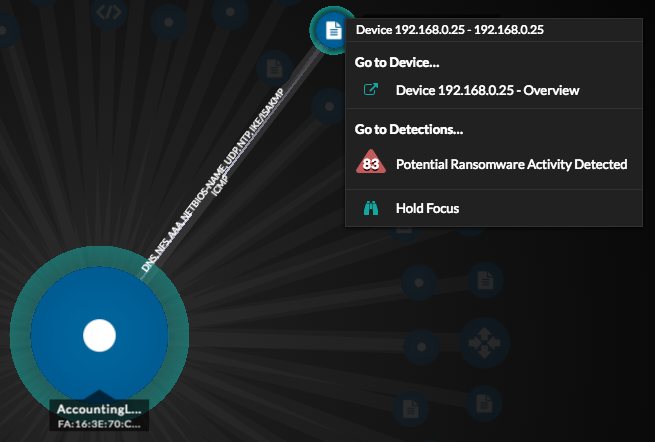
Select a detection name from the menu to navigate to the detail page for that detection. The detail page contains information about the type of detection that occurred and what it means, as well as when the detection occurred and the duration of the issue. For more information, see Detection detail page.
- Search for transaction records associated with a connection (Requires a configured recordstore)
- Click a circle or line to access the drop-down menu. Click Records. A records query page opens and displays all the records from each connected device, including all record types associated with the device connection protocols.
Create an activity map
An activity map is an interactive 2D or 3D display of real-time device connections based on protocol activity between devices. Activity maps help you visualize traffic flows and kick off troubleshooting based on an interesting data point in a map.
You can create an activity map for an active single device or a device group. After generating a basic map, you can then filter devices and connections in your map.
| Note: | You can create activity maps for devices in Advanced, Standard, L2 Parent Analysis, and Flow Analysis. You cannot create an activity map for devices in Discovery Mode. For more information, see Analysis priorities. |
Create a basic activity map
A basic activity map shows you a single step, or level, of device connections between origin devices and peer devices on your network.
| Note: | You can create activity maps for devices in Advanced, Standard, L2 Parent Analysis, and Flow Analysis. You cannot create an activity map for devices in Discovery Mode. For more information, see Analysis priorities. |
-
From the activity map, filter connections by protocol
activity by completing the following steps:
-
Click the drop-down list in the Step 1 section of
the left pane, as shown in the following figure.
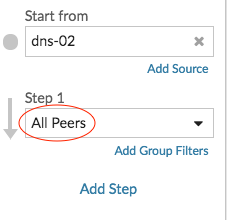
-
Click the drop-down list in the Step 1 section of
the left pane, as shown in the following figure.
- (Optional):
Change the primary origin device by completing the following steps:
-
In the Start from section in the left pane, click
the device or group name. A drop-down list appears.
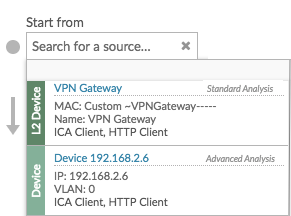
-
In the Start from section in the left pane, click
the device or group name. A drop-down list appears.
- (Optional):
Create an ad hoc group of sources to quickly investigate traffic originating
from multiple devices in the same map. Click Add
Source.
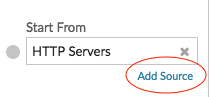
Add connections and filter devices in your map
To better understand the path of traffic from origin devices to downstream devices,
you can add more steps to your map. You can also create filters to include or exclude
devices from the map. The following figure shows you how to add steps and create
filters.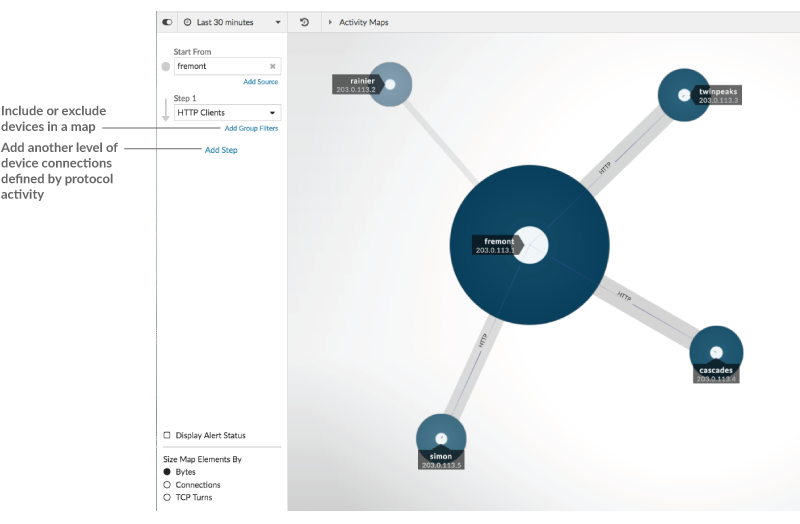
Add another level of device connections
A step defines a level of connection between devices in a map. Devices in each step have a relationship to the devices in the previous step. These relationships are defined by their protocol activity. You can add up to 5 steps to see how traffic flows from one device to another.
-
Click Add Step, as shown in the following figure.
All Peers is selected by default.
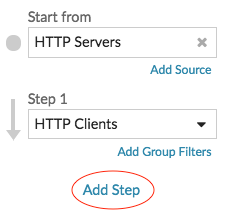
-
At the top of the drop-down list, search for and select a protocol activity and
role. You can make more than one selection.
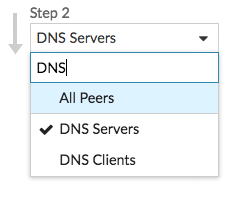
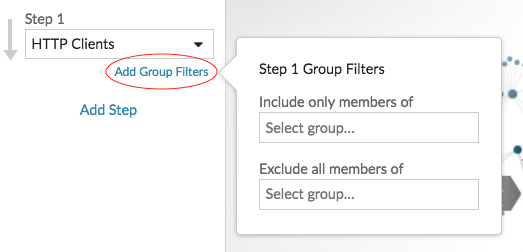
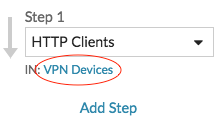
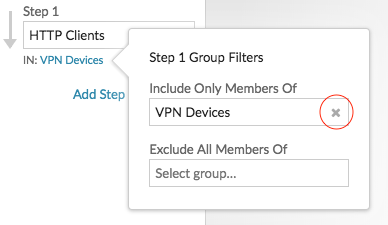
Save and share an activity map
You can save an activity map and share it with others. By default, all activity maps that you create are private, which means that no ExtraHop users can view or edit your map. However, you can share your map when you save it by granting view or edit access to other ExtraHop users and groups.
Here are some important considerations about sharing activity maps:
- How a user interacts with an activity map and the information they can view in the ExtraHop system is determined by user privileges, which are assigned by the ExtraHop administrator. For more information, see the User privileges section in the ExtraHop Administrators Guide.
- When you grant a user edit access, that user can modify and share the activity map with others. However, other users cannot delete the activity map. Only the map owner can delete an activity map.
- Group information is imported into the ExtraHop system from LDAP (such as OpenLDAP or Active Directory). User information is available after an ExtraHop user logs in to their account.
- If you are deleting a user, you will have the option to transfer their activity maps to another user.
The following steps show you how to save and share an activity map:
-
Click the Save icon
 in the upper
right corner of the page.
in the upper
right corner of the page.
-
Click Save.
Tip: You can also modify the properties for a saved map by clicking the command menu and then clicking Map Properties. To quickly
modify share permissions, click the command menu and then click
Share.
Next steps
- If you shared your map, copy the entire map URL from your browser and then send the URL to the users with access to your map.
- Load and manage a saved activity map.
- Remove or change access to an activity map
Remove or change access to an activity map
You can remove or modify access to an activity map that you granted to users and groups. You must first create an activity map to access options to modify saved activity maps.
-
Create an activity map, and then
click the Open icon
 in the upper right corner of the page.
- Click the activity map name.
-
In the Sharing section, complete one of the following steps:
- To remove access for users or groups, click the red delete x icon next to the user or group name.
- To change access for an existing user or group, click Can view or Can edit, and make a different selection.
- To add a new user or group, search for and click the user name. Click Can view or Can edit, and then click Add.
- Click Save.
Load and manage a saved activity map
You can view, update, or delete saved activity maps. First, you must first create a new map to access a list of saved and shared maps.
-
Create an activity map, and then
click the Open icon in the upper right corner of the page.
-
Choose one of the following activity map options:
- To load a map, click the map name. If you want to modify and then
re-save the map, make your changes and then click the
Save icon.
Tip: You can also modify the properties for a saved map by clicking the command menu and then
clicking Map Properties. - To delete a map, click Delete next to the map name.
Note: Users must have privileges to view or interact with activity maps. See User privileges in the ExtraHop Administrators Guide. - To load a map, click the map name. If you want to modify and then
re-save the map, make your changes and then click the
Save icon.
Detections
The ExtraHop system applies machine learning techniques and rule-based monitoring to your wire data to identify unusual behaviors and potential risks to the security and performance of your network.
Before you begin
Users must be granted privileges to view detections.When anomalous behavior is identified, the ExtraHop system generates a detection and displays the available data and options. Controls on the Detections page surface detections that are recommended for triage and help you filter and sort your views, so you can quickly focus on detections related to critical systems first.
- Collect high-quality, actionable data to find the root causes behind network issues.
- Find unknown issues with performance or infrastructure.
- Identify malicious behavior that is associated with different attack categories or MITRE techniques.
- View related detections or create your own investigation to group detections and track potential attack campaigns.
- Flag suspicious IP addresses, hostnames, and URIs identified by threat intelligence.
- Highlight security hardening best practices.
| Important: | Although detections can inform you about security risks and performance issues, detections do not replace decision-making or expertise about your network. Always review security and performance detections to determine the root cause of unusual behavior and when to take action. |
| Video: | See the related trainings: |
Viewing detections
In the upper left corner of the Detections page, there are four options for viewing detections: Summary, Triage, MITRE Map, and Investigations. These options each provide a unique view of your detections list.
Summary
By default, detections on the Detections page appear in Summary view, which aggregates information about detections to highlight patterns of activity in your environment. You can sort and group your detections list in Summary view to focus on frequently appearing detection types and the most active participants.
| Note: | By default, the Open status filter is applied to the Detections page. Click the Open filter to access other filter options. |
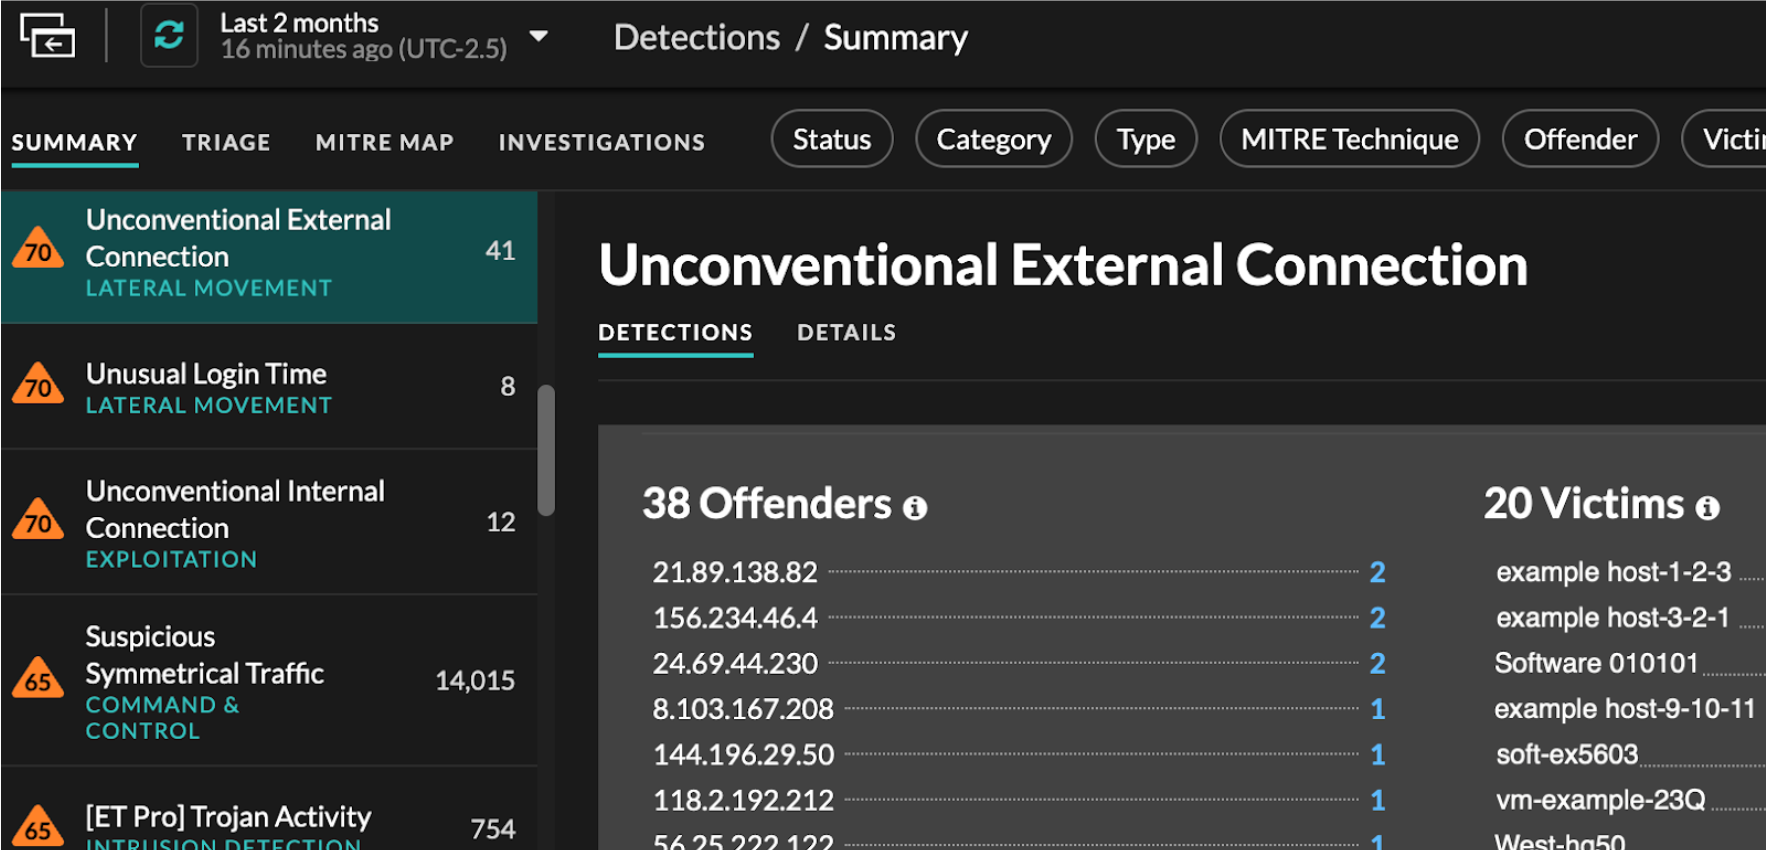
Sorting detections in Summary view
You can sort detections by either the highest risk score or most recent occurrence.
When sorted by Risk Score, detections that are recommended for triage appear first, followed by detections with the highest risk score.
When sorted by Most Recent, detections with the most recent end
time appear first. If two detections are still ongoing, the detection with the most
recent update time appears first. Click the sort icon ![]() above the detections list to select an
option.
above the detections list to select an
option.
Grouping detections in Summary view
You can group detections by the type of detection (such as Spike in SSH Sessions) or by detection source (such as offender IP address), or you can choose to not group your detections list at all.
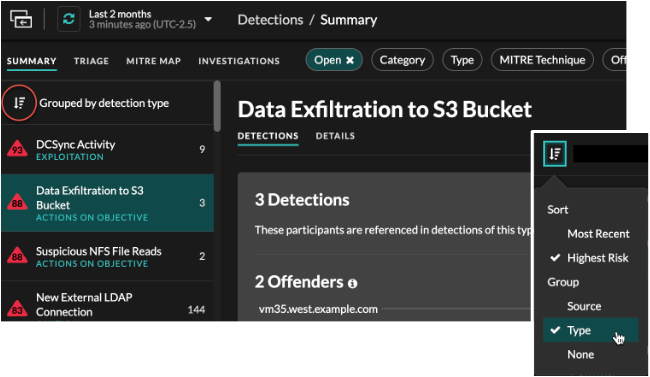
- Group by Type
- When grouping the Summary view by Type, you can view
lists of values associated with detections that occurred during the selected
time interval, such as participants, detection properties, or network
localities.
You can click participant values to learn more about that device or IP address. Click any value to view only detections associated with that value, or track all associated detections.
- Participants
- Lists all offenders and victims in the selected detection type. The Offender and Victim lists are ordered by the number of detections in which the participant appears.
- Property Values
- Lists the property values associated with the detection type. The Property Values list is ordered by the number of detections in which the property value appears.
- Network Localities
- Lists the network localities that contain detections of the selected type. The Network Localities list is ordered by the number of detections in the network locality.
You can scroll past the summary panel to view individual detection cards. Detections that are recommended for triage appear first.
- Group by Source
- When grouping the Summary view by Source, you can view participants that
are the source of a detection, with the number of detections displayed next to
the participant name. Click on a source to display the detections the device
appeared in as either an offender or victim. Click
Details under the device name to view a list of the
detection types that the device appeared in, then click a detection type to
filter by that detection type.
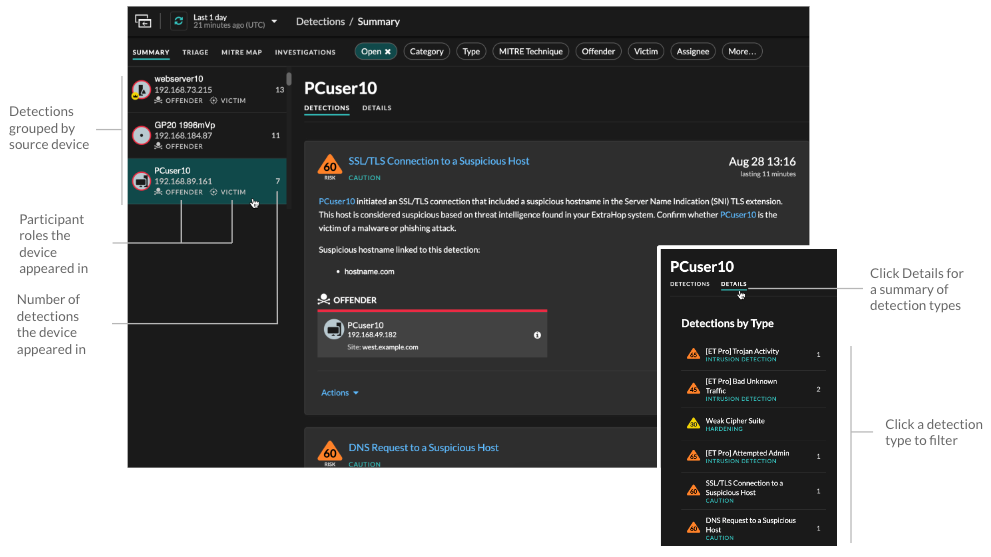
- Group by None
- When grouping by None on the Detections page, you can
view a timeline chart of the total number of detections identified within the
selected time interval. Each horizontal bar in the chart represents the duration
of a single detection and is color-coded according to the risk score.
- Click and drag to highlight an area on the chart to zoom in on a specific time range. Detections are listed for the new time interval.
- Hover over a bar to view the detection risk score.
- Click a bar to navigate directly to the detection detail page.
Triage
(NDR module only) The Triage view surfaces detections that ExtraHop recommends for triage based on contextual analysis of factors in your environment.
- Involves a high value asset
- The asset provides authentication or essential services, or an asset that was manually identified as high value.
- Involves a top offender
- The device or IP address has participated in numerous detections and a variety of detection types.
- Involves a rare detection type
- The detection type has no recent history of appearing in your environment. Uncommon detection types can indicate unique, malicious behavior.
- Involves a suspicious hostname or IP address
- The hostname or IP address is referenced in a threat collection that is enabled on your system.
Detections recommended for triage are prioritized in Summary view and appear at the top of your detections list regardless of sorting.
You can filter detections to display only detections that are recommended for triage and include Recommended for Triage as criteria for a notification rule.
- Recommendations based on high value assets are limited to a maximum of five detections of the same detection type over a two week period.
- Two weeks of sensor data is required before recommendations are made based on top offender or rare detection type factors.
- Recommendations based on threat intelligence are limited to two detections of the same detection type, for the same indicator of compromise, over a thirty day period.
MITRE map
Click the MITRE Map view if you want to display your detections by attack technique.
Each tile in the matrix represents an attack technique from the MITRE ATT&CK® Matrix
for Enterprise. If a tile is highlighted, the detection associated with that technique
occurred during the selected time interval. Click any tile to see detections that match
that technique.
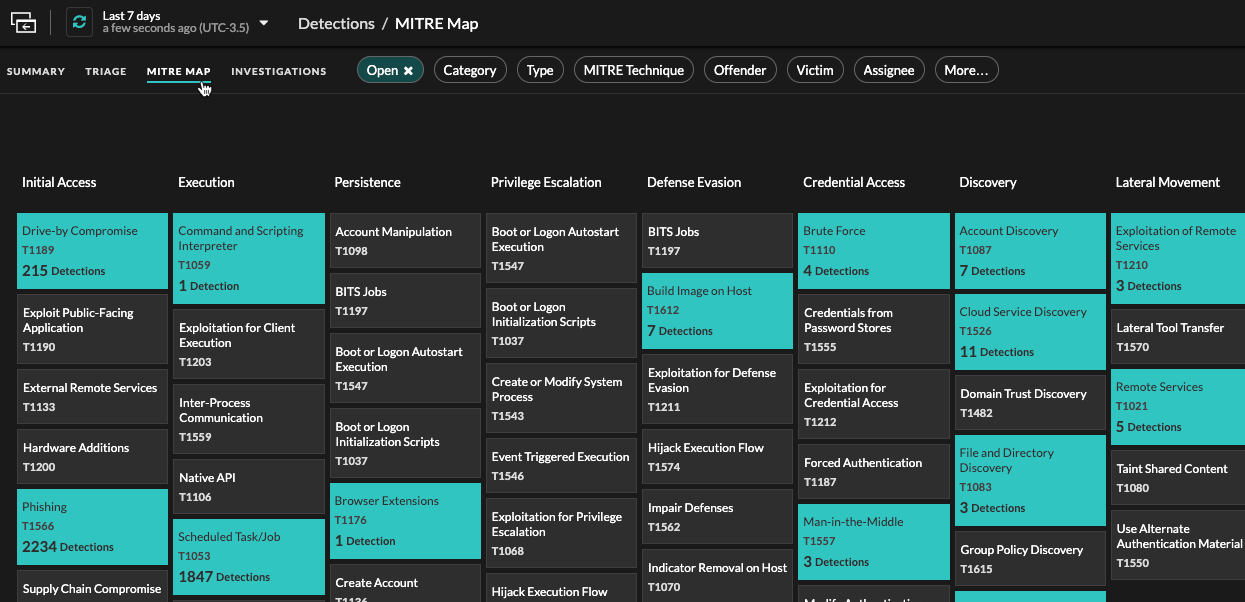
Investigations Table
The Investigations view displays all created investigations.
Click an investigation name to open the investigation. Learn more about Investigations.
Filtering detections
You can filter the Detections page to display only the detections that match your specified criteria. For example, you might only be interested in exfiltration detections that occur over HTTP, or detections associated with participants that are important servers.
Status
You can filter detections with a specific detection status, such as Acknowledged, In Progress, or Closed. By default, the Open status filter is applied to the Detections page. Click the Open filter to access other filter options.
You can select the Hidden status to only show detections that are currently hidden by tuning rules.
Category
You can filter by Attack or Operations detections, or you can select a more specific category to further refine your view of the Detections page. When you click the Category filter, most categories listed under the All Attack Categories and All Operations Categories options are sorted by the number of detections in the category. Hardening detections always appear at the end of the list.
Attack detections include the following categories that match phases of the attack chain.
- Command & Control
- An external server that has established and maintained connection to a compromised device on your network. C&C servers can send malware, commands, and payloads to support the attack. These detections identify when an internal device is communicating with a remote system that appears to be acting as a C&C server.
- Reconnaissance
- An attacker is seeking high-value targets and weaknesses to exploit. These
detections identify scans and enumeration techniques.
Note: Detections might identify a known vulnerability scanner such as Nessus and Qualys. Click the device name to confirm if the device is already assigned a Vulnerability Scanner role in the ExtraHop system. To learn how to hide detections related to these devices, see Tune detections. - Exploitation
- An attacker is taking advantage of a known vulnerability on your network to actively exploit your assets. These detections identify unusual and suspicious behaviors associated with exploitation techniques.
- Lateral Movement
- An attacker has infiltrated your network and is moving from device to device in search of higher-value targets. These detections identify unusual device behavior associated with east-west corridor data transfers and connections.
- Actions on Objective
- The attacker is close to achieving their objective, which can vary from stealing sensitive data to encrypting files to ransom. These detections identify when an attacker is close to completing a campaign objective.
- Caution
- Highlight activity that does not present an imminent threat to operations, but should be addressed to sustain a healthy security posture. These detections also identify activity by suspicious participants that are associated with threat intelligence.
Operation detections include the following categories.
- Authentication & Access Control
- Highlight unsuccessful attempts by users, clients, and servers to log in or access resources. These detections identify potential WiFi issues over authentication, authorization, and audit (AAA) protocols, excessive LDAP errors, or uncover resource-constrained devices.
- Database
- Highlight access problems for applications or users based on analysis of database protocols. These detections identify database issues, such as database servers that are sending an excessive number of response errors that might cause slow or failed transactions.
- Desktop & App Virtualization
- Highlight long load times or poor quality sessions for end users. These detections identify application issues, such as an excessive number of Zero Windows, which indicates that a Citrix server is overwhelmed.
- Network Infrastructure
- Highlight unusual events over the TCP, DNS, and DHCP protocols. These detections might show DHCP issues that are preventing clients from obtaining an IP address from the server, or reveal that services were unable to resolve hostnames due to excessive DNS response errors.
- Service Degradation
-
Highlight service issues or performance degradation associated with Voice over IP (VoIP), file transfer, and email communications protocols. These detections might show service degradations where VoIP calls have failed and provide the related SIP status code, or show that unauthorized callers have attempted to make several call requests.
- Storage
- Highlight problems with user access to specific files and shares found when evaluating network file system traffic. These detections might show that users were prevented from accessing files on Windows servers due to SMB/CIFS issues, or that network-attached storage (NAS) servers could not be reached due to NFS errors.
- Web Application
- Highlight poor web server performance or issues observed during traffic analysis over the HTTP protocol. These detections might show that internal server issues are causing an excessive number of 500-level errors, preventing users from reaching the applications and services they need.
Hardening detections identify security risks and opportunities to improve your security posture.
- Hardening
- Highlight security hardening best practices that should be enforced to mitigate the risk of exploitation. These detections identify opportunities to improve the security posture of your network, such as preventing credential exposure and removing expired SSL/TLS certificates from servers. After you click a hardening detection, you can apply additional filters to view specific detections within that hardening detection type. Learn more about filtering and tuning hardening detections.
Intrusion Detection System (IDS) detections identify security risks and malicious behavior.
- Intrusion Detection
- Highlight network traffic that matches known signatures of unsafe practices,
exploit attempts, and indicators of compromise related to malware and
command-and-control activity.
Important: While IDS detections include links to packets for all protocol types, links to records are only available for L7 protocols.
Type
Filter your detection list by a specific detection type, such as Data Exfiltration or Expired SSL Server Certificates. You can also type a CVE identification number into this filter to only show detections for a specific public security vulnerability.
MITRE Technique
Highlight detections that match specific MITRE technique IDs. The MITRE framework is a widely recognized knowledgebase of attacks.
Offender and Victim
The offender and victim endpoints associated with a detection are known as participants. You can filter your detection list to only show detections for a specific participant, such as an offender that is an unknown remote IP address, or a victim that is an important server. Gateway or load balancer devices that are associated with external endpoint participants can also be specified in these filters.
More Filters
- Recommended for Triage
- Device roles
- Source
- Site (console only)
- Ticket ID filter (Third-party ticketing systems only)
- Minimum Risk Score
Navigating detections
After you select how to view, group, and filter your detections list, click any detection card to navigate to the detection detail page.
Detection cards
Each detection card identifies the cause of the detection, the detection category, when the detection occurred, and the victim and offender participants. Security detections include a risk score.
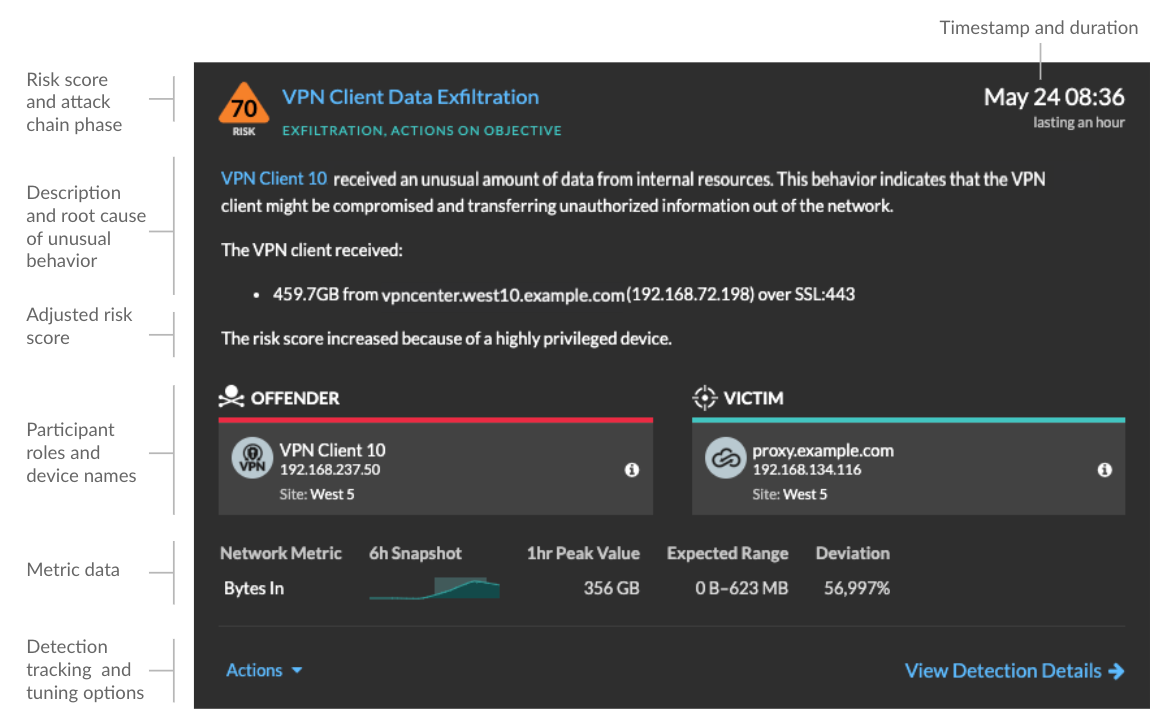
- Risk score
- Measures the likelihood, complexity, and business impact of a security detection. This score provides an estimate based on factors about the frequency and availability of certain attack vectors against the necessary skill levels of a potential hacker and the consequences of a successful attack. The icon is color coded by severity as red (80-99), orange (31-79), or yellow (1-30).
- Participants
- Identifies each participant (offender and victim) involved in the detection by
hostname or IP address. Click on a participant to view basic details and access links.
Internal endpoints display a link to the Device Overview page; external endpoints
display the geolocation of the IP address, endpoint lookup links such as
ARIN Whois and a link to the IP address detail page. If a participant has passed through
another device like a load balancer or gateway, both the participant and the device are
displayed on the participant card, but only the origin endpoint is considered a
participant.
Note: SSL/TLS decryption is required to display origin endpoints if HTTPS is enabled. Learn more about SSL/TLS decryption. When grouping by Type, a summary panel appears under the detection type that breaks down detections by offender and victim and enables you to quickly apply participant filters.
When grouping by Source, internal device role icons are highlighted red if the device was an offender in a detection and teal if the device was a victim. You can click Details under the source name to view a summary of detections where that source was a participant. These device details are displayed next to the detection card on wide screens (1900 pixels or greater).
- Duration
- Identifies how long the unusual behavior was detected or displays ONGOING if the
behavior is currently occurring.
Detections that highlight security hardening best practices display two dates: the first time and the most recent time that the violation was identified.
- Metric data
- Identifies additional metric data when the unusual behavior is associated with a
specific metric or key. If metric data is unavailable for the detection, the type of
anomalous protocol activity appears.
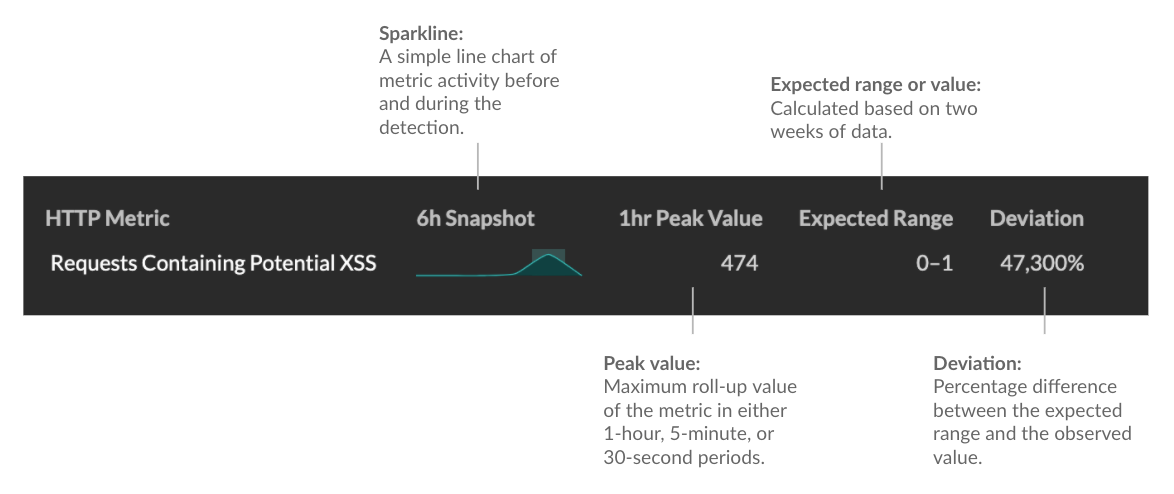
- Detection management
- You can track or tune the detection from the Actions dropdown list, or click View Detection Details to navigate to the detection detail page.
Detection detail page
Most of the data that you need to understand and validate a detection appears on the detection detail page: tables of relevant metric data, record transactions, and links to raw packets.
The detection card information is followed by all available sections for the detection. These sections vary depending on the type of the detection.
- Track Detection
- You can track or tune the detection, or click
Add to an Investigation to include the detection in a new or
existing investigation.
If you have configured a CrowdStrike integration on your ExtraHop system, you can initiate containment of CrowdStrike devices that are participants in the detection. (Reveal(x) 360 only.)
- Decryption badge
- When the ExtraHop system identifies suspicious behavior or a potential attack in
decrypted traffic records, the detection detail page displays a decryption badge to the
right of the detection name.
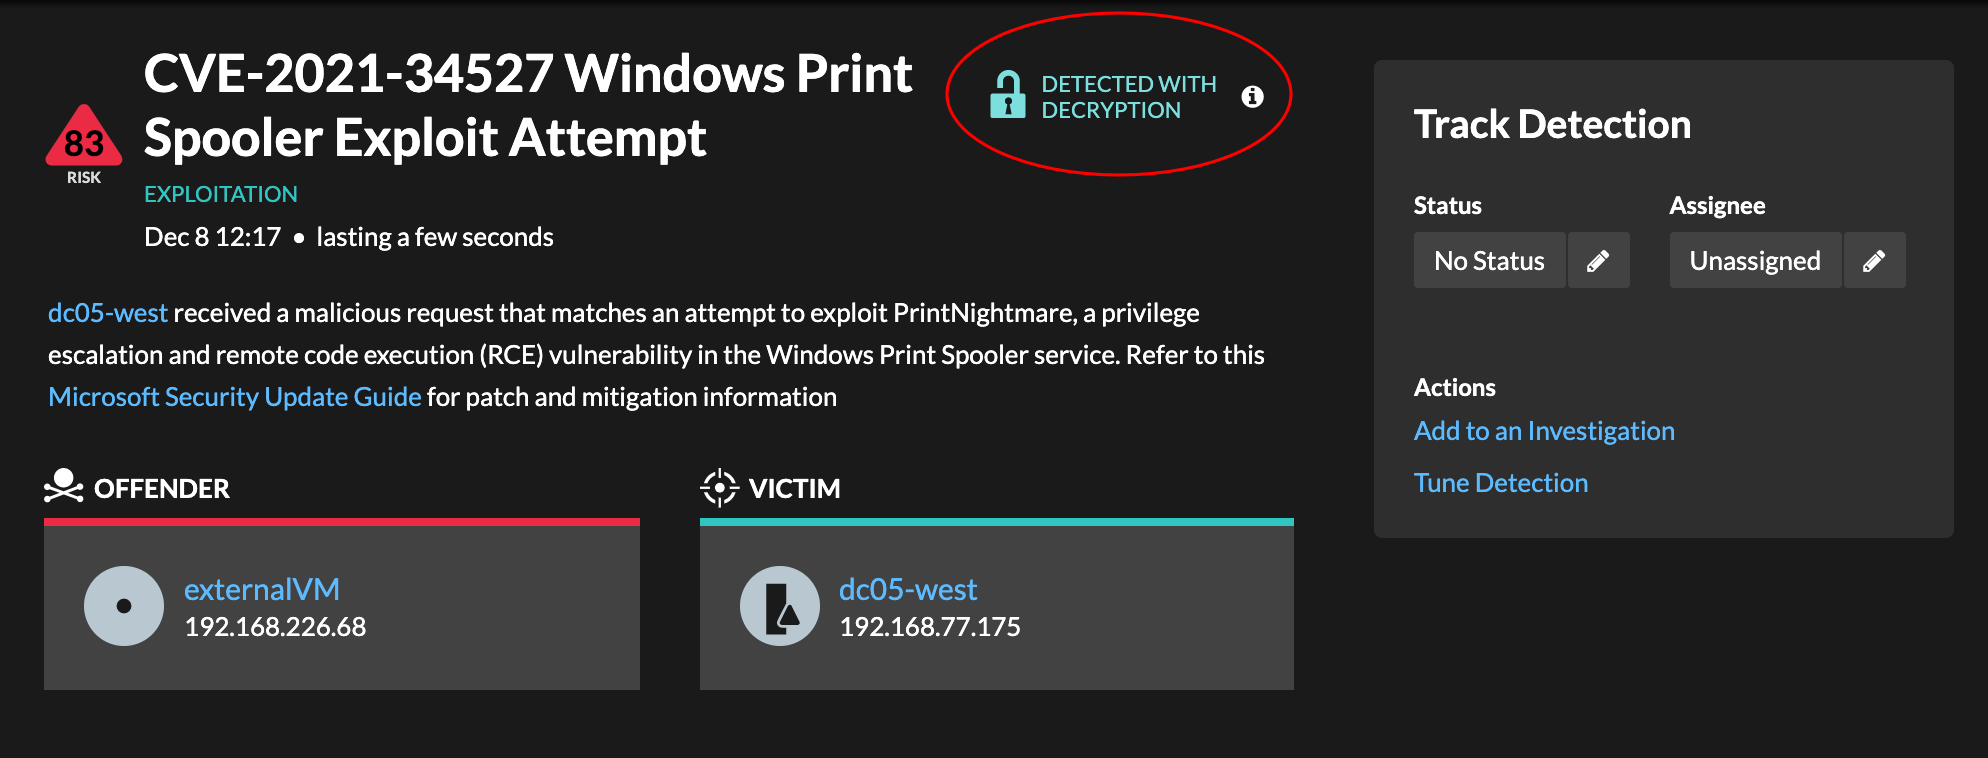
Learn more about SSL/TLS decryption and decrypting traffic with a Windows domain controller.
- Detection properties
- Provides a list of properties that are relevant to the detection. For example,
detection properties can include a query, URI, or hacking tool that is central to the
detection.
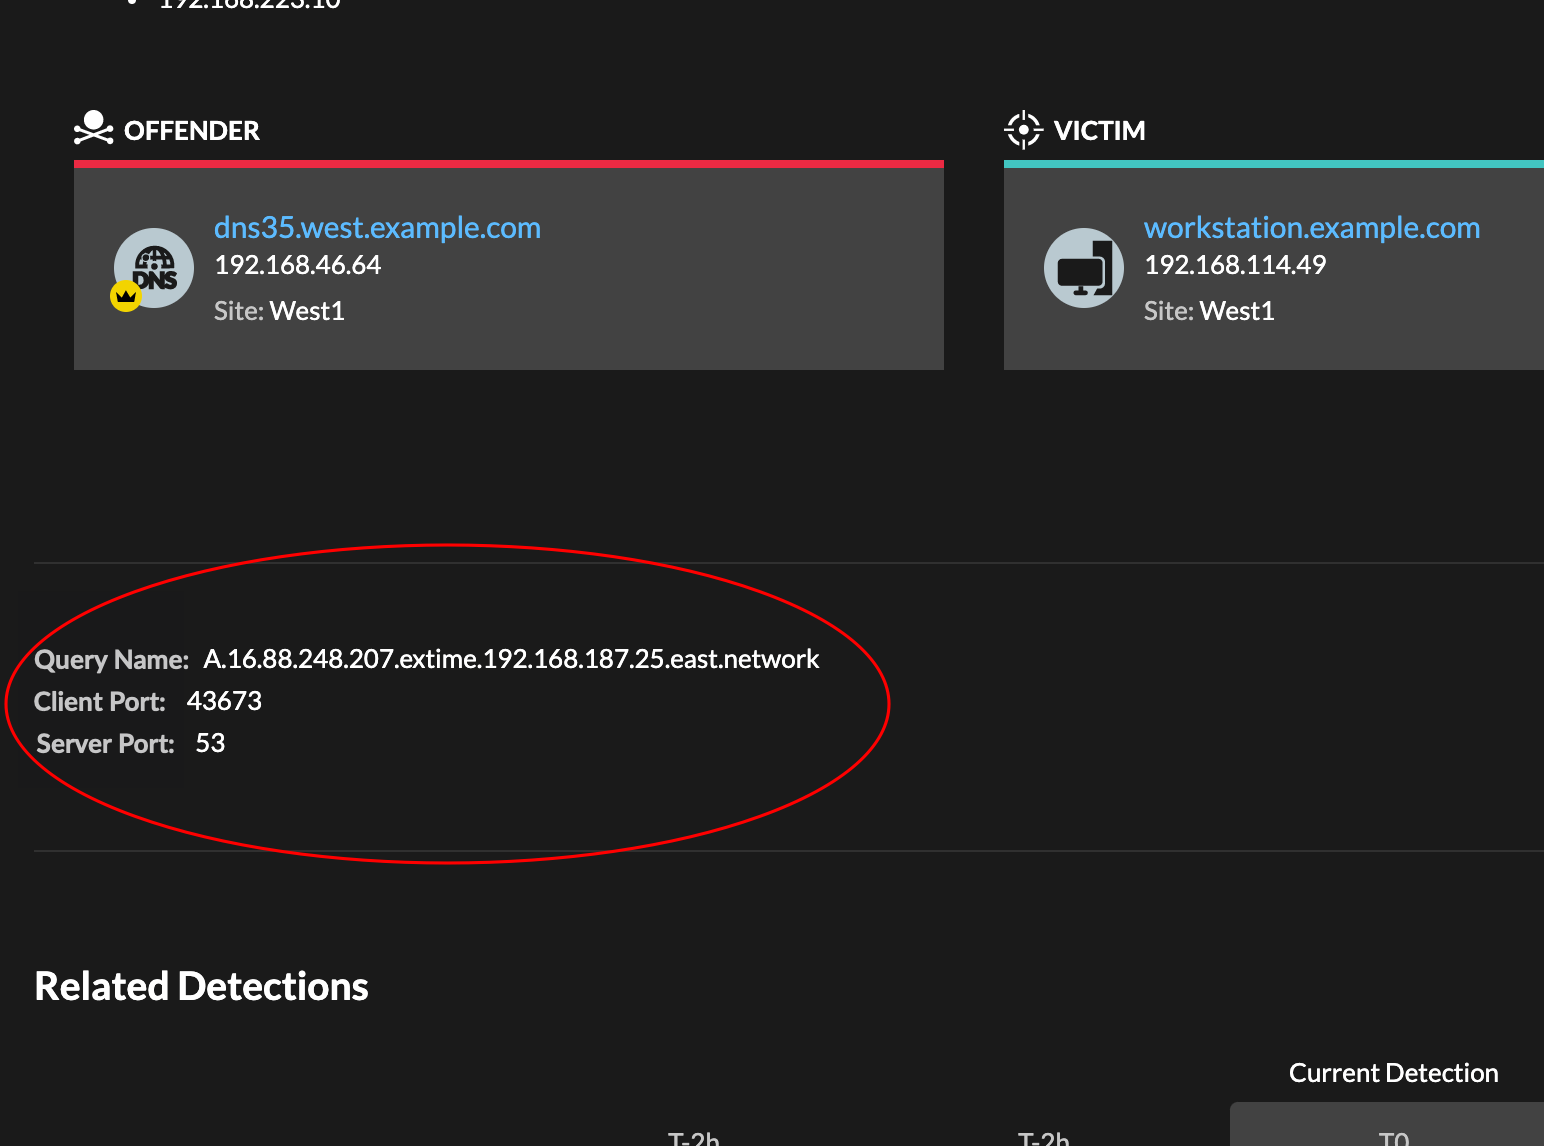
- Activity map
-
Provides an activity map that highlights the participants involved in the detection. The activity map displays east-west traffic of the protocol associated with the detection to help you assess the scope of malicious activity. Click the victim or offender to access a drop-down menu with links to the Device Overview page and other detections where the device is a participant.
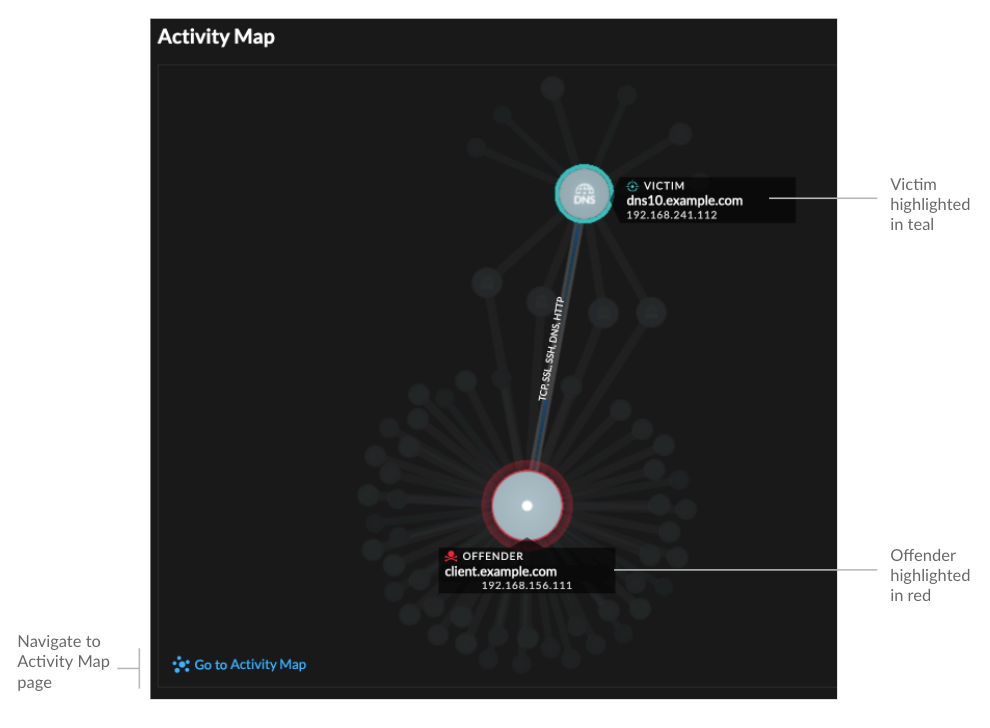
- Detection data and links
-
Provides additional data associated with the detection to investigate. The types of data can include related metrics, links to record transaction queries, and a link to a general packets query. The availability of metrics, records, and packets vary by detection. For example, IDS detections include links to packets for all protocol types, but links to records are only available for L7 protocols.
Metric data and record transactions are displayed in tables. In a metrics table, click the icon
 to
view related record transactions. In a records table, click the icon
to
view related record transactions. In a records table, click the icon  to view the
related packet query for a transaction.
to view the
related packet query for a transaction. Note: A recordstore must be configured to view transactions and continuous packet capture must be configured to download packets. - Compare behaviors
-
Provides a chart that displays the activity of the offender next to the activity of similar devices over the time period when the detection occurred. The chart appears for detections related to unconventional activity by a device, and highlights unexpected behavior by displaying it next to the behavior of devices on the network with similar properties.
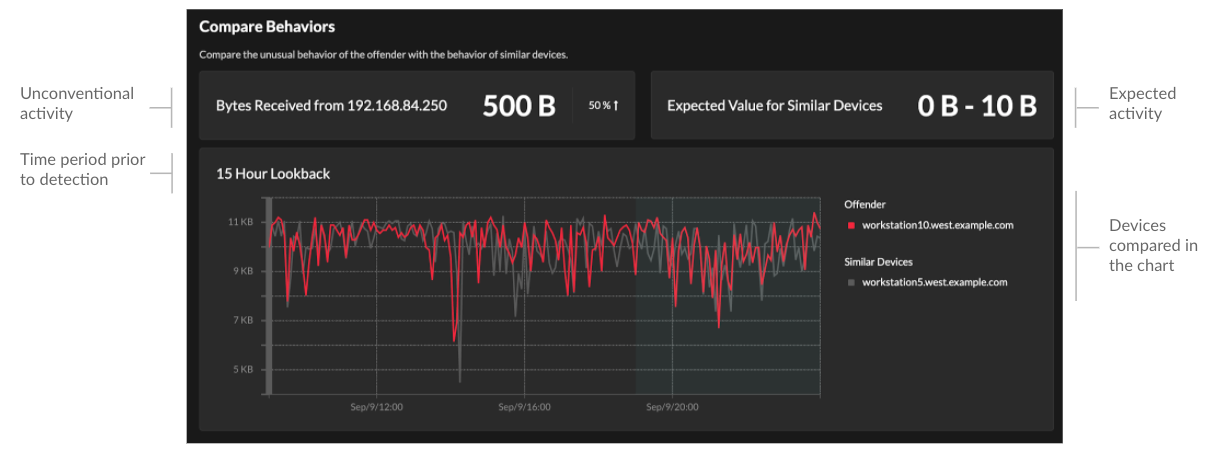
- Related detections
- Provides a timeline of detections related to the current detection that can help you
identify a larger attack campaign. Related detections include the participant role,
duration, timestamp, and any role changes if the offender in one detection becomes the
victim in a different detection. Click any related detection in the timeline to view the
details page for that detection.
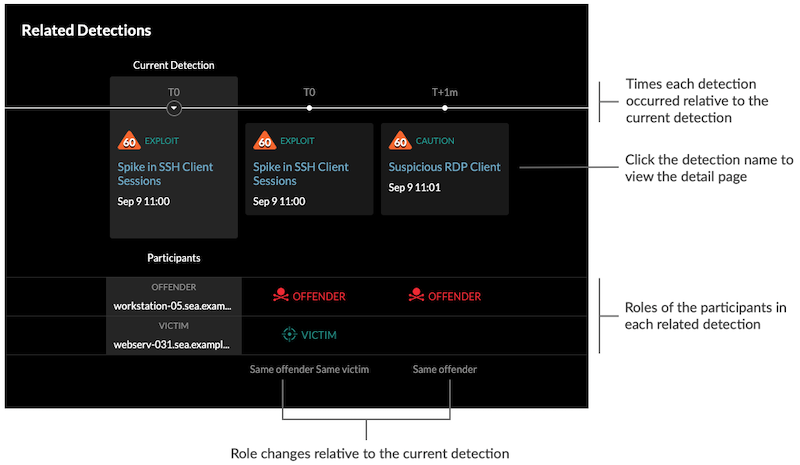
- Detection details
- Provides an expanded description of the detection, such as associated MITRE
techniques, risk factors, attack backgrounds and diagrams, mitigation options, and
reference links to security organizations such as MITRE.
These details are displayed next to the detection card on wide screens (1900 pixels or greater), or you can access them by clicking Details under the detection title when grouping the Detection page by Types.
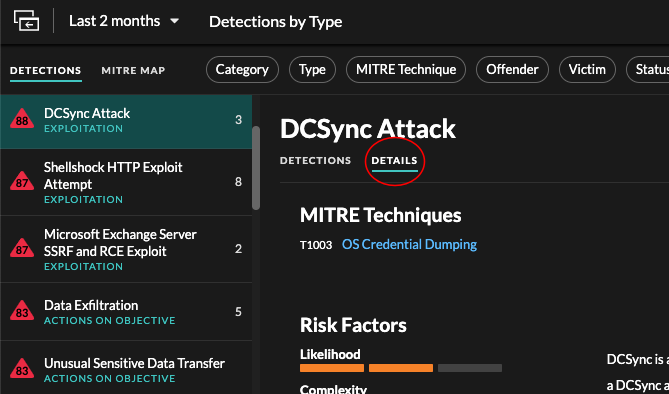
Tip: You can share detection detail pages with other ExtraHop users.
Detection Catalog
The Detection Catalog provides a complete list of all detection types in the ExtraHop system, including detection types that are currently inactive or in review. You can also manage custom detection types from the Detection Catalog page.
You can access the Detection Catalog page by clicking the System Settings icon
![]() .
.
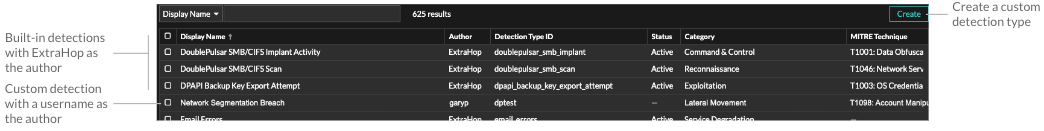
In addition to the display name and author, you can filter the detection type list by ID, status, category, MITRE techniques associated with the detection type, and detection types that support data from flow sensors.
Click an ExtraHop-authored detection to view the Detection Type Settings panel, which displays the detection type name, ID, author, current status of the detection type, the date that the detection type was first released to production (when available), and associated categories. To learn more about the detection, click Detection Type Details.
Detection type status
- Active
- Active detection types are available for all sensors and can generate detections in your environment.
- Inactive
- Inactive detection types have been removed from all sensors and will no longer generate detections. When a detection type becomes Inactive, existing detections of that type will continue to display.
- In Review
- In Review detection types are evaluated on a limited number of ExtraHop systems before they are available for all sensors. These detection types pass a thorough review for efficiency and accuracy before they are made available to an increasing number of sensors. The review period can last up to several weeks. After review is complete, the detection type status is updated to Active.
Here are some important considerations about whether detections of a certain type are visible in your environment:
- If you do not see Active detections as expected, the detection type might require decryption or might not support flow sensors (Reveal(x) 360 only).
- Reveal(x) Enterprise systems must be connected to Cloud Services to receive frequent updates to the Detection Catalog. Without a connection to Cloud Services, updates are delayed until firmware is upgraded.
Custom detections
- To create a custom detection type, click Create in the upper right corner of the page. The detection type ID for the new detection type must match the ID included in the custom detection trigger. Learn more about creating a custom detection.
- To edit a custom detection, click the detection and edit the display name, author, detection categories, and associated MITRE techniques in the Edit Detection Type panel. You cannot edit detections where ExtraHop is listed as the author.
- To delete a custom detection, click the detection, and then click Delete from the Detection Type Settings panel.
- Custom detections always display a dash (-) under Status.
Investigations
(NDR module only) Investigations enable you to add and view multiple detections in a single timeline and map. Viewing a map of connected detections can help you determine whether suspicious behavior is a valid threat and if a threat is from a single attack, or part of a larger attack campaign.
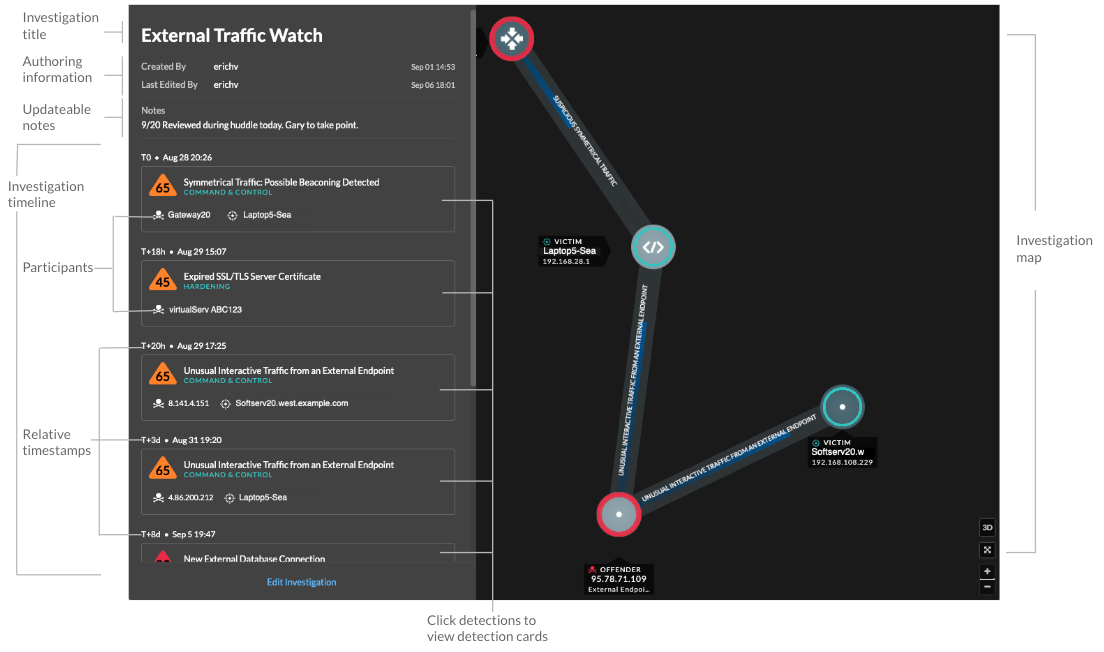
You can create and add to investigations from a detection detail page or from the Actions menu on each detection card.
- Investigation Timeline
-
The timeline appears on the left side of the page and lists the added detections in chronological order. New detections that are added appear in the timeline according to the time and date the detection occurred and relative to the earliest detection, which is labeled T0. Detection participants are displayed under the detection title and detection tracking information, such as assignee and status, is displayed next to the participants.
Click a detection in the timeline to view the detection card and highlight the detection participants in the investigation map. Click a participant on the card or in the investigation map to view basic details and links to the Device Overview page and other detections where the device is a participant.
In the upper right corner of the detection card click the go to
icon to view the
detection detail page, or the x icon
to close the detection and return to the investigation timeline. 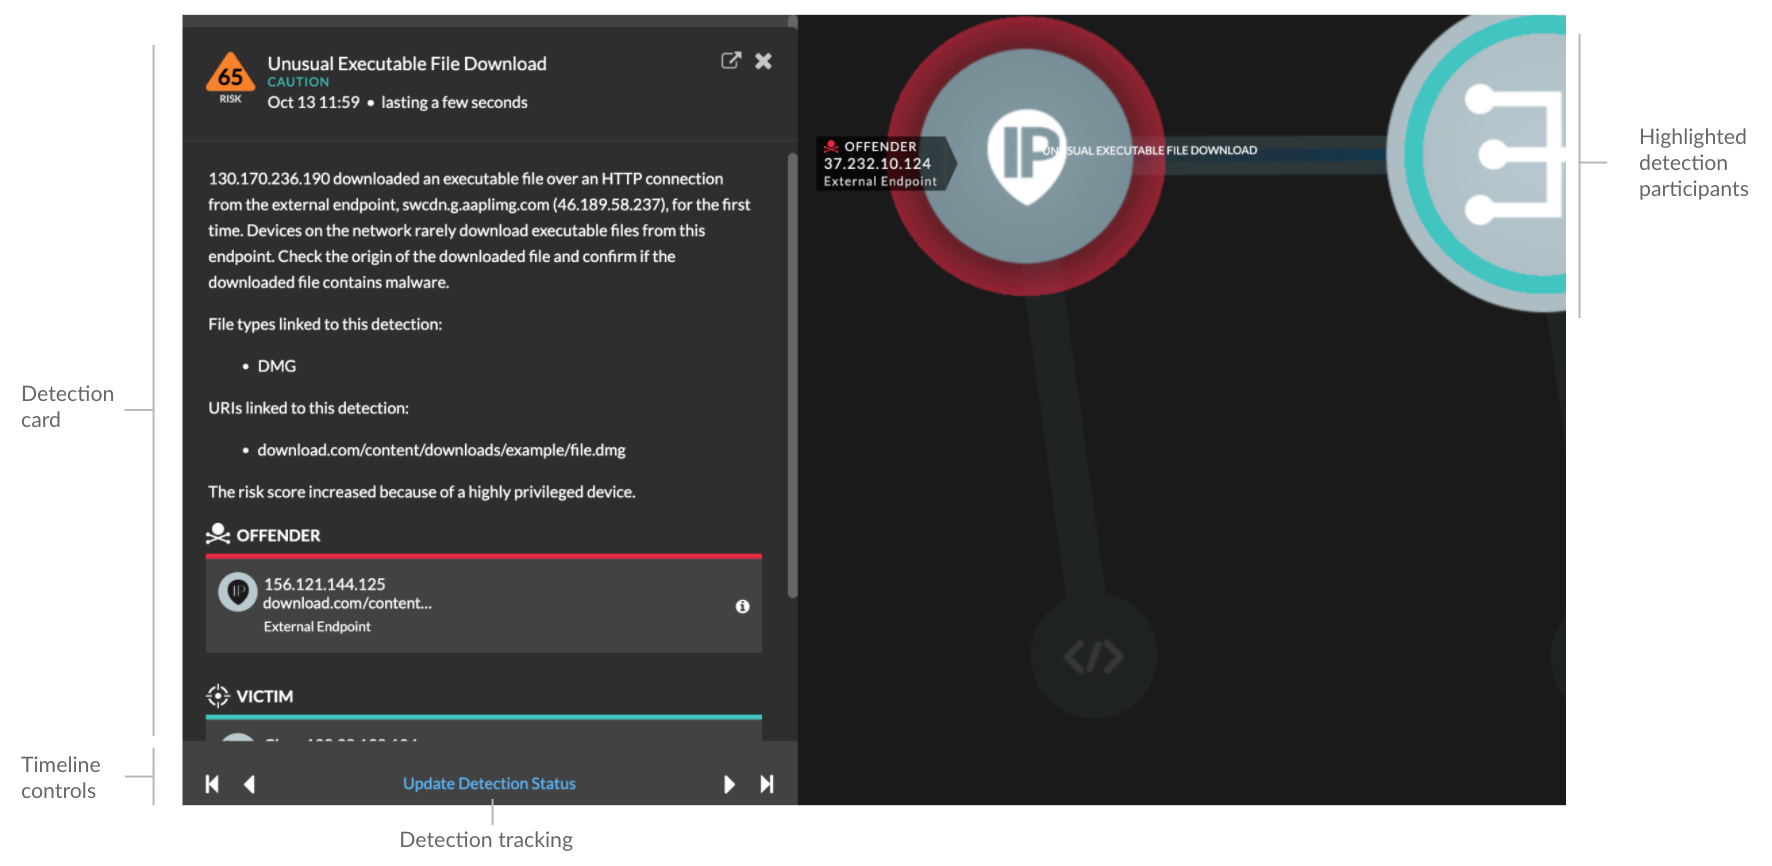
Below the detection card, click Track Detection to edit detection tracking information. You can click the timeline controls to view other detections in the investigation.
- Investigation Map
- The investigation map displays the offender and victim from every detection
in the investigation. The participants are connected by lines that are
labeled with the detection type, and device roles are represented by an
icon.
- Click a detection in the investigation timeline to highlight participants. Circles are highlighted red if the device is the offender and teal if the device is the victim. Highlights are updated when you click a different detection to help you identify when a participant changes from victim to offender.
- Click a circle to view details such as the device hostname, IP address, or MAC address, or to navigate to associated detections or the Device Overview page.
- Hover over any circle or line to display the label.
- Notes
- Click Edit Investigation to add notes or change the investigation name. You can continue to track individual detections after you add them to an investigation.
Navigating investigations
After a detection is added to an investigation, a link to the investigation appears at the bottom of the detection card and on the detection detail page.
Click the name to open the investigation and then click the name of the detection on the
investigation page to return to the detection detail page.
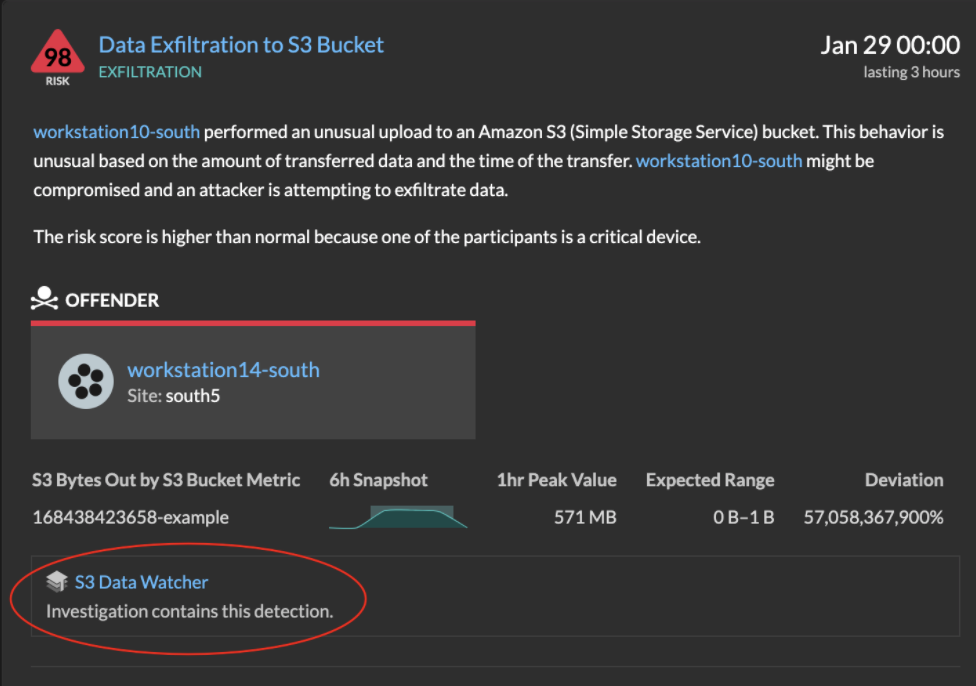
Learn how to create an investigation.
Finding detections in the ExtraHop system
While the Detections page provides quick access to all detections, there are indicators and links to detections throughout the ExtraHop system.
| Note: | Detections remain in the system according to your system lookback capacity for 1-hour metrics, with a minimum storage time of five weeks. Detections will remain in the system without supporting metrics if your system lookback capacity is less than five weeks. |
- From a Device Overview page, click Detections to view a list of associated detections. Click the link for an individual detection to view the detection details page.
- From a Device Group Overview page, click the Detections link to go to the Detections page. The detections list is filtered to the device group as the source.
- From a device or device group protocol page, click the Detections link to go to the Detections page. The detections list is filtered to the source and protocol.
- On an activity map, click a device that displays animated pulses around the circle label to view a list of associated detections. Click the link for an individual detection to view detection details.
- From a chart on a dashboard or protocol page, hover over a detection marker to display the title of the associated detection or click the marker to view detection details.
Optimizing detections
Here are some best practices you should implement to improve your detections: add details about your network, enable the ExtraHop system to see potentially-suspicious traffic, and filter your page view by your priorities.
Most of these settings provide context about your network that you can provide to enhance both machine-learning and rules-based detections—these settings are sometimes overlooked and can affect the quality of your detections.
- Configure decryption
- Encrypted HTTP traffic is a common vector for attacks, in part because attackers
know the traffic is typically hidden. And if your network has Active Directory,
a number of detections are hidden in encrypted traffic across the domain.
We strongly recommend that you enable decryption for SSL/TLS and Active Directory.
- Configure Tuning Parameters
- This setting improves the accuracy of rules-based detections. You provide the ExtraHop
system with details about your network environment to provide context
about the observed devices.
For example, a rules-based detection is generated when an internal device communicates with external databases. If traffic to an external database is expected or the database is part of a legitimate cloud-based storage or production infrastructure, then you can set a tuning parameter to ignore traffic to the approved external database.
- Configure Network Localities
- This setting enables you to classify internal or
external endpoints and domains that you trust, such as a trusted
domain that your devices regularly connect to. Machine-learning detections and
system metrics rely on device and traffic classifications.
For example, if your devices regularly connect to an unknown but trusted domain that is classified as an external IP address, detections are suppressed for that domain.
- Tune detections
- These settings enable you to hide or suppress detections after the system has generated them. If
you see a detection that does not add value, you can reduce the noise from your
overall view.
For example, if a detection is generated with an offender, victim, or other criteria that is not a concern for your network, you can hide all past and future detections with that criteria from view.
- Share plaintext external data
- This option allows the Machine Learning Service to collect IP addresses, hostnames, and
domains that are associated with suspicious activity.
By enabling this option you add to a collective dataset of potential threats that can help you and the contribute to the security community.
- Track detections
- This option enables you to assign a detection to a user, add notes, and update the status from acknowledged to closed. Then, you can filter the Detections page to clear resolved issues from view or to check on detections.
Share a detection
You can send the URL from a detection detail page to other ExtraHop system users.
Next steps
- Create a detection notification rule to receive email notifications about a detection.
Acknowledge detections
Acknowledgments provide a visual way to identify that a detection has been seen. You can acknowledge a detection to let team members know that you are investigating a ticket or that the issue has been triaged and should be prioritized for follow-up. You can also filter your view of detections to show only unacknowledged detections.
Before you begin
Users must have limited-write or higher privileges to acknowledge a detection or clear an acknowledgment.- An acknowledgment does not hide the detection.
- After a detection is acknowledged, a timestamp and the username of the person who acknowledged the detection is displayed.
- An acknowledgment can be cleared by any user, even if they are not the user that originally acknowledged the detection.
To acknowledge a detection, complete the following steps:
Create an investigation
Create an investigation to view multiple detections in a single timeline and map.
Before you begin
- Users must be granted NDR module access and have limited-write privileges or higher to complete the tasks in this guide.
- Log in to the ExtraHop system through https://<extrahop-hostname-or-IP-address>.
- At the top of the page, click Detections.
- Click Actions from the lower-left corner of the detection card.
- Click Add to an Investigation....
- Select Add detection to a new investigation.
- Click Next.
- Type a name and add notes to the new investigation.
- Click Create.
- To add a detection to the investigation, click Actions, and then click Add to an Investigation....
- To delete a detection from an investigation, click the delete icon (X) on the detection in the investigation timeline.
Create a detection notification rule
Create a notification rule if you want to receive a notification about detections that match specific criteria.
| Video: | See the related training: Configure Detection Notifications |
When a detection that matches your criteria is generated, a notification is sent with information from the detection card.
You can configure the system to send an email to a recipient list or call a specific webhook.
Before you begin
- Users must be granted NDR or NPM module access and have full write privileges or higher to complete the tasks in this guide.
- Reveal(x) 360 requires a connection to ExtraHop Cloud Services to send notifications through email and webhooks. Reveal(x) Enterprise requires a connection to ExtraHop Cloud Services to send notifications through email, but can send a notification through a webhook without a connection.
- Email notifications are sent through ExtraHop Cloud Services and might contain identifiable information such as IP addresses, usernames, hostnames, domain names, device names, or file names. Reveal(x) Enterprise users who have regulatory requirements that prohibit external connections can configure notifications with webhook calls to send notifications without an external connection.
- Reveal(x) 360 cannot send webhook calls to endpoints on your internal network. Webhook targets must be open to external traffic.
- Webhook targets must have a certificate signed by a certificate authority (CA) from the Mozilla CA Certificate Program. See https://wiki.mozilla.org/CA/Included_Certificates for certificates from trusted public CAs.
- Reveal(x) Enterprise must connect directly to webhook endpoints to send notifications.
- Email notifications are sent from no-reply@notify.extrahop.com. Make sure to add this address to your list of allowed senders.
-
Click the System Settings icon and then click Notification
Rules.
Webhook Notification Reference
This guide provides reference information to help you write the JSON payload for webhook-based notifications. The guide contains an overview of the Payload (JSON) interface, a list of detection variables that are available for webhooks, and examples of JSON structure for common webhook targets, such as Slack, Microsoft Teams, and Google Chat.
For more information about notification rules, see Create a detection notification rule.
Payload JSON
ExtraHop webhooks are formatted in JSON, powered by the Jinja2 templating engine. When you create a notification rule and select the webhook option, the webhook editor opens to the right, and you can edit the payload.
You can modify the default payload with custom properties or copy a JSON template for Slack, Microsoft Teams, or Google Chat, from the Examples section.
By default, the payload contains a sample text property. The sample JSON in the figure below sends a notification with the text "ExtraHop Detection" followed by the detection title that replaces the variable.
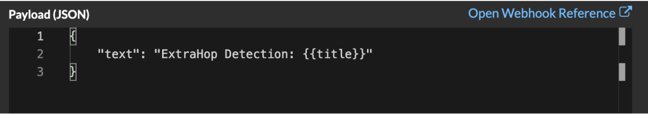
We recommend that you test your connection to the webhook URL before modifying the payload. That way you can be sure any issues are not due to a connection error.
Variables
Detection variables are added to the payload by inserting the variable name between double sets of curly braces ({{ and }}).
For example, the sample in the payload includes a variable for the detection title:
"text": "ExtraHop Detection: {{title}}"
When a detection matches a notification rule with the variable, the variable is replaced by the detection title. For example, if the notification rule matches the detection for Network Share Enumeration, the variable is replaced with the title in the notification, similar to the following figure:
See a list of detection variables.
Filters
Filters enable you to modify a variable.
If the variable returns a value that is formatted in JSON, the value is automatically escaped and translated into a string. If you want to pass valid JSON to your webhook target, you must specify the safe filter:
{{<variable> | safe }}
In the following example, the variable returns JSON-formatted detection data about participants directly to the webhook target:
{{api.participants | safe }}
IF statements
An IF statement can check whether a value is available for the variable. If the variable is empty, you can specify an alternative variable.
{% if {{<variable>}} %}
In the following example, the IF statement checks if a value is available for the victim variable:
{% if victims %}
In the following example, the IF statement checks if an offender name is available. If there is no value for the offender name, the value for the offender IP address variable is returned instead.
{% if offender.name %}{{offender.name}}{%else%}{{offender.ipaddr}}
{% endif %}
FOR loops
A FOR loop can enable the notification to display an array of objects.
{% for <array-object-variable> in <array-variable> %}
In the following example, a list of offender names from the offenders array are displayed in the notification. An IF statement checks for more items in the array ({% if not loop.last %}) and adds a line break before printing the next value (\n). If an offender name is empty, the default filter returns "Unknown Name" for the value.
{% for offender in offenders %}
  {{offender.name | default ("Unknown Name")}}
  {% if not loop.last %}\n
  {% endif %}
{% endfor %}
Available detection variables
The following variables are available for webhook notifications about detections.
- title: String
- The title of the detection.
- detection: String
- A description of the detection.
- type: String
- The type of detection.
- id: Number
- The unique identifier for the detection.
- url: String
- The URL for the detection in the ExtraHop system.
- risk_score: Number
- The risk score of the detection.
- site: String
- The site where the detection occurred.
- start_time_text: String
- The time that the detection started.
- end_time_text: String
- The time that the detection ended.
- categories_array: Array of Strings
- An array of categories that the detection belongs to.
- categories_string: String
- A string that lists the categories that the detection belongs to.
- mitre_tactics: Array of Strings
- An array of MITRE tactic IDs associated with the detection.
- mitre_tactics_string: String
- A string that lists the MITRE tactic IDs associated with the detection.
- mitre_techniques: Array of Strings
- An array of MITRE technique IDs associated with the detection.
- mitre_techniques_string: String
- A string that lists the MITRE technique IDs associated with the detection.
- offender_primary: Object
- An object that identifies the primary offender and contains the following properties:
- external: Boolean
- The value is true if the primary offender IP address is external to your network.
- ipaddr: String
- The IP address of the primary offender.
- name: String
- The name of the primary offender.
- offenders: Array of Objects
- An array of offender objects associated with the detection. Each object
contains the following properties:
- external: Boolean
- The value is true if the offender IP address is external to your network.
- ipaddr: String
- The IP address of the offender. Applies to detections with multiple offenders.
- name: String
- The name of the offender. Applies to detections with multiple offenders.
- victim_primary: Object
- An object that identifies the primary victim and contains the following properties:
- external: Boolean
- The value is true if the primary victim IP address is external to your network.
- ipaddr: String
- The IP address of the primary victim.
- name: String
- The name of the primary victim.
- victims: Array of Objects
- An array of victim objects associated with the detection. Each object
contains the following properties:
- external: Boolean
- The value is true if the victim IP address is external to your network.
- ipaddr: String
- The IP address of the victim. Applies to detections with multiple victims.
- name: String
- The name of the victim. Applies to detections with multiple victims.
- api: Object
- An object that contains all fields returned by the GET /detections/{id}operation. For more information, see the Introduction to the ExtraHop REST API.
Webhook Examples
The following sections provide JSON templates for common webhook targets.
Slack
After you create a Slack app and enable incoming webhooks for the app, you can create an incoming webhook. When you create an incoming webhook, Slack will generate the URL for you to enter in the Payload URL field in your notification rule.
The following example shows the JSON payload for a Slack webhook:
{
    "blocks": [
        {
            "type": "header",
            "text": {
                "type": "plain_text",
                "text": "Detection: {{ title }}"
             }
        },
        {
            "type": "section",
            "text": {
                "type": "mrkdwn",
                "text": "• *Risk Score:* {{ risk_score }}\n • *Category:* {{ categories_string }}\n • *Site:* {{ site }}\n • *Primary Offender:* {{ offender_primary.name}} ({{ offender_primary.ipaddr}})\n • *Primary Victim:* {{ victim_primary.name }} ({{ victim_primary.ipaddr }})\n"
            }
        },
        {
            "type": "section",
            "text": {
                "type": "plain_text",
                "text": "Detection ID: {{ id }}"
            },
            "text": {
                "type": "mrkdwn",
                "text": "<{{ url }}|View Detection Details>"
            }
        }
    ]
}
Microsoft Teams
You can add an incoming webhook to a Teams channel as a connector. After you configure an incoming webhook, Teams will generate the URL for you to enter in the Payload URL field in your notification rule.
The following example shows the JSON payload for a Microsoft teams webhook:
{
   "type":"message",
   "attachments":[
      {
         "contentType":"application/vnd.microsoft.card.adaptive",
         "contentUrl":null,
         "content":{
            "$schema":"https://adaptivecards.io/schemas/adaptive-card.json",
            "type":"AdaptiveCard",
            "body":[
               {
                  "type":"ColumnSet",
                  "columns":[
                     {
                        "type": "Column",
                        "width":"16px",
                        "items":[
                           {
                              "type":"Image",
                              "horizontalAlignment":"center",
                              "url":"https://assets.extrahop.com/favicon.ico",
                              "altText":"ExtraHop Logo"
                           }
                        ]
                     },
                     {
                        "type": "Column",
                        "width":"stretch",
                        "items":[
                           {
                              "type":"TextBlock",
                              "text":"ExtraHop Reveal(x)",
                              "weight": "bolder"
                           }
                        ]
                     }
                  ]
               },
               {
                  "type":"TextBlock",
                  "text":"**{{ title }}**"
               },
               {
                  "type":"TextBlock",
                  "spacing":"small",
                  "isSubtle":true,
                  "wrap":true,
                  "text":"{{ description }}"
               },
               {
                  "type":"FactSet",
                  "facts":[
                     {
                        "title":"Risk Score:",
                        "value":"{{ risk_score }}"
                     },
                     {
                        "title":"Category:",
                        "value":"{{ categories_string }}"
                     },
                     {
                        "title":"Site:",
                        "value":"{{ site }}"
                     },
                     {
                        "title":"Primary Offender:",
                        "value":"{{ offender_primary.name }} ({{ offender_primary.ipaddr }})"
                     },
                     {
                        "title":"Primary Victim:",
                        "value":"{{ victim_primary.name }} ({{ victim_primary.ipaddr }})"
                     }
                  ]
               },
               {
                  "type":"ActionSet",
                  "actions":[
                     {
                        "type":"Action.OpenUrl",
                        "title":"View Detection Details",
                        "url":"{{ url }}"
                     }
                  ]
               }
            ]
         }
      }
   ]
}
Google Chat
From a Google chat room, you can click the dropdown next to the room name and select Manage webhooks. After you add a webhook and name it, Google Chat will generate the URL for you to enter in the Payload URL field in your notification rule.
The following example shows the JSON payload for a Google Chat webhook:
{
    "cards": [
        {
            "header": {
                "title": "{{title}}"
            },
            "sections": [
                {
                    "widgets": [
                        {
                            "keyValue": {
                                "topLabel": "Risk score",
                                "content": "{{risk_score}}"
                            }
                        },
                        {
                            "keyValue": {
                                "topLabel": "Categories",
                                "content": "{{categories_string}}"
                            }
                        }
                        {% if offenders %}
                       ,{
                            "keyValue": {
                                "topLabel": "Offenders",
                                "contentMultiline": "true",
                                "content": "{% for offender in offenders %}{% if offender.name %}{{offender.name}}{% else %}{{offender.ipaddr}}{% endif %}{% if not loop.last %}\n{% endif %}{% endfor %}"
                            }
                        }
                        {% endif %}
                        {% if victims %}
                       ,{
                            "keyValue": {
                                "topLabel": "Victims",
                                "contentMultiline": "true",
                                "content": "{% for victim in victims %}{% if victim.name %}{{victim.name}}{% else %}{{victim.ipaddr}}{% endif %}{% if not loop.last %}\n{% endif %}{% endfor %}"
                            }
                        }
                        {% endif %}
                    ]
                },
                {
                    "widgets": [
                        {
                            "buttons": [
                                {
                                    "textButton": {
                                        "text": "VIEW DETECTION DETAILS",
                                        "onClick": {
                                            "openLink": {
                                                "url": "{{url}}"
                                            }
                                        }
                                    }
                                }
                            ]
                        }
                    ]
                }
            ]
        }
    ]
}
Create a detection catalog notification rule
Create a notification rule if you want to receive a notification when new detections become active on your ExtraHop system.
Before you begin
- Users must be granted NDR or NPM module access and have full-write privileges or higher to complete the tasks in this guide.
- The ExtraHop system must be connected to ExtraHop Cloud Services to send notifications through email.
- Email notifications are sent from no-reply@notify.extrahop.com. Make sure to add this address to your list of allowed senders.
- Log in to the ExtraHop system through https://<extrahop-hostname-or-IP-address>.
-
Click the System Settings icon and then click Notification
Rules.
- Click Create.
- Type a unique name for the notification rule in the Name field.
- In the Description field, add information about the notification rule.
-
In the Event Type section, select one of the following options:
- For NDR detection catalog updates, select Security Detection Catalog (requires NDR module access).
- For NPM detection catalog updates, select Performance Detection Catalog (requires NPM module access).
- Specify individual email addresses, separated by a comma.
- In the Options section, click the Enable notification rule checkbox to enable the notification.
- Click Save.
Track a detection
Detection tracking enables you to assign users, set a status, and add notes to a detection card.
| Video: | See the related training: Detection Tracking |
Before you begin
Users must have limited write privileges or higher to complete the tasks in this guide.- Open
- The detection has not been reviewed.
- Acknowledge
- The detection has been seen and should be prioritized for follow-up.
- In Progress
- The detection has been assigned to a team member and is being reviewed.
- Closed - Action Taken
- The detection was reviewed and action was taken to address the potential risk.
- Closed - No Action Taken
- The detection was reviewed and required no action.
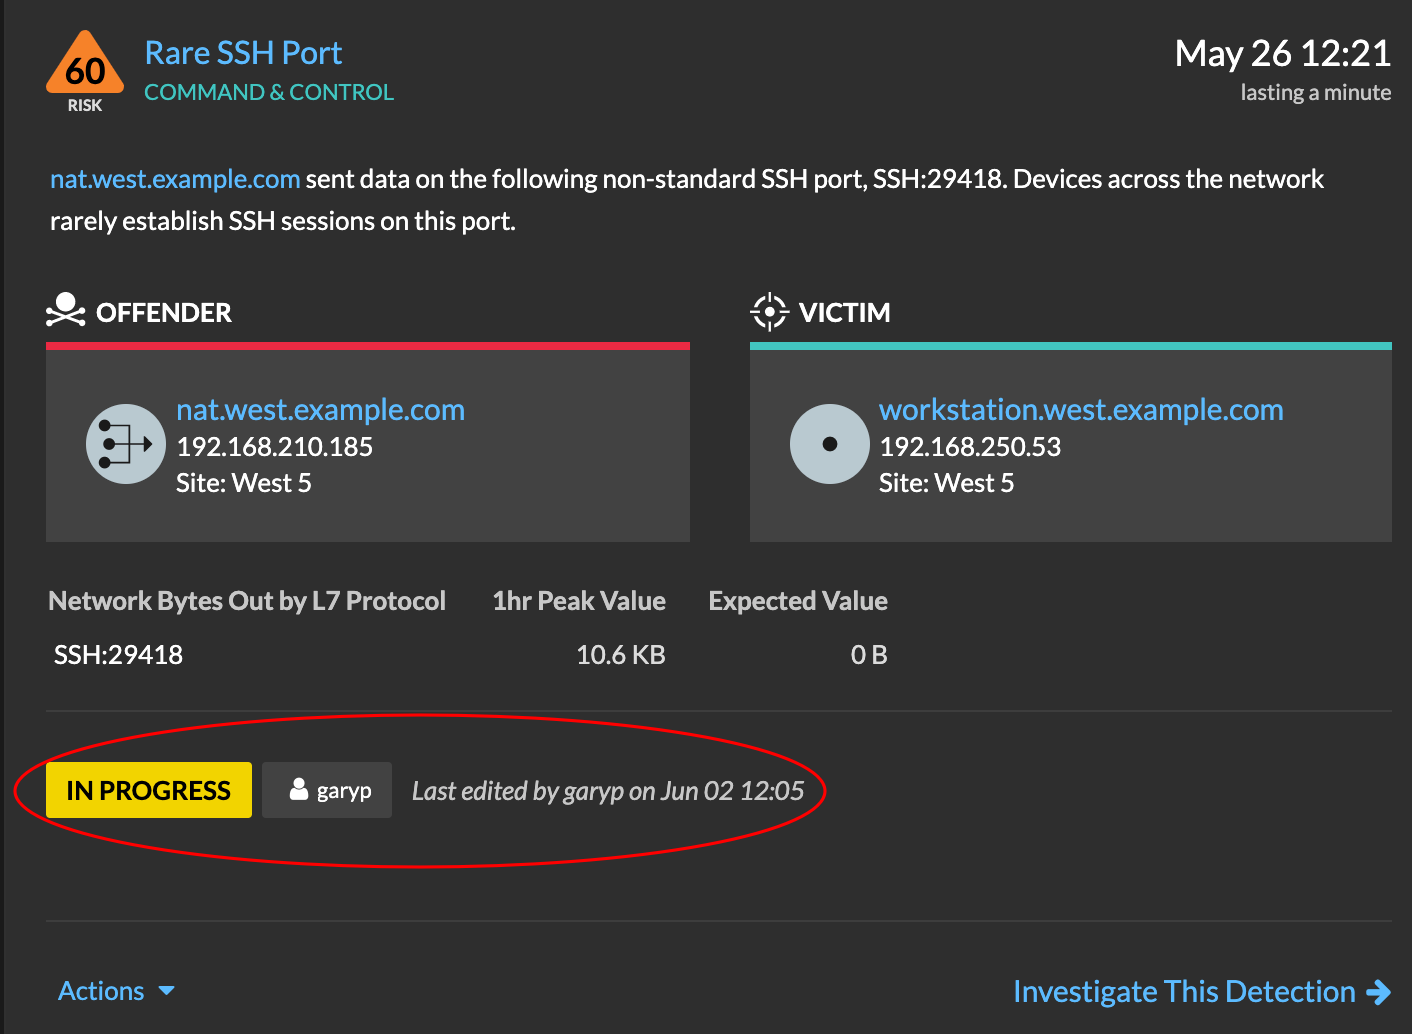
Here are important considerations about tracking detections:
- The Acknowledged or Closed status does not hide the detection.
- The detection status can be updated by any privileged user.
- Optionally, you can configure detection tracking with a third-party system.
- If you are currently tracking detections with a third-party system, you will not see ExtraHop detection tracking until you change the setting in the Administration settings.
To track a detection, complete the following steps:
- (Optional):
Click a detection status to add it to the detection.
Option Description Acknowledge The detection has been seen and should be prioritized for follow-up. In Progress The detection has been assigned to a team member and is being reviewed. Closed - Action Taken The detection was reviewed and action was taken to address the potential risk. Closed - No Action Taken The detection was reviewed and required no action.
-
Click Track Detection… to set the detection status,
assign the detection to a user, and add notes to the detection card.
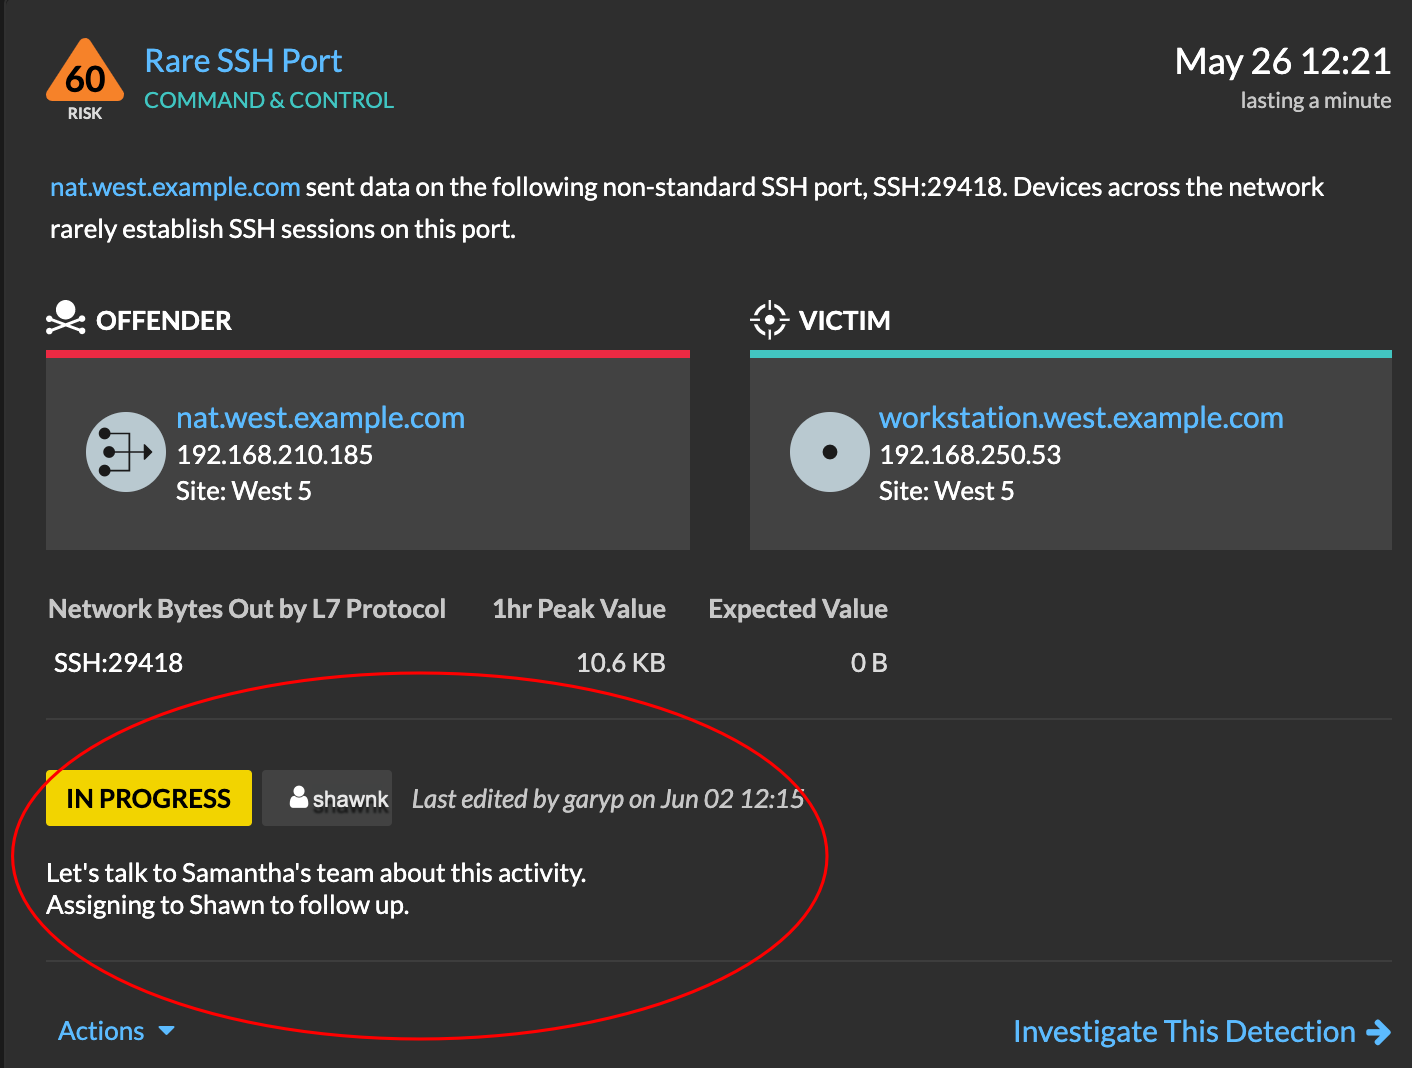
From the Actions dropdown, select Track Detection... and then Open to remove the status from the detection; the assignee and notes remain visible.
Track a detection from a detection card
You can track a detection by adding an assignee, status, and notes from a detection card.
To track a detection, complete the following steps:
Track a group of detections from a detection summary
You can apply a status, assignee, or note to multiple detections at the same time from a summary panel on the Detections page.
To track a group of detections from a detection summary, complete the following steps:
Contain CrowdStrike devices from a detection
You can initiate containment of CrowdStrike devices that are participants in a security detection. Containment prevents devices from establishing connections to other devices on your network.
After you initiate containment from a detection, a request is made to CrowdStrike Falcon to contain the devices and a Containment Pending status appears next to the participant. The status is updated to Contained only after the ExtraHop system receives a response from CrowdStrike.
Before you begin
- Device containment must be enabled for the CrowdStrike integration.
- Users must be granted NDR module access and have limited-write privileges or higher to complete the tasks in this guide.
-
Click a detection title to view the detection detail page.
The number of CrowdStrike devices that are participants in the detection appear in the Integrations section under Track Detection.
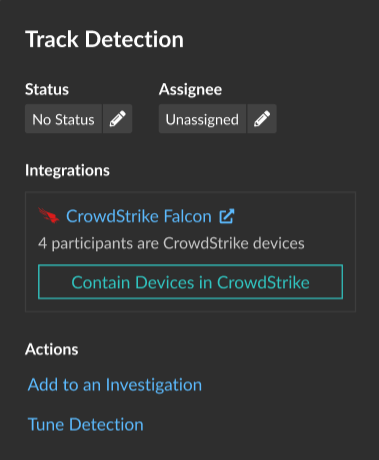
-
Click Contain Devices in CrowdStrike.
The dialog box displays the CrowdStrike devices associated with the detection.
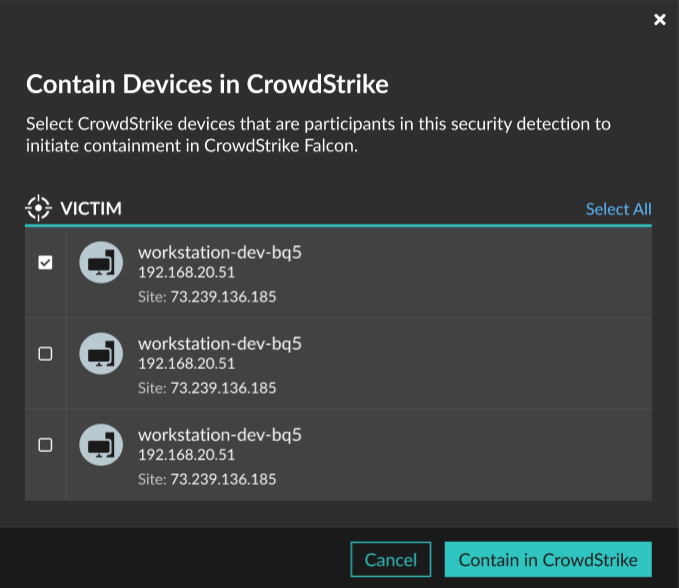
Next steps
- Verify device containment by checking the status from the detection details. The
containment status also appears in the device properties.
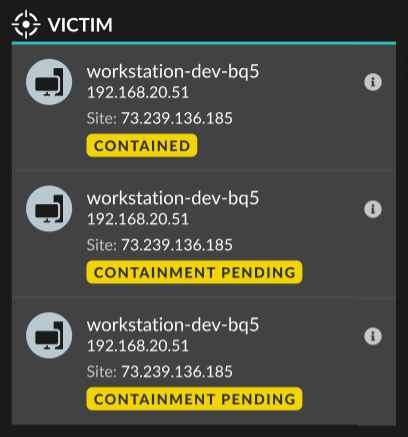
- Retry containing a device. The Containment Pending status no longer appears when a containment request to CrowdStrike is denied or expires.
- Release a device from containment from the CrowdStrike Falcon console. From the Integrations section under Track Detection, click CrowdStrike Falcon to open the console in a new tab. The containment status no longer appears after the ExtraHop system receives a response from CrowdStrike.
Create a custom detection
Custom detections enable you to specify criteria that generates detections on the ExtraHop system. Machine-learning and rules-based detections capture unusual behaviors and common threats, however by creating a custom detection, you can hone in on the devices and behaviors that are critical for your network.
When creating a custom detection, you must create a trigger that identifies the system event and conditions that the system should watch for, and then you can assign the trigger to the specific devices or device groups you want to monitor. When the event occurs, a detection is generated.
In this guide, we provide the steps and an example script that generates a custom detection when suspicious connections are made to specified websites through Windows PowerShell.
Before you begin
- You must have some familiarity with ExtraHop Triggers. In particular, consider these best practices when writing your script and assigning triggers.
- You must have a user account with the privileges required to create triggers.
- If you have a console, create a trigger on the console and the trigger will run on all connected sensors.
Create a trigger to generate custom detections
Triggers generate custom detections by calling the commitDetection function in the trigger script.
In the following example, the trigger generates a custom detection when a PowerShell client reaches out to a website that is known as a staging site for exfiltrated data.
The trigger identifies PowerShell connections by looking for SSL client JA3 hashes that belong to known PowerShell clients.
If the SSL connection occurs from a PowerShell client to a suspicious host, the trigger generates a detection. The detection includes the version of PowerShell that initiated the connection, the server IP address, and the client IP address.
| Note: | For more information about the commitDetection function, see the Trigger API Reference. |
-
Click the System Settings icon and then click
Triggers.
-
Next, type the code that commits your custom detection. The
commitDetection function must be written in the following
format:
commitDetection('<detection type ID>', { title: '<title>', description: '<detection description>', categories: ['<category>'], riskScore: <risk score>, participants: [{ object:<offender participant>, role: 'offender' }, { object: <victim participant>, role: 'victim' }], identityKey: '<identity key>', identityTtl: '<time period>', });Enter values for each of the following parameters in your script.
Value Description detection type ID A unique string that identifies your custom detection. This string can only contain letters, numbers, and underscores. title Text that appears at the top of the detection card. Type a descriptive title that is easy to scan. This title appears in the Detection Catalog as the display name for your detection type, preceded by [custom].
detection description Text that appears below the title and category on a detection card. Type information about the event that generates the detection. This field supports markdown. We recommend that you include interpolation variables to display specific information about your detection.
For example, the variables $(Flow.client.ipaddr) and $(Flow.server.ipaddr) display the IP address of the client and server device in the flow and $(Flow.l7proto) displays the L7 protocol. Include \n at the end of each line of text to make sure the description displays correctly.risk score A number that measures the likelihood, complexity, and business impact of a security detection. The risk score icon appears at the top of the detection card and is color coded by severity as red (80-99), orange (31-79), or yellow (1-30). You can sort detections by risk. offender participant victim participant
An array of objects that identifies the participants in the detection. Define the role of the participant as either 'offender' or 'victim' and provide a reference to a device, IP address, or application object for that role.
For example, the following array identifies the server as the offender and the client as the victim in a flow:
participants: [ { role: 'offender', object: Flow.server.device}, { role: 'victim', object: Flow.client.device } ]For more information about device, IP address, and application objects, see the Trigger API Reference.
identity key A string that enables the identification of ongoing detections. If multiple detections with the same identity key and detection type are generated within the time period specified by the identityTtl parameter, the detections are consolidated into a single ongoing detection. Create a unique identity key string by combining characteristics of the detection.
For example, the following identity key is created by combining the server IP address and the client IP address:identityKey: [Flow.server.ipaddr, Flow.client.ipaddr].join('!!')time period The amount of time after a detection is generated that duplicate detections are consolidated into an ongoing detection. The time period is reset, and the detection does not end until the time period expires. The following time periods are valid:
- hour
- day
- week
The default time period is hour.
The following example shows the completed script section.
commitDetection('powershell_ja3', { title: 'PowerShell / BitsAdmin Suspicious Connection', description: "This SSL client matched a variant of PowerShell." + "\n"+ "Investigate other client behaviors on the victim host." + "\n"+ "- ** PowerShell/BitsAdmin JA3 client match**" + "\n"+ "- **Client IP:** " + Flow.client.ipaddr + "\n"+ "- **JA3 Client Value:** " + ja3 + "\n"+ "- **JA3 Client Match:** " + suspect_ja3_hashes[ja3], riskScore: 60, participants: [{ object:Flow.client.device, role: 'offender' }], identityKey: [ Flow.server.ipaddr, Flow.client.ipaddr, hash ].join('!!'), identityTtl: 'hour', });These values appear in the detection card similar to the following figure:
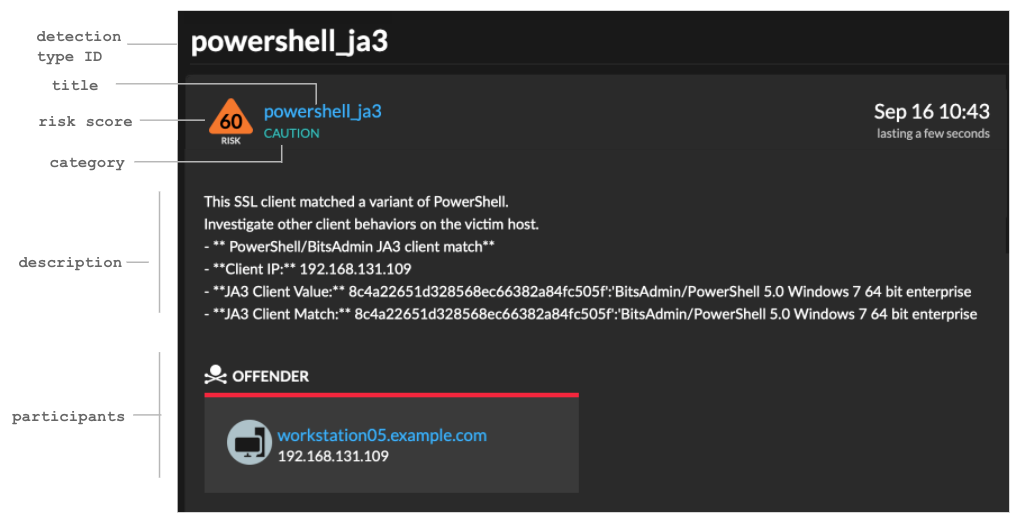
Create a custom detection type
After you create a trigger to generate your custom detection, you can create a custom detection type in the Detection Catalog to add more information to your detection.
-
Click the System Settings icon and then click Detection
Catalog.
View custom detections
You can view custom detections on the Detections page with other built-in detections.
Group the detections page by Type. All detections in the detection list are grouped by detection type.
For example, if your detection display name is [custom]Segmentation Breach, the entry would appear in the detection list similar to the following figure:

From the top left of the page, select MITRE Map. The MITRE techniques that were linked to the custom detection are highlighted in the matrix.
Next steps
Create a detection notification rule. For example, you can configure the ExtraHop system to email you when your custom detection occurs.
Example Custom Detection Trigger
The following script is the complete PowerShell/JA3 example referred to throughout these instructions.
// If the server is internal, exit
if ( ! Flow.server.ipaddr.isExternal ) {
    return;
}
// If the SSL host name is not set, exit
if(SSL.host === null) { return; }

// Continue only if the SSL hostname belongs to one of the suspicious sites
if(SSL.host.match(/pastebin/i) || SSL.host.match(/raw.githubusercontent.com/i) || SSL.host.match(/githack/i)) {

    // List of common PowerShell JA3 hashes
    let suspect_ja3_hashes = cache('suspect_ja3_hashes', () => ({
        '13cc575f247730d3eeb8ff01e76b245f':'PowerShell/BitsAdmin/PowerShell 4.0 Windows Server 2012RT',
        '5e12c14bda47ac941fc4e8e80d0e536f':'PowerShell/BitsAdmin/PowerShell 4.0 Windows Server 2012RT',
        '2c14bfb3f8a2067fbc88d8345e9f97f3':'PowerShell/BitsAdmin Windows Server 2012RT',
        '613e01474d42ebe48ef52dff6a20f079':'PowerShell/BitsAdmin Windows Server 2012RT',
        '05af1f5ca1b87cc9cc9b25185115607d':'BitsAdmin/PowerShell 5.0 Windows 7 64 bit enterprise',
        '8c4a22651d328568ec66382a84fc505f':'BitsAdmin/PowerShell 5.0 Windows 7 64 bit enterprise',
        '235a856727c14dba889ddee0a38dd2f2':'BitsAdmin/PowerShell 5.1 Server 2016',
        '17b69de9188f4c205a00fe5ae9c1151f':'BitsAdmin/PowerShell 5.1 Server 2016',
        'd0ec4b50a944b182fc10ff51f883ccf7':'PowerShell/BitsAdmin (Microsoft BITS/7.8) Server 2016',
        '294b2f1dc22c6e6c3231d2fe311d504b':'PowerShell/BitsAdmin (Microsoft BITS/7.8) Server 2016',
        '54328bd36c14bd82ddaa0c04b25ed9ad':'BitsAdmin/PowerShell 5.1 Windows 10',
        'fc54e0d16d9764783542f0146a98b300':'BitsAdmin/PowerShell 5.1 Windows 10',
        '2863b3a96f1b530bc4f5e52f66c79285':'BitsAdmin/PowerShell 6.0 Windows Server 2012RT',
        '40177d2da2d0f3a9014e7c83bdeee15a':'BitsAdmin/PowerShell 6.0 Windows Server 2012RT',
        '36f7277af969a6947a61ae0b815907a1':'PowerShell/BitsAdmin Windows 7 32 bit enterprise',
    }));
    // Store the client JA3 hash in a variable
    const hash = SSL.ja3Hash;

    // Iterate through each PowerShell JA3 hash
    for ( let ja3 in suspect_ja3_hashes ) {

        // If the client JA3 hash is from PowerShell,
        // commit the detection
        if ( hash.includes(ja3) ) {

            commitDetection('PowerShell_JA3', {
                categories: ['sec.caution'],
                title: "PowerShell / BitsAdmin Suspicious Connection",
                // Specify the offender as the device object of the client
                participants: [
                    { role: 'offender', object: Flow.client.device }
                ],
                description:
                    "This SSL client matched a variant of PowerShell." + "\n"+
                    "Investigate other client behaviors on the victim host." + "\n"+
                    "- ** PowerShell/BitsAdmin JA3 client match**" + "\n"+
                    "- **Client IP:** " + Flow.client.ipaddr + "\n"+
                    "- **Server IP:** " + Flow.server.ipaddr + "\n"+
                    "- **JA3 Client Value:** " + ja3 + "\n"+
                    "- **JA3 Client Match:** " + suspect_ja3_hashes[ja3],
                // Create the identity key by combining the server IP address, client IP address, and PowerShell JA3 hash
                identityKey: [
                    Flow.server.ipaddr,
                    Flow.client.ipaddr,
                    hash
                ].join('!!'),
                riskScore: 60,
                identityTtl: 'hour'
            });
        }
    }
}
Upload custom IDS rules
You can upload a custom set of IDS rules to ExtraHop IDS sensors. The ExtraHop system converts the rules to detection types that generate detections that you can view and investigate.
Add rules that are formatted according to Suricata guidelines to one or more .rules files and upload them in a .zip file. Upon upload, the ExtraHop system processes each rule, which is displayed in a table that displays the signature ID, the name of each rule, and one of the following rule statuses.
Accepted: The ExtraHop system successfully processed the rule.
Rejected: The ExtraHop system could not process the rule. The rule might contain a formatting error or the rule might contain an action, protocol, or option that is not currently supported by the ExtraHop system. Contact ExtraHop Support to inquire about future support for the rule.
Upgrade required: A newer version of the ExtraHop firmware is required to support the rule. The required system version is displayed.
Here are some considerations about custom IDS rules:
- Custom IDS rules must be formatted as a valid Suricata .rules file.
- One or more Suricata .rules files must be added to a single .zip file for upload.
- You cannot upload more than 10,000 custom IDS rules.
- Deleting a file deletes all rules associated with the uploaded file and can take several minutes. Users might continue to see detections based on these rules until deletion is complete.
- Replacing a file deletes all rules associated with the previously uploaded file and then processes the rules from the new file.
- Built-in IDS rules are not deleted or replaced when you manage your custom IDS rules. Your ExtraHop system is connected to ExtraHop Cloud Services and the latest built-in rules are automatically downloaded to the system when updated versions become available.
| Note: | ExtraHop might review uploaded rules to check conversion accuracy and to guide product improvement for Suricata rule conversion, correctness, and performance. |
-
Click the System Settings icon and then click Custom IDS
Rules.
Next steps
Click Detections from the top navigation menu page to view detections generated from custom IDS rules. Theses detections indicate that the rule was provided by a custom IDS file and includes the signature ID of the rule.Tune detections
Detection tuning enables you to reduce noise and surfaces critical detections that require immediate attention.
There are two ways to tune detections: you can add tuning parameters that suppress detections from ever being generated, or you can create tuning rules that hide existing detections based on detection type, participants, or detection properties.
| Video: | See the related training: Configure Tuning Rules |
Tuning Parameters
Tuning parameters enable you to specify known and trusted domains, DNS servers, and HTTP CONNECT targets that should not generate a detection. You can also enable tuning parameters that suppress frequent and redundant detections associated with gateway devices and tor nodes.
Tuning parameters are managed from the Tuning Parameters page and trusted domains are managed from the Network Localities page.
Tuning Rules
Tuning rules enable you to specify criteria that hide detections that have been generated, but are of low-value and do not require attention.
| Note: | Tuning rules might not hide certain detections if your packet sensors are not running the same firmware version as your console. |
- Hidden detections do not cause related triggers and alerts to run while the rule is enabled.
- Hidden detections do not appear as detection markers in charts.
- Hidden detections do not appear on activity maps, but hidden participants will appear in investigation maps.
- Hidden detections do not appear in detection counts on related pages, such as the Device Overview page or the Activity page.
- Hidden detections and participants do not appear in the Executive Report.
- Hidden detections are not included in email and webhook notifications.
| Note: | If you do not see detection markers for any detections, confirm that detection markers have not been disabled. |
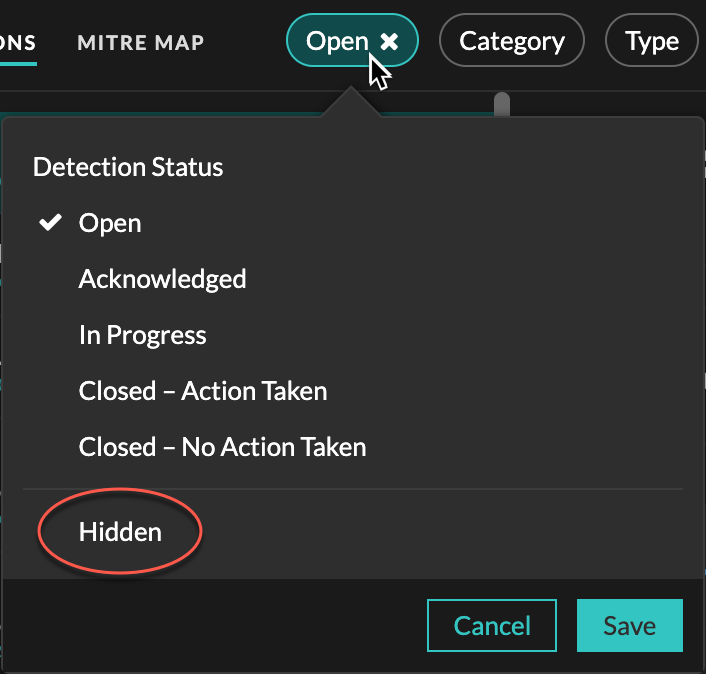
Tuning best practices
It is better to create a single parameter or rule that is more broad instead of creating multiple overlapping parameters and rules.
- Start by adding tuning parameters to avoid detections that involve known or trusted agents. Be sure to review the Tuning Parameters and Network Localities pages for existing parameters to avoid redundancy.
- Determine if you want to hide all detections for a specific participant, such as a vulnerability scanner, and select All detection types. If you want to hide by device role, increase the scope to device group.
-
When an IP Address or CIDR Block is selected in the Offender or Victim dropdown, add or remove entries from the list in the IP Addresses field to increase or reduce the scope of the tuning rule.
-
By default, tuning rules expire after 8 hours. You can select a different expiration time from the dropdown or select a new expiration time after you re-enable an expired rule from the Tuning Rules page.
- The ExtraHop system automatically deletes detections that have been on the system for 21 days since the start time of the detection, that are not ongoing, and that are hidden. If a newly created or edited tuning rule hides a detection that matches this criteria, the affected detection will not be deleted for 48 hours.
-
When adding a tuning rule, if you identify a device that is not classified correctly, you can change the device role.
-
Certain detections might require a precise tuning rule based on a specific property of the detection. Under the Property heading, click the checkbox next to a property to specify a value or regular expression and add criteria for a focused tuning rule.
- Apply the Hidden status filter to the Detections page to view detections that are currently hidden by tuning rules.
Learn how to suppress detections with tuning parameters and hide detections with tuning rules.
Suppress detections with tuning parameters
Provide information about your network environment so that the ExtraHop system can suppress low-value or redundant detections from ever being generated.
You can add tuning parameters from the Tuning Parameters or Network Localities pages, or you can add them directly from a detection card. In addition, you can classify IP address ranges as internal or external to your network.
| Video: | See the related training: Configure Tuning Parameters |
Specify tuning parameters for detections and metrics
Specify tuning parameters to improve metrics and suppress low-value detections from ever being generated.
| Note: | The fields on this page might be added, deleted, or modified over time by ExtraHop. |
- Log in to the ExtraHop system through https://<extrahop-hostname-or-IP-address>.
-
Click the System Settings icon and then click Tuning
Parameters.
-
Specify values for any of the following parameters available on the page.
Option Description Gateway Devices By default, gateway devices are ignored by rules-based detections because they can result in redundant or frequent detections. Select this option to identify potential issues with gateway devices such as your firewalls, routers, and NAT gateways.
Outbound Tor Nodes By default, outbound connections to known Tor nodes are ignored by rules-based detections because they can result in low-value detections in environments with minimal Tor traffic. Select this option to identify detections on outbound connections to known Tor nodes if your environment observes substantial outgoing Tor traffic.
Inbound Tor Nodes By default, inbound connections from known Tor nodes are ignored by rules-based detections because they can result in low-value detections in environments with minimal Tor traffic. Select this option to identify detections on inbound connections from known Tor nodes if your environment observes substantial incoming Tor traffic.
Accelerated Beaconing Detection By default, the ExtraHop system detects potential beaconing events over HTTP and SSL. Select this option to detect beaconing events faster than the default detection.
Note that enabling this option can increase the detection of beaconing events that are not malicious.
IDS Detections By default, ExtraHop systems with connected Intrusion Detection System (IDS) sensors only generate detections for traffic inside your network. Select this option to generate IDS detections for traffic that is inbound from an external endpoint. Note that enabling this option can significantly increase the number of IDS detections.
Privileged Active Directory Accounts Specify regular expressions (regex) that match privileged Active Directory accounts in your environment. The parameter list includes a default list of regular expressions for common privileged accounts that you can edit. The ExtraHop system identifies privileged accounts and tracks account activity in Kerberos records and metrics.
Allowed Public DNS Servers Specify public DNS servers allowed in your environment that you want rules-based detections to ignore. Specify a valid IP address or CIDR block.
Allowed HTTP CONNECT Targets Specify URIs that your environment can access through the HTTP CONNECT method. URIs must be formatted as <hostname>:<port number>. Wildcards and Regex are not supported.
If you do not specify a value, detections that rely on this parameter are not generated.
- Click Save.
Add a tuning parameter or trusted domain from a detection card
If you encounter a low-value detection, you can add tuning parameters and trusted domains directly from a detection card to keep similar detections from generating.
Before you begin
Users must have full write or higher privileges to tune a detection.-
Click Tune Detection....
If the detection type is associated with a tuning parameter, you will see the option to suppress the detection by adding a tuning parameter or trusted domain. If the detection does not have an associated tuning parameter, you can hide the detection with a tuning rule.
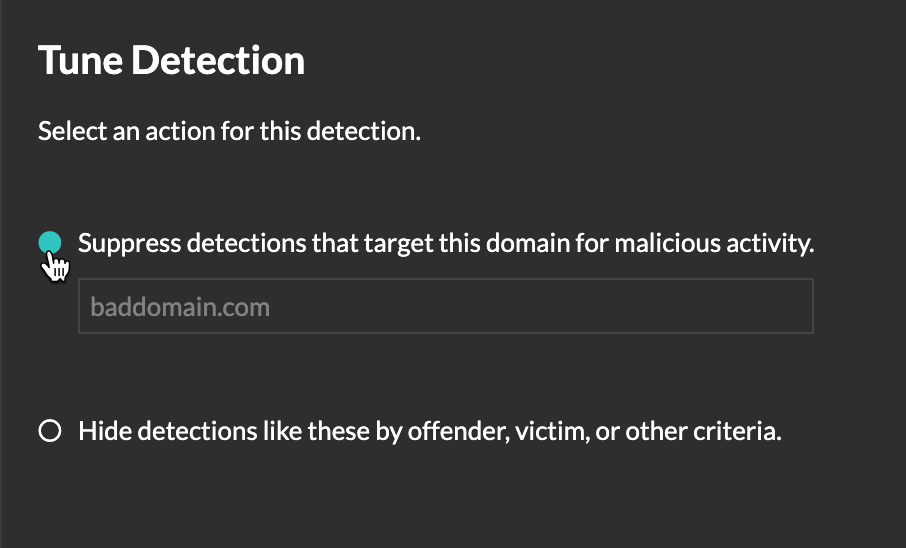
Add a trusted domain
Certain detections are generated when a device makes a connection to an external domain. If you know that a domain is legitimate, add it to the Trusted Domains list, and future detections that target malicious domain activity are suppressed for that domain.
For detections that have an associated domain, you can also add a trusted domain directly from a detection card.
| Note: | If your ExtraHop system includes a console, and that system is configured to manage tuning parameters, these trusted domains will apply to all connected sensors. |
-
Click the System Settings icon and then click Network
Localities.
Hide detections with tuning rules
Tuning rules enable you to hide detections that match specified criteria.
To avoid creating redundant rules, make sure to first add information about your network environment to the ExtraHop system by specifying tuning parameters.
Learn more about tuning detections.
Create a tuning rule
Create tuning rules to streamline your detection list by specifying criteria that hide past, present, and future detections that are of low-value and do not require attention.
Before you begin
Users must have full write or higher privileges to create a tuning rule.Learn about tuning best practices.
Add a tuning rule from a detection card
If you encounter a low-value detection, you can create a tuning rule directly from a detection card to hide similar detections in the ExtraHop system.
Before you begin
Users must have full write or higher privileges to tune a detection.Learn about tuning best practices.
Add a tuning rule from a hardening detection
Click a hardening detection to view a summary of all assets, detection properties, and network localities associated with that detection type. You can filter the summary by clicking any of the associated values, and then create a tuning rule to hide detections based on the displayed results.
Before you begin
Users must have full write or higher privileges to tune a detection.Learn more about filtering and tuning hardening detections.
Learn about tuning best practices.
-
Click any Hardening detection in the detection list.
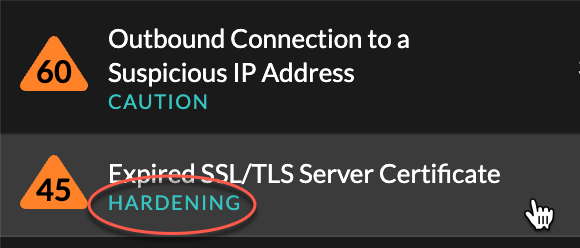
Add a tuning rule from the Tuning Rules page
Create tuning rules to hide detections by detection type, participant, or specific detection properties.
Before you begin
Users must have full write or higher privileges to tune a detection.Learn about tuning best practices.
-
Click the System Settings icon and then click Tuning
Rules.
Tuning rule criteria
Select from the following criteria to determine which detections are hidden by a tuning rule.
- Detection type
- You can create a tuning rule that applies to a single detection type, or choose to have the rule apply to all security or performance detection types, depending on the system module. Rules that encompass all security detection types are typically reserved for activity associated with vulnerability scanners.
- Participants
- Identify participants in a tuning rule by IP address, hostname or domain,
device name, or network
locality. You can also hide participants based on roles
identified by the ExtraHop system. For example, when the ExtraHop system
identifies an external scanning service, you can hide detections for that
specific service, or you can create a tuning rule that hides all external
scanning services.
For detections with multiple offenders you can include a list of IP addresses or CIDR blocks, or reference a device group. You can also create tuning rules that hide a single participant without hiding an entire detection.
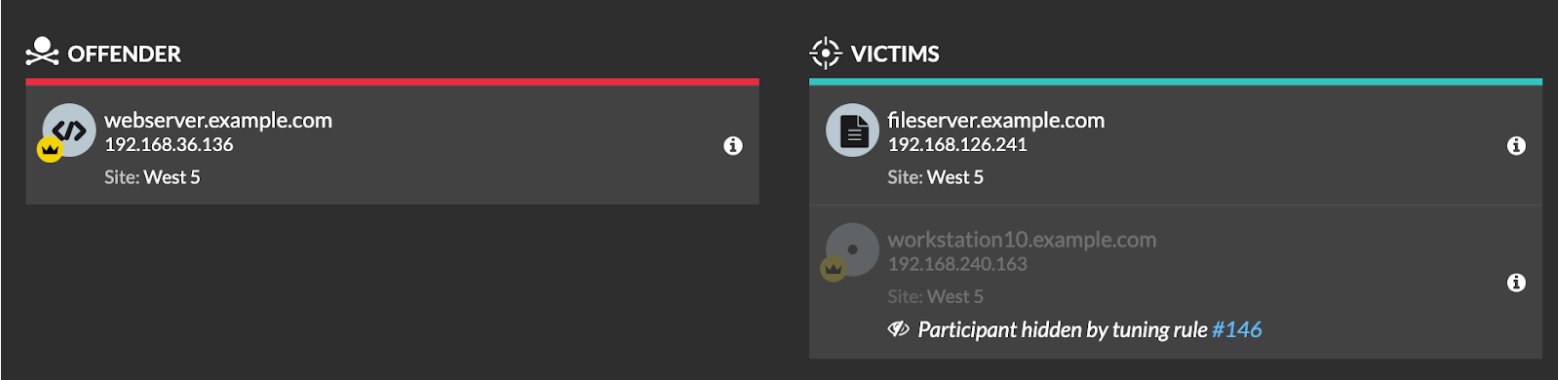
You can opt to hide all offenders or all victims. For example, you can hide the offender in a noisy scan detection regardless of the victim participants.
- Detection properties
- Create a tuning rule that hides detections by a specific property. For
example, you can hide Rare SSH Port detections for a single port number, or
Data Exfiltration to S3 Bucket detections for a specific S3 bucket.
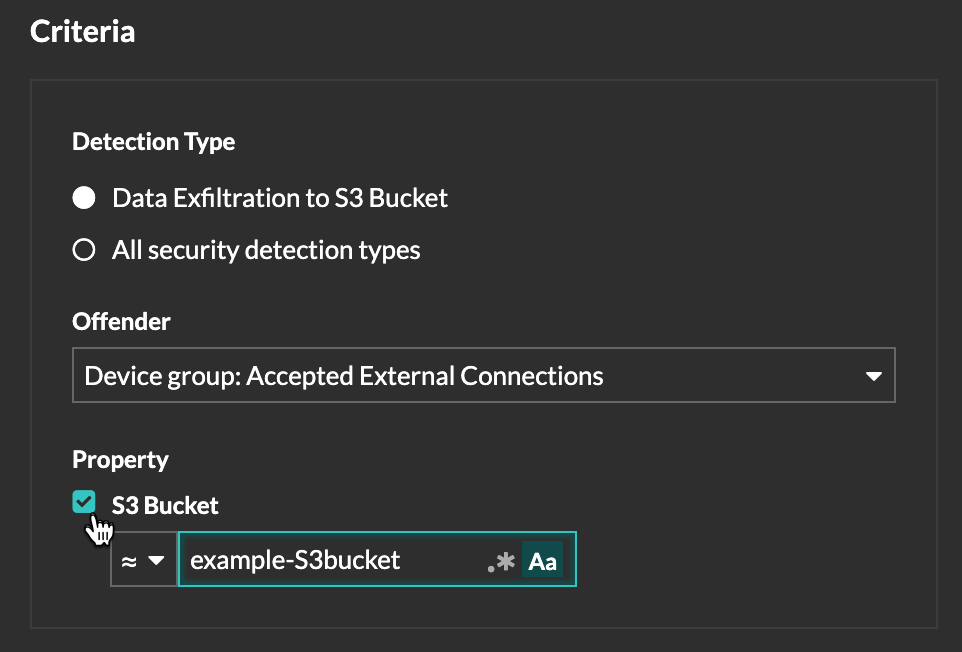
Manage Tuning Rules
You can edit the criteria or extend the duration of a rule, re-enable a rule, and disable or delete a rule.
At the top of the page, click the Systems Settings icon ![]() and select
Tuning Rules.
and select
Tuning Rules.
Click on a tuning rule in the Tuning Rules table to open the Edit Tuning Rule panel. Update participants, rule criteria, or properties to adjust the scope of the rule. Click the buttons at the bottom of the panel to delete, disable, enable, or extend the duration of a rule.
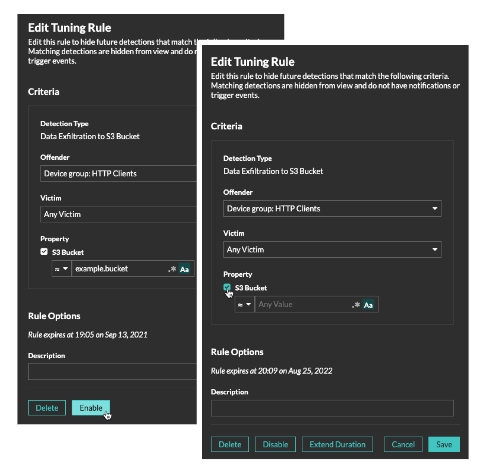
- After you disable or delete a rule, the rule expires immediately and associated triggers and alerts resume.
- After you disable a rule, previously hidden detections remain hidden; ongoing detections appear.
- Deleting a rule displays previously hidden detections.
- The ExtraHop system automatically deletes detections that have been on the system for 21 days since the start time of the detection, that are not ongoing, and that are hidden. If a newly created or edited tuning rule hides a detection that matches this criteria, the affected detection will not be deleted for 48 hours.
You can apply the Hidden status to the Detections page to only view detections that are currently hidden by a tuning rule.
Each hidden detection or participant includes a link to the associated tuning rule, and displays the username of the user that created the rule. If the detection or participant is hidden by multiple rules, the number of rules that apply appears.
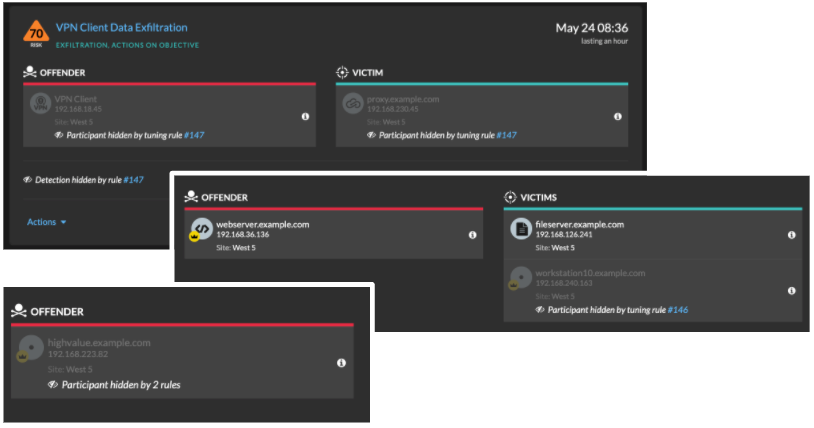
Filter and Tune Hardening Detections
Detections in the Hardening category help mitigate the risk of exploitation. You can triage a large number of hardening detections by filtering and tuning the Detections page.
Before you begin
Users must be granted privileges to view detections and must have full write or higher privileges to create a tuning rule.Learn more about tuning detections.
Learn about tuning best practices.
Click a hardening detection from the Detections page to view the summary. Hardening detection summaries identify the detection type, the assets that are participants in detections of that type, the detection properties, and the network localities that contain affected assets.
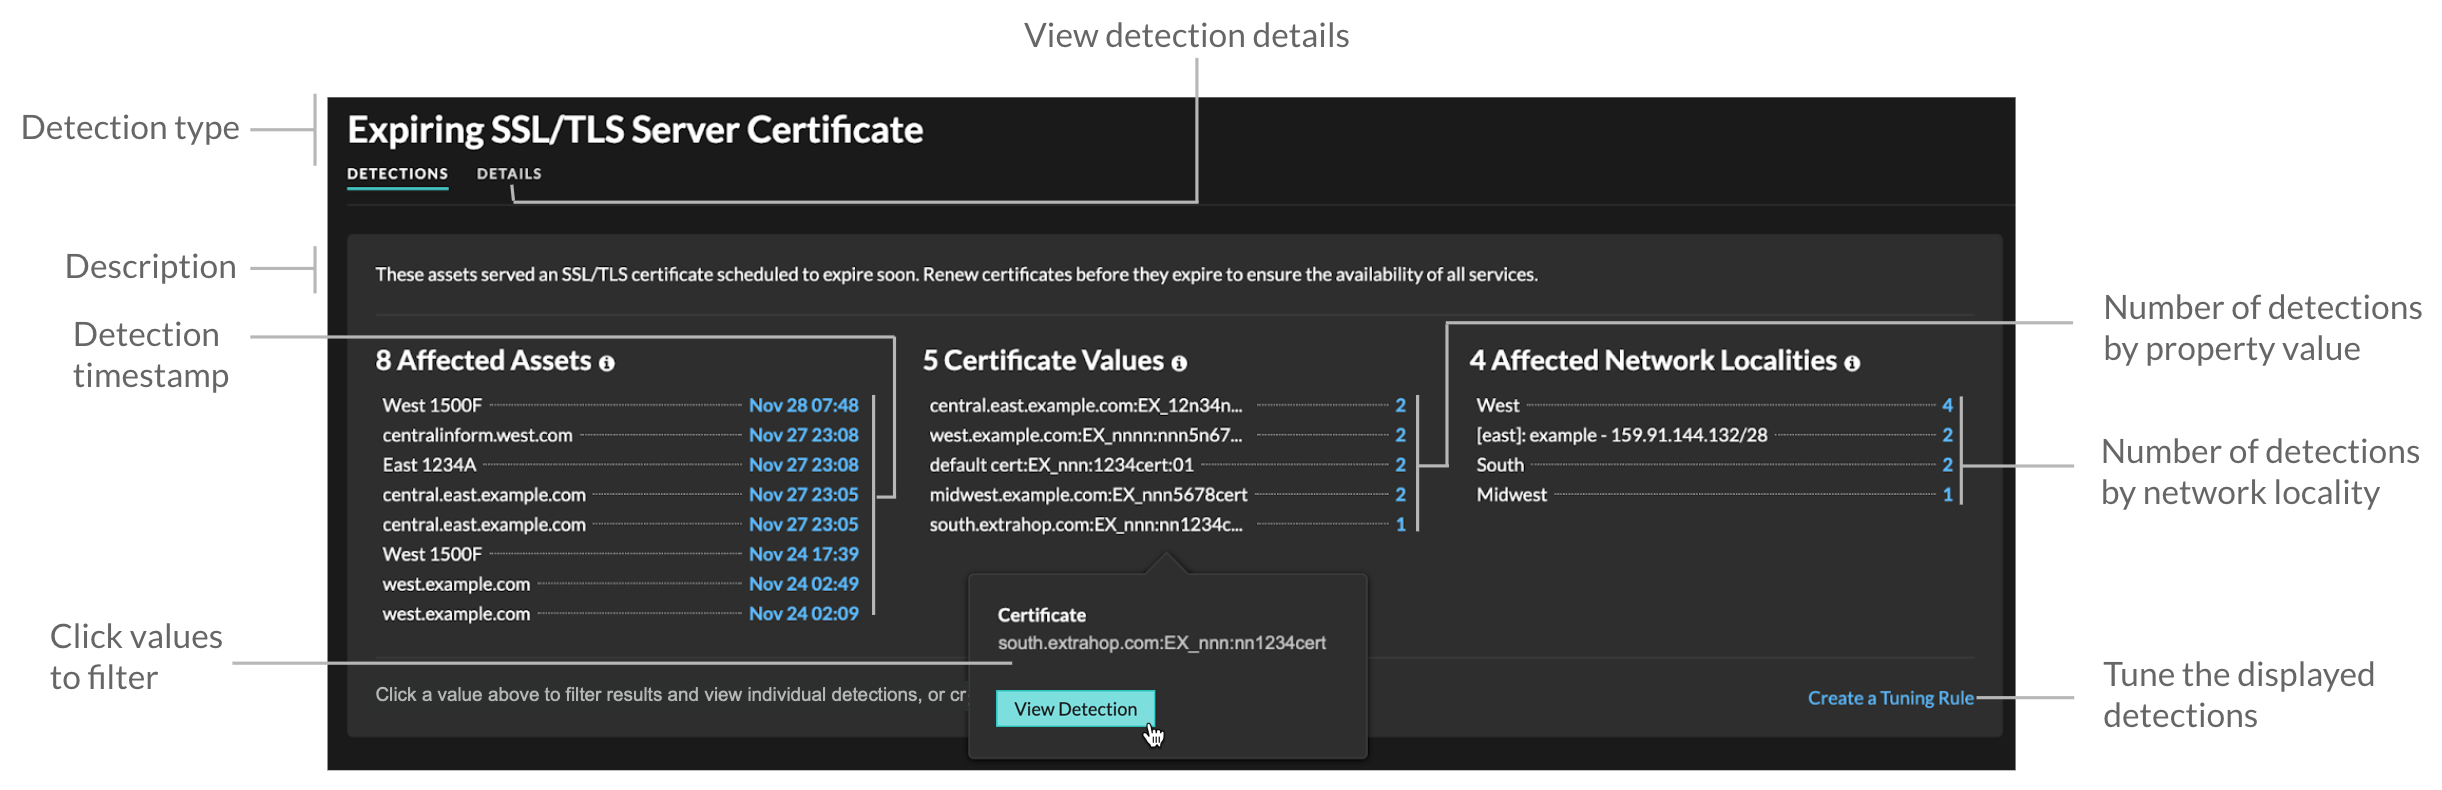
- Affected Assets
- A list of assets that are participants in hardening detections of the selected type. The Affected Assets list is ordered by the most recent time that the detection occurred.
- Property Values
- A list of the key property values associated with the detection type. For example, the Weak Cipher Suite detection type lists the cipher suites referenced in detections, and the Expiring SSL/TLS Server Certificate detection lists certificates that are scheduled to expire. The Property Values list is ordered by the number of detections that contain the property value.
- Affected Network Localities
- A list of network localities that contain hardening detections of the selected type. The Affected Network Localities list is ordered by the number of detections in the network locality.
By filtering results on a single asset, property, or locality, you can identify detections that affect critical systems or create a tuning rule that hides low-value detections similar to the filtered results.
Configure ticket tracking for detections
Ticket tracking enables you to connect tickets, alarms, or cases in your work-tracking system to ExtraHop detections. Any third-party ticketing system that can accept Open Data Stream (ODS) requests, such as Jira or Salesforce, can be linked to ExtraHop detections.
Before you begin
- You must have access to an ExtraHop system with a user account that has System and Access Administration privileges.
- You must be familiar with writing ExtraHop Triggers. See Triggers and the procedures in Build a trigger.
- You must create an ODS target for your ticket tracking server. See the following topics about configuring ODS targets: HTTP, Kafka, MongoDB, syslog, or raw data.
- You must be familiar with writing REST API scripts and have a valid API key to complete the procedures below. See Generate an API key.
Enable ticket tracking and specify a URL template
You must enable ticket tracking before REST API scripts can update ticket information on the ExtraHop system. Optionally, specify a URL template that adds an HTML link in the detection card to the ticket in your ticketing system.
- (Optional):
In the URL field, specify the URL template for your ticketing system and add
the $ticket_id variable at the appropriate location. For
example, type a complete URL such as
https://jira.example.com/browse/$ticket_id. The
$ticket_id variable is replaced with the ticket ID
associated with the detection.
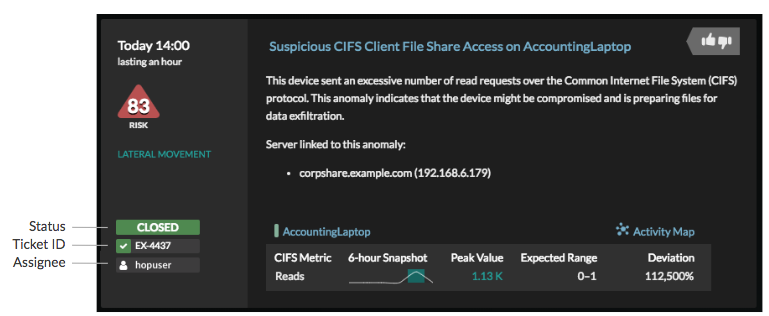
Write a trigger to create and update tickets about detections on your ticketing system
This example shows you how to create a trigger that performs the following actions:
- Create a new ticket in the ticketing system every time a new detection appears on the ExtraHop system.
- Assign new tickets to a user named escalations_team in the ticketing system.
- Run every time a detection is updated on the ExtraHop system.
- Send detection updates over an HTTP Open Data Stream (ODS) to the ticketing system.
The complete example script is available at the end of this topic.
-
Click the System Settings icon and then click
Triggers.
const summary = "ExtraHop Detection: " + Detection.id + ": " + Detection.title;
const description = "ExtraHop has detected the following event on your network: " + Detection.description
const payload = {
    "fields": {
        "summary": summary,
        "assignee": {
            "name": "escalations_team"
        },
        "reporter": {
            "name": "ExtraHop"
        },
        "priority": {
            "id": Detection.riskScore
        },
        "labels": Detection.categories,
        "mitreCategories": Detection.mitreCategories,
        "description": description
    }
};
const req = {
    'path': '/rest/api/issue',
    'headers': {
        'Content-Type': 'application/json'
    },
    'payload': JSON.stringify(payload)
};
Remote.HTTP('ticket-server').post(req);Send ticket information to detections through the REST API
After you have configured a trigger to create tickets for detections in your ticket tracking system, you can update ticket information on your ExtraHop system through the REST API.
Ticket information appears in detections on the Detections page in the ExtraHop system. For more information, see the Detections topic.
The following example Python script takes ticket information from a Python array and updates the associated detections on the ExtraHop system.
#!/usr/bin/python3

import json
import requests
import csv

API_KEY = '123456789abcdefghijklmnop'
HOST = 'https://extrahop.example.com/'

# Method that updates detections on an ExtraHop system
def updateDetection(detection):
    url = HOST + 'api/v1/detections/' + detection['detection_id']
    del detection['detection_id']
    data = json.dumps(detection)
    headers = {'Content-Type': 'application/json',
               'Accept': 'application/json',
               'Authorization': 'ExtraHop apikey=%s' % API_KEY}
    r = requests.patch(url, data=data, headers=headers)
    print(r.status_code)
    print(r.text)

# Array of detection information
detections = [
                 {
                     "detection_id": "1",
                     "ticket_id": "TK-16982",
                     "status": "new",
                     "assignee": "sally",
                     "resolution": None,
                 },
                 {
                     "detection_id": "2",
                     "ticket_id": "TK-2078",
                     "status": None,
                     "assignee": "jim",
                     "resolution": None,
                 },
                 {
                     "detection_id": "3",
                     "ticket_id": "TK-3452",
                     "status": None,
                     "assignee": "alex",
                     "resolution": None,
                 }
             ]

for detection in detections:
    updateDetection(detection)
| Note: | If the script returns an error message that the SSL
certificate verification failed, make sure that a trusted certificate has
been added to your sensor or console. Alternatively, you can add the
verify=False option to bypass certificate verification. However, this
method is not secure and not recommended. The following code sends an HTTP GET request
without certificate
verification:requests.get(url, headers=headers, verify=False) |
- Status
- The status of the ticket associated with the detection. Ticket tracking
supports the following statuses:
- New
- In Progress
- Closed
- Closed with Action Taken
- Closed with No Action Taken
- Ticket ID
- The ID of the ticket in your work-tracking system that is associated with the detection. If you have configured a template URL, you can click the ticket ID to open the ticket in your work-tracking system.
- Assignee
- The username assigned to the ticket associated with the detection. Usernames in gray indicate a non-ExtraHop account.
Investigate security detections
When an interesting detection appears, you should investigate whether the detected behavior points to a low-priority issue or a potential security risk. You can start your investigation directly from the detection card, which provides links to data across the ExtraHop system.
- Did any detections occur at unusual or unexpected times, such as user-activity on weekends or after hours?
- Are any detections appearing in large clusters on the timeline?
- Are there detections appearing for high-value endpoints?
- Are there detections that have high risk scores?
- Are devices in the detection also participants in other detections?
- Are indicators of compromise identified from a threat collection associated with the detection?
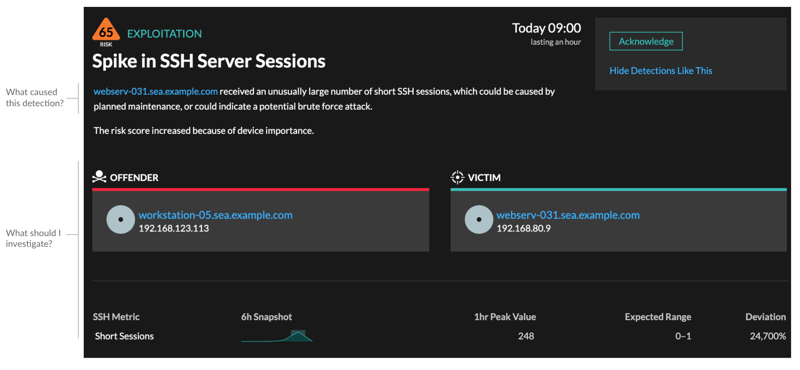
Refine your investigation
Detection detail cards present related data about the detection. The availability of the data depends on the devices and metrics associated with the detection. After you click a link, you can return to the detection card by clicking the detection name in the navigation path. Each investigation option is described in the sections below.
Review investigative data
Most of the data that you need to understand, validate, and investigate a detection is displayed on the detection detail page: tables of relevant metric data, record transactions, and links to raw packets.
Click a host name to navigate to the Device Overview page, or right-click to create a chart with that device as the source and the relevant metrics.
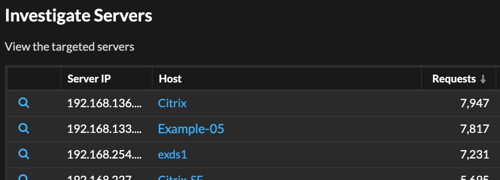
Device name
Click a device name to navigate to the Device Overview page, which contains the role, users, and tags associated with that device. From the left pane, click a protocol name to view all of the protocol metrics associated with the device. The protocol page gives you a complete picture of what this device was doing at the time of the detection.
For example, if you get a reconnaissance scan detection, you can learn if the device associated with the scan is assigned the Vulnerability Scanner role.
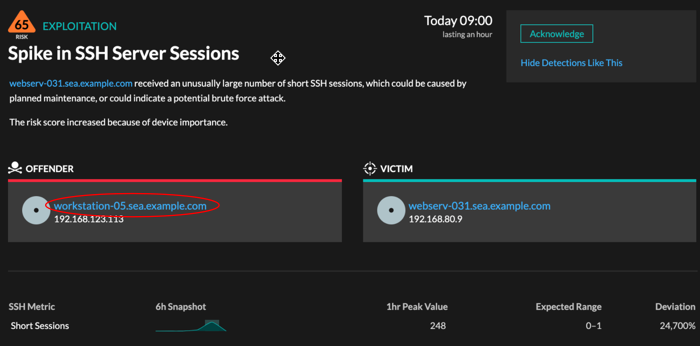
- Availability
- Device name links are only available for devices that have been automatically discovered by the ExtraHop system. Remote devices that are located outside of your network are represented by their IP addresses.
Activity map
Click the Activity Map icon ![]() next to a device name to see device connections by protocol during the time of the
detection. For example, if you get a lateral movement detection, you can learn if the
suspicious device established connections over a remote control protocol with other clients,
IT servers, or domain controllers on your network.
next to a device name to see device connections by protocol during the time of the
detection. For example, if you get a lateral movement detection, you can learn if the
suspicious device established connections over a remote control protocol with other clients,
IT servers, or domain controllers on your network.
- Availability
- An activity map is available when a single client or server is associated with unusual L7 protocol activity, such as a high number of HTTP errors or DNS request timeouts.
Detail metric drill down
Click a detail metric link to drill down on a metric value. A detail metric page appears, which lists metric values by a key, such as client IP address, server IP address, method, or error. For example, if you get a reconnaissance scan detection, drill down to learn which client IP addresses were associated with the unusually high number of 404 status codes during the detection.
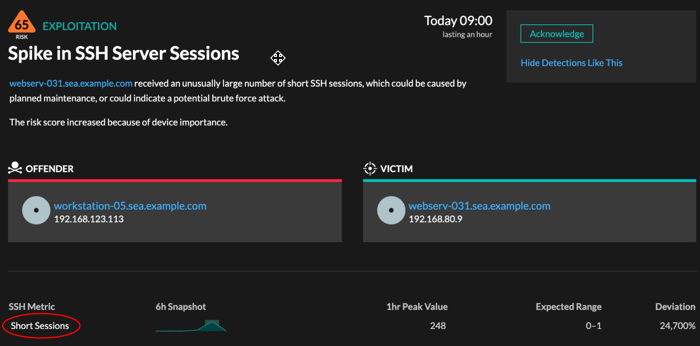
- Availability
- The drill-down option is available for detections associated with topnset detail metrics.
Sparkline
Click the sparkline to create a chart that includes the source, time interval, and drill-down details from the detection, which you can then add to a dashboard for monitoring. For example, if you get a detection about an unusual number of remote sessions, create a chart with SSH sessions for that server and then add that chart to a dashboard about session management.
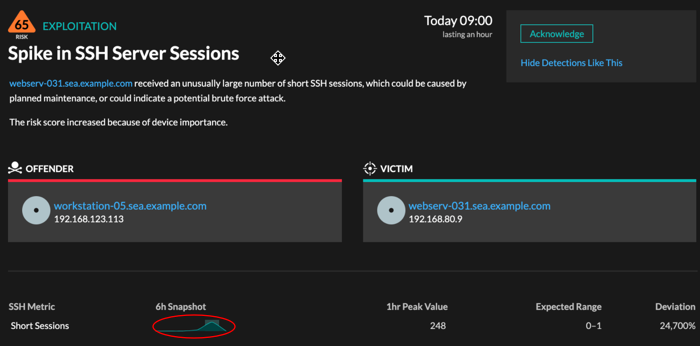
- Availability
- The sparkline option is available for detections that were associated with metrics and had a duration over one-hour. For 1-second metrics, a sparkline is available when the duration was over 30-seconds.
Related detections
Click a related detections to find insight about suspicious behavior and emerging attacks across multiple detections with shared participants. For example, a victim in the current detection that participates as an offender in a later detection might indicate that the device is compromised. You can view related detection details to determine if the detection events are similar and to see which other devices are involved.
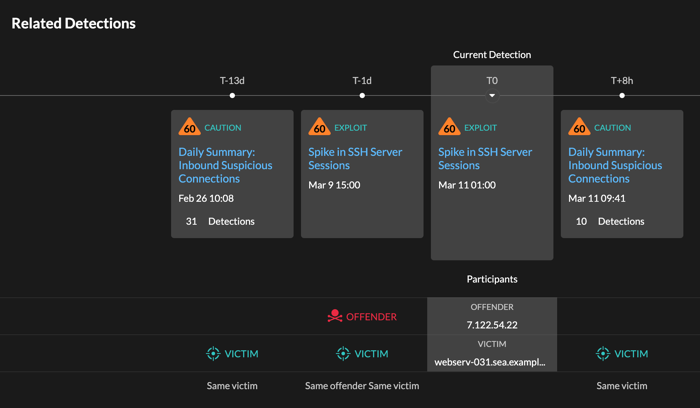
- Availability
- The related detections timeline is available if there are detections that share the same victim or offender participants with the current detection. Related detections might have occurred before or after the current detection.
Threat Intelligence
Click a red camera icon to
access detailed threat intelligence about an indicator of compromise.
Threat intelligence provides known data about suspicious IP addresses, hostnames, and URIs that can help identify risks to your organization. These data sets, called threat collections, are available by default in your Reveal(x) system and from free and commercial sources in the security community.
- Availability
- Threat intelligence must be enabled on your Reveal(x) system before you can see these indicators.
Investigate performance detections
When an interesting detection appears, you should investigate whether the detected behavior points to a low-priority issue or to a potential problem. You can start your investigation directly from the detection card, which provides links to data across the ExtraHop system.
- Did any detections occur at unusual or unexpected times, such as user-activity on weekends or after hours?
- Are any detections appearing in large clusters on the timeline?
- Are there detections appearing for high-value endpoints?
- Are devices in the detection also participants in other detections?
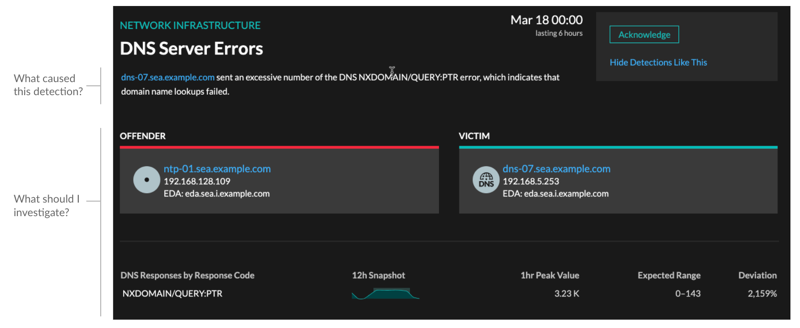
Refine your investigation
Detection detail cards present related data about the detection. The availability of the data depends on the devices and metrics associated with the detection. After you click a link, you can return to the detection card by clicking the detection name in the navigation path. Each investigation option is described in the sections below.
Review investigative data
Most of the data that you need to understand, validate, and investigate a detection is displayed on the detection detail page: tables of relevant metric data, record transactions, and links to raw packets.
Click a host name to navigate to the Device Overview page, or right-click to create a chart with that device as the source and the relevant metrics.
Device name
Click a device name to navigate to the Device Overview page, which contains the role, users, and tags associated with that device. From the left pane, click a protocol name to view all of the protocol metrics associated with the device. The protocol page gives you a complete picture of what this device was doing at the time of the detection.
For example, if you get a detection about database transaction failures, you can learn about other activity associated with the server hosting the database instance.
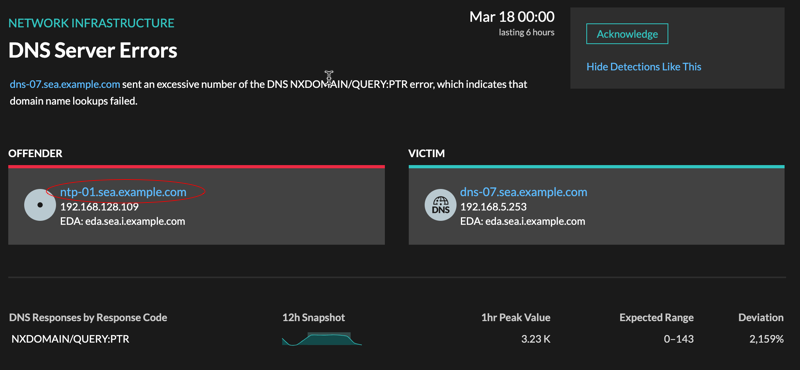
- Availability
- Device name links are only available for devices that have been automatically discovered by the ExtraHop system. Remote devices that are located outside of your network are represented by their IP addresses.
Activity map
Click the Activity Map icon ![]() next to a device name to see device connections by protocol during the time of the
detection. For example, if you get a detection about LDAP authentication errors, you can
create an activity map to learn which devices were connected to an LDAP server during the
detection.
next to a device name to see device connections by protocol during the time of the
detection. For example, if you get a detection about LDAP authentication errors, you can
create an activity map to learn which devices were connected to an LDAP server during the
detection.
- Availability
- An activity map is available when a single client or server is associated with unusual L7 protocol activity, such as a high number of HTTP errors or DNS request timeouts.
Detail metric drill down
Click a detail metric link to drill down on a metric value. A detail metric page appears, which lists metric values by a key, such as client IP address, server IP address, method, or error. For example, if you get an authentication detection about an LDAP server, drill down to learn which client IP addresses submitted the invalid credentials that contributed to the total number of LDAP errors.
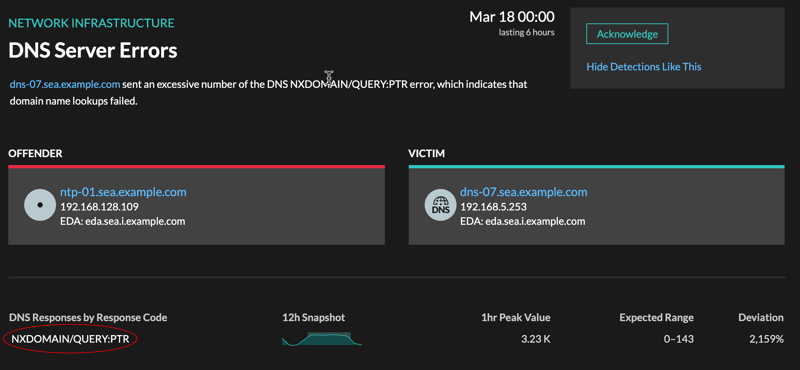
- Availability
- The drill-down option is available for detections associated with topnset detail metrics.
Sparkline
Click the sparkline to create a chart that includes the source, time interval, and drill-down details from the detection, which you can then add to a dashboard for additional monitoring. For example, if you get a detection about web server issues, you can create a chart with the 500 status codes sent by the web server and then add that chart to a dashboard about website performance.
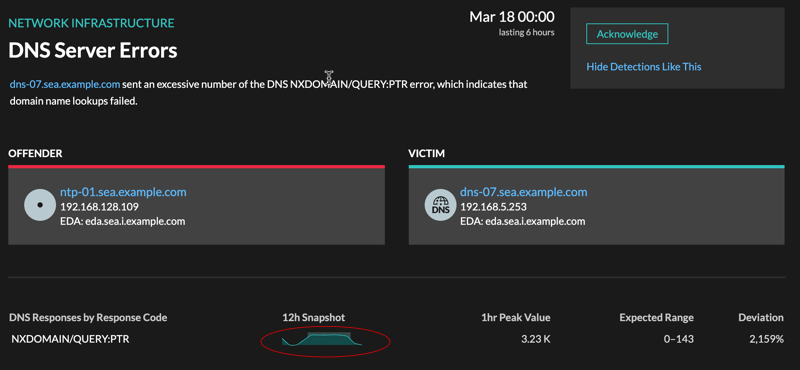
- Availability
- The sparkline option is available for detections that were associated with metrics.
Related detections
Click a related detection to find insight about network, application, and infrastructure problems across multiple detections with shared participants. For example, a device identified as an offender is the likely source of an issue, such as a database server sending an excessive number of response errors. A device identified as a victim is usually negatively affected by the issue, such as clients experiencing slow or failed database transactions. You can view related detection details to determine if the detection events are similar, see which other devices are involved, and to view metric data.
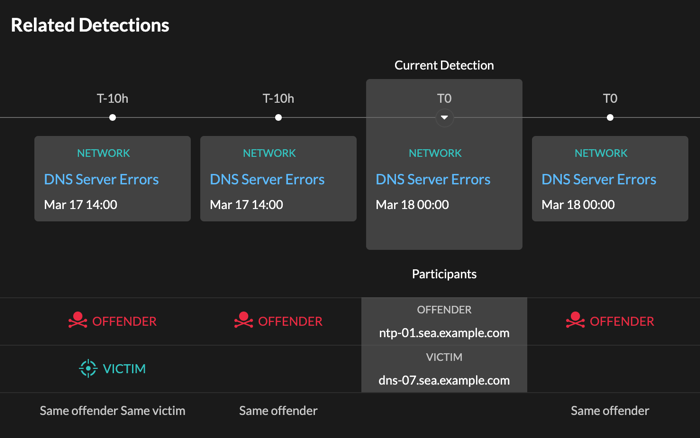
- Availability
- The related detections timeline is available if there are detections that share the same victim or offender participants with the current detection. Related detections might have occurred before or after the current detection.
Threat briefings
Threat briefings provide guidance about potential threats to your network.
- Industry-wide security events, where the ExtraHop system surfaces detections related to known compromises.
- Security Analysis Briefings, which provide machine-learning analysis that is specific to your network.
- (Reveal(x) 360 only.) Retrospective Threat Analysis Briefings, which detect new indicators of compromise in updated ExtraHop-curated threat intelligence collections.
Threat briefings contain detections of scans, exploits, and indicators of compromise (IOC) that are related to the threat. The information in each briefing varies depending on the type of threat. Information related to the briefing is cloud-updated as details emerge about IOC, potential attack vectors, and known risks.
Threat briefings are available from the top-left corner of the Security Overview page. Click any title to go to the detail page for that briefing. The detail page is updated as more information is discovered.
Here are some ways you can keep track of threat briefings:
- Create a threat briefing notification rule to receive emails when a new threat briefing appears.
- Click Create Investigation from the detail page to add the detections associated with the briefing to an investigation.
- Click Archive Briefing from the detail page when you no longer want to monitor the briefing; the briefing is automatically restored and a notification email is sent if the briefing is updated. You can view older briefings in the Archived section on the Threat Briefing page. Click Restore Briefing on the detail page to move the briefing back to the Active section of the Threat Briefing page.
Create a threat briefing notification rule
You can create a notification rule that emails a recipient list whenever a new threat briefing is published or automatically restored. Briefings are automatically restored if they are updated with content changes or new detections.
Before you begin
- Users must be granted NDR module access and have full-write privileges or higher to complete the tasks in this guide.
- The ExtraHop system must be connected to ExtraHop Cloud Services to send notifications through email.
- Email notifications are sent from no-reply@notify.extrahop.com. Make sure to add this address to your list of allowed senders.
- Log in to the ExtraHop system through https://<extrahop-hostname-or-IP-address>.
-
Click the System Settings icon and then click Notification
Rules.
- Click Create.
- Type a unique name for the notification rule in the Name field.
- In the Description field, add information about the notification rule.
- In the Event Type section, select Threat Briefing.
- Specify individual email addresses, separated by a comma.
- In the Options section, click the Enable notification rule checkbox to enable the notification.
- Click Save.
Threat intelligence
Threat intelligence provides known data about suspicious IP addresses, domains, hostnames, and URIs that can help identify risks to your organization.
| Video: | See the related training: Threat Intelligence |
Threat intelligence data sets, called threat collections, contain lists of suspicious endpoints known as indicators of compromise (IOCs). When the ExtraHop system observes activity that matches an entry in a threat collection, a detection is generated for the suspicious connection.
Participants that match a threat collection are tagged as Suspicious. (For
Crowdstrike IOCs where the confidence level is High, the participant is
tagged as Malicious.) Records that contain the suspicious entry are marked
with a camera icon .
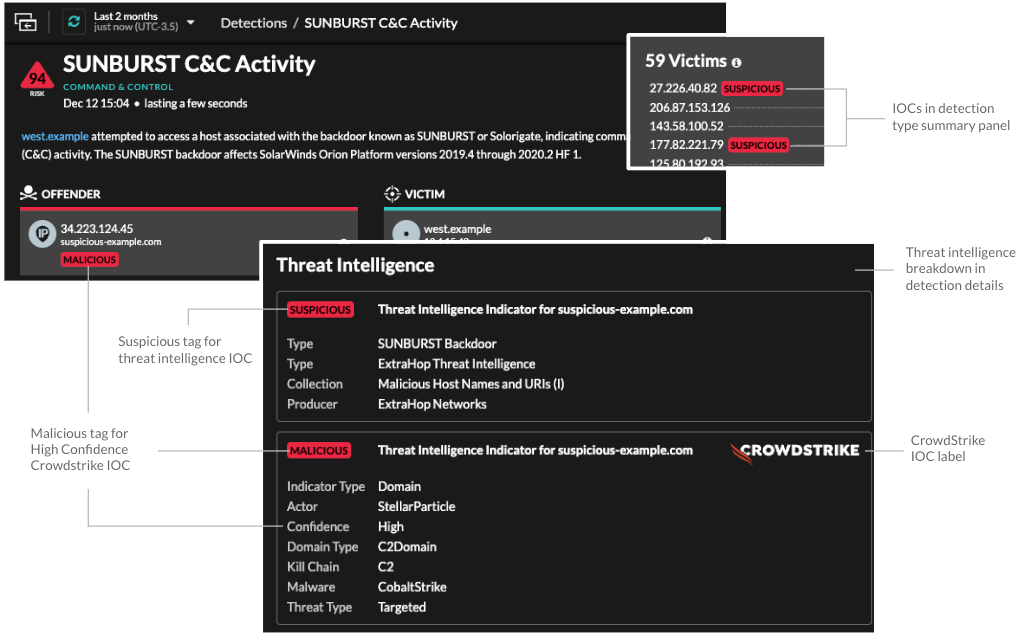
Curated threat collections from ExtraHop and CrowdStrike Falcon are available by default in your ExtraHop system. You can also upload custom collections from free and commercial sources in the security community.
Threat collections
The ExtraHop system supports threat collections from several sources.
Because cyber threat intelligence is community-driven, there are many external sources for threat collections. Data from these collections can vary in quality or relevance to your environment. To maintain accuracy and reduce noise, we recommend that you limit your uploads to high-quality threat intelligence data that focus on a specific type of intrusion, such as one collection for malware and another collection for botnets.
Threat collections curated by ExtraHop or Crowdstrike Falcon are updated every 6 hours. Suspicious IP addresses, domains, hostnames, and URIs appear in system charts and records.
Free and commercial collections offered by the security community that are formatted in Structured Threat Information eXpression (STIX) as compressed TAR files, such as .TGZ or TAR.GZ, can be uploaded manually or through the REST API to ExtraHop systems. STIX version 1.0 - 1.2 are currently supported. You must upload each threat collection individually to your console and all connected sensors.
Investigating threats
After the Reveal(x) system observes an indicator of compromise, the suspicious IP address, domain, hostname, or URI is marked as Suspicious or Malicious in detection summaries and on individual detection cards. In tables and charts, indicators of compromise are marked with a camera icon so you can investigate directly from the tables and charts you are viewing.
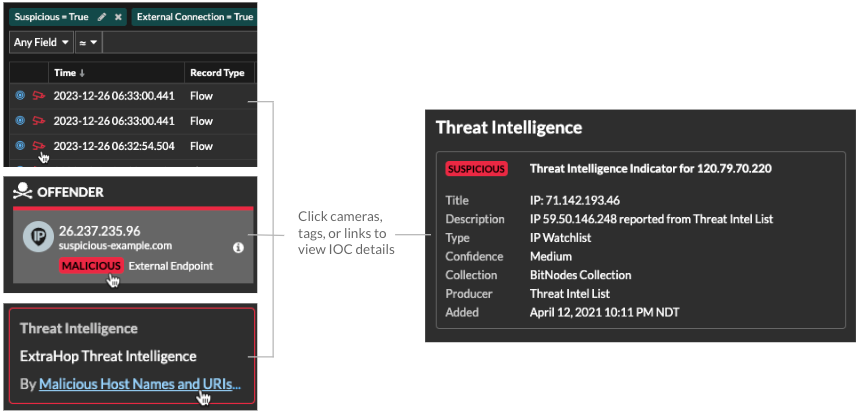
- If the threat collection is added or updated after the system has observed the suspicious activity, threat intelligence is not applied to that IP address, hostname, or URI until the suspicious activity occurs again.
- (Reveal(x) 360 only) If a built-in ExtraHop or CrowdStrike threat collection is updated, the ExtraHop system performs Automated Retrospective Detection (ARD), which searches for new domains, hostnames, URLs, and IP addresses that are indicators of compromise in records for the past 7 days. If a match is found, the system generates a retrospective detection.
- If you disable or delete a threat collection, all indicators are removed from the related metrics and records in the system. Detections that are recommended for triage based on threat intelligence will remain in the system after the associated collection is disabled.
Here are some places in the Reveal(x) system that show the indicators of compromise found in your threat collections:
Security Hardening Dashboard
The Threat Intelligence region contains
metrics for suspicious activity that matches the data in your threat collections. By clicking
any metric, such as HTTP Requests with Suspicious Hosts, you can drill down on the metric for
details or query records for related transactions.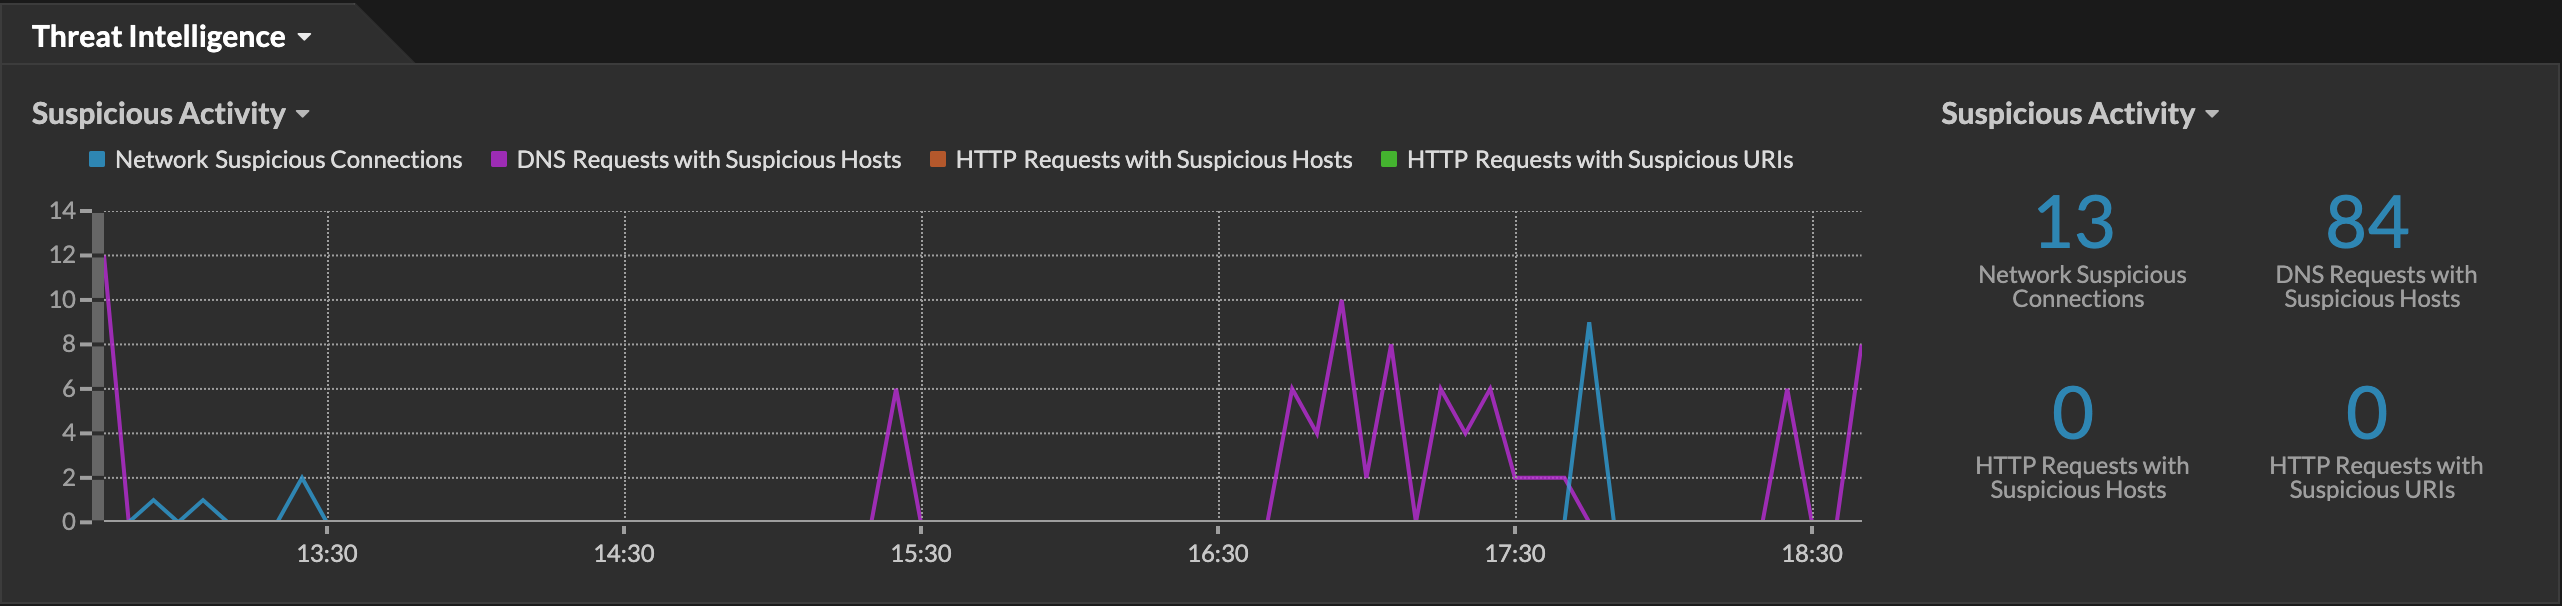
Perimeter Overview
In the halo visualization, any endpoints that match threat collection entries are highlighted
in red. 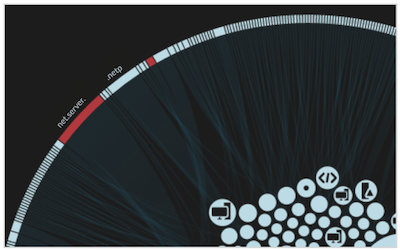
Detections
A detection appears when an indicator of compromise from a threat collection is identified in
network traffic. 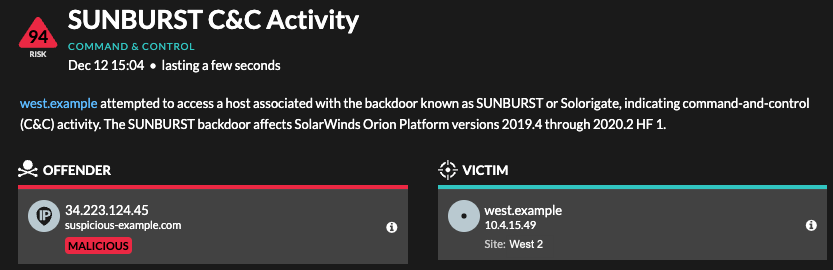
IP Address Details
IP address detail pages display complete threat intelligence for IP address indicators of
compromise.
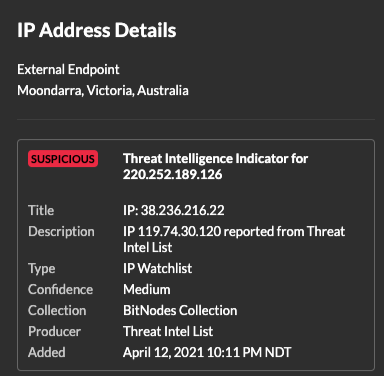
Records
- Under the Suspicious facet, click True to filter for all records with transactions that match suspicious IP addresses, hostnames, and URIs.
- Create a filter by selecting Suspicious, Suspicious IP, Suspicious Domain, or Suspicious URI from the trifield drop-down, an operator, and a value.
- Click the red camera icon to
view threat intelligence.
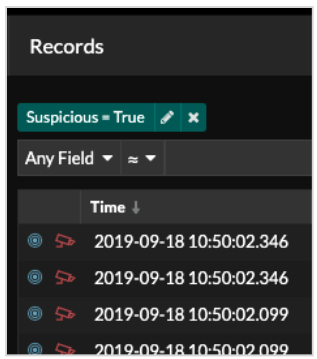
Manage threat collections
Before you begin
- Learn about threat intelligence.
- You must have System and Access Administration privileges on each console and sensor to manage threat collections.
- If your ExtraHop deployment includes a console, we recommend that you transfer management of all connected sensors to the console to enable or disable built-in threat collections across your entire system.
Enable or Disable built-in threat collections
Built-in threat collections from ExtraHop and CrowdStrike identify indicators of compromise throughout the system.
-
Click the System Settings icon and then click Threat
Intelligence.
-
In the Built-In Threat Collections table, click Enable or
Disable in the Actions column.
The system automatically checks for updates to ExtraHop and CrowdStrike threat collections every 6 hours.
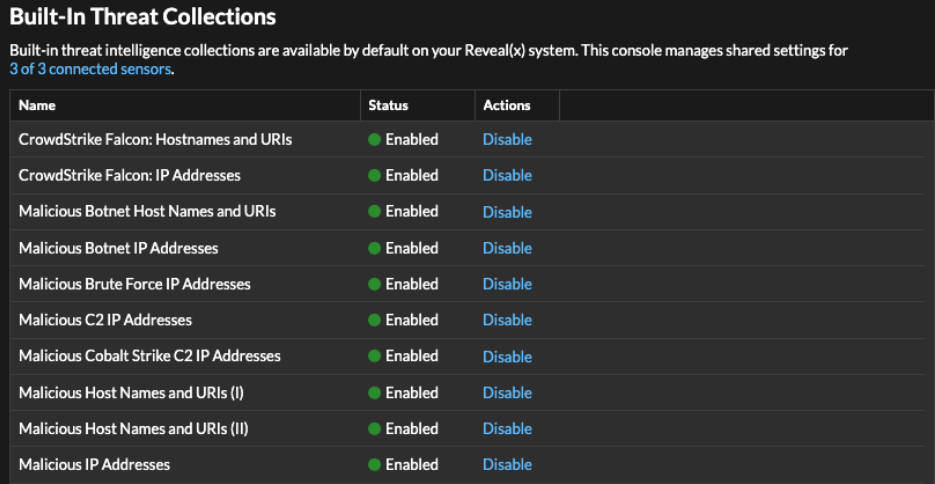
Upload a threat collection
Upload threat collections from free and commercial sources to identify indicators of compromise throughout the ExtraHop system. Because threat intelligence data is updated frequently (sometimes daily), you might need to update a threat collection with the latest data. When you update a threat collection with new data, the collection is deleted and replaced, and not appended to an existing collection.
Here are some considerations about uploading threat collections.
- Custom threat collections must be formatted in Structured Threat Information eXpression (STIX) as compressed TAR files, such as .TGZ or TAR.GZ. Reveal(x) currently supports STIX version 1.0 - 1.2.
- You can directly upload threat collections to Reveal(x) 360 for self-managed sensors. Contact ExtraHop Support to upload a threat collection to ExtraHop-managed sensors.
- The maximum number of observables that a threat collection can contain depends on your sensor memory and license. To ensure successful uploads within the limits of your sensors and license, we recommend breaking collections into files of less than 3,000 observables, with a total collection size of less than 1 million observables. Contact your ExtraHop representative for more information about license and platform limits for uploading threat collections.
- You can upload STIX files through the REST API.
- Log in to the ExtraHop system through https://<extrahop-hostname-or-IP-address>.
-
Click the System Settings icon and then click Threat
Intelligence.
- Click Manage custom collections.
- Click Upload New Collection.
- In the Collection ID field, type a unique collection ID. The ID can only contain alphanumeric characters and spaces are not allowed.
- Click Choose file and select a .tgz file that contains a STIX file.
- Type a display name in the Display Name field.
- Click Upload Collection.
- Repeat these steps for each connected sensor and on all consoles.
Alerts
Alerts make it easy to learn when important events occur on your network or if areas are not behaving as expected, such as Software License Agreement (SLA) violations or slow database response times.
| Video: | See the related training: Alerts |
Configured alert conditions determine when an alert is generated. Alert conditions are a combination of settings, such as a time interval, metric value, and metric calculations that occur on assigned data sources. Threshold or trend alerts are based on the value of the monitored metric.
Configuring alerts
Configure an alert to monitor for certain conditions and generate alerts when those conditions are met on the assigned data sources.
- Threshold alerts
- Threshold-based alerts are generated when a monitored metric crosses a defined
value within a specified time interval.
Create a threshold alert to monitor occurrences such as error rates that surpass a comfortable percentage or SLA-violations. Learn how to configure a threshold alert.
- Trend alerts
- Trend-based alerts are generated when a monitored metric deviates from the
normal trends observed by the system. Trend alerts are more complex than
threshold alerts and are useful for monitoring metric trends such as unusually
high round-trip times or storage servers experiencing abnormally low traffic,
which might indicate a failed backup.
Create a trend alert to monitor when a metric deviates from normal behavior and where thresholds are difficult to define. Learn how to configure a trend alert.
In addition, you can configure an alert with the following options:
- Set an exclusion interval to suppress alerts during certain time periods, such as a maintenance window.
- Configure notifications to receive an email when an alert is generated.
Viewing alerts
The Alerts page displays a list of all alerts generated during the specified time interval.
Select from the filters at the top of the page to adjust the list or click an alert name to view details about the alert.
- Source Type
- Filter alerts assigned to applications or devices.
- Severity
- Filter alerts by severity level.
- Alert Type
- Filter by threshold, trend, or detection alerts.
Important: Detection alerts are deprecated and will be removed in a future release. To receive notifications about detections, create a notification rule. - Site
- Filter by connected sites. (Only available from a console.)
The Alerts page displays the following information about each alert:
- Severity
- A color-coded indicator of the alert severity level. You can set the following severity levels: Emergency, Alert, Critical, Error, Warning, Notice, Info, and Debug.
- Alert name
- The name of the configured alert. Click the alert name to view alert details.
- Source
- The name of the data source on which the alert conditions occurred. Click the source name to navigate to the source Overview page.
- Time
- The time of the most recent occurrence of the alert conditions.
- Alert type
- Indicates a trend or threshold alert.
For more information about viewing alerts, see the following topics
Configure a threshold alert
Configure a threshold alert to monitor when a specific metric crosses a defined boundary. For example, you can generate an alert when an HTTP 500 status code is observed more than 100 times during a ten minute period.
Before you begin
You must have full write privileges or higher.-
Click the System Settings icon and then click Alerts.
-
In the Monitored Metric field, type the name of a metric
and then select from the search results.
The metric must be compatible with the assigned sources. For example, if you assign the alert to an application, you cannot select a device metric.
Note: If you select a detail metric, you can specify a key value. For example, you might select HTTP - Responses by Status Code and then specify 404 as the key value. An alert is generated only when HTTP responses with 404 status codes occur. 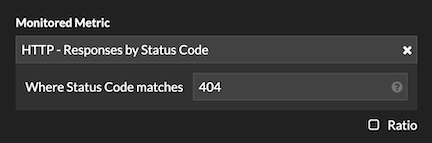
- (Optional):
To monitor the value of a metric divided by a secondary metric, click
Ratio and then select a secondary metric.
For example, you can monitor the percentage of HTTP errors occurring on responses by dividing HTTP response errors by HTTP responses.
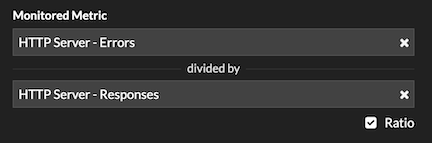
-
In the Alert Condition section, specify conditions for generating an
alert.
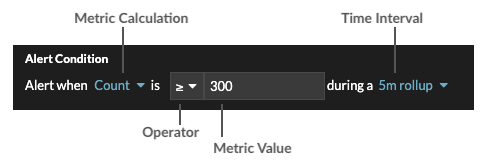
For example, to generate an alert when more than 300 HTTP response errors occur within 5 minutes, specify the following conditions:- Metric Calculation: Count
- Operator: >
- Metric Value: 300
- Time Interval: 5m rollup
Configure a trend alert
Configure a trend alert to monitor when a specific metric deviates from normal trends. Trend alerts are useful for monitoring metric trends such as unusually high round-trip times or storage servers experiencing abnormally low traffic, which might indicate a failed backup. For example, you can configure a trend alert that generates alerts when a spike (75th percentile) in HTTP web server processing time lasts longer than 10 minutes, and where the metric value of the processing time is 100% higher than the trend.
Before you begin
You must have full write privileges or higher.-
Click the System Settings icon and then click Alerts.
- (Optional):
To monitor the value of a metric divided by a secondary metric, click
Ratio and then select a secondary metric.
For example, divide HTTP response errors by HTTP responses to monitor trends in the percentage of HTTP errors.
-
In the Alert Condition section, specify conditions for generating an
alert.
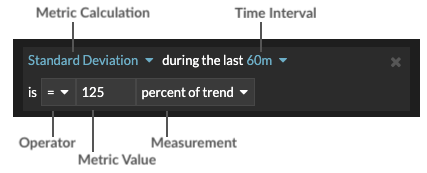 For example, to generate an alert when the standard deviation of the observed metric over a 60 minute interval is equal to a trend value of 25%, specify the following conditions:
- Metric Calculation: Standard Deviation
- Time Interval: 60m
- Operator: =
- Metric Value: 125
- Measurement: percent of trend
Add a notification to an alert configuration
Configure an alert to send a notification when the alert condition is met.
Add an alert notification (Reveal(x) Enterprise)
You can add a notification to an alert configuration that will sent an email to a specified email address or email group when the alert occurs. The email contains alert details and a link to view the alert source. You can also send notifications to an SNMP listener.
Before you begin
- You must have full write privileges or higher.
- Your ExtraHop system must be configured to send notifications.
- If you want an alert to be sent to multiple email addresses, configure an email group.
- If you want to send notifications through SNMP, configure the SNMP listener.
-
Click the System Settings icon and then click Alerts.
Add an alert notification (Reveal(x) 360)
You can add a notification to an alert configuration that will sent an email to one or more specified email addresses when the alert occurs. The email contains alert details and a link to view the alert source.
Before you begin
You must have full write privileges or higher.-
Click the System Settings icon and then click Alerts.
Add an exclusion interval to an alert
Exclusion intervals enable you to suppress one or more alerts during specific time ranges. For example, you can suppress an alert after business hours, on weekends, or during maintenance windows.
Before you begin
You must have full write privileges or higher.-
Click the System Settings icon and then click Alerts.
-
In the Exclusion Intervals section, add an existing interval or create a new
one.
Option Description Add an existing exclusion interval - Click the exclusion interval drop-down list and select an interval.
- Repeat to add an additional interval to the alert.
Create a new exclusion interval - Click Create.
- Type a unique name for the exclusion interval in the Name field.
- In the Description field, add information about the interval.
- In the Exclude section, specify an interval and enter a time
range:
- Click Every day from to set a daily recurring interval.
- Click Every week from to set a weekly recurring interval.
- Click Custom time range to set a one-time interval.
- Optional: In the Assignments section, select a global assignment
options:
- Click Assign to all alerts to add the interval to all existing and future alert configurations.
- Click Assign to all trends to exclude metric activity during the interval from trend calculations.
- Click Save to create the interval and add it to the alert.
Tip: From the list of added exclusion intervals, click an interval name to edit properties, or click the remove (X) icon to remove the interval from the alert. 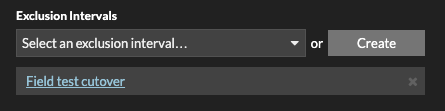
Records
Records are structured information about transaction, message, and network flows that are generated and sent from the ExtraHop system to a recordstore. After your records are collected and stored, you can query for them throughout the ExtraHop system.
Records are collected at two protocol levels: L3 and L7. L3 (or flow) records show network-layer transactions between two devices over the IP protocol. L7 records show transactions that are message-based (such as ActiveMQ, DNS, and DHCP), transactional (such as HTTP, CIFS, and NFS), and session-based (such as SSL and ICA).
| Video: | See the related training: Records |
Before you begin
- You must have a configured recordstore, such as an ExtraHop recordstore, Splunk, Google BigQuery, or CrowdStrike Falcon LogScale.
- You can only configure one recordstore for the ExtraHop system.
- Your ExtraHop system must be configured to collect and store flow records or L7 records.
Navigating records
Click Records from the top menu to create a new record query. From the New Query page, you can specify a filter and record type.
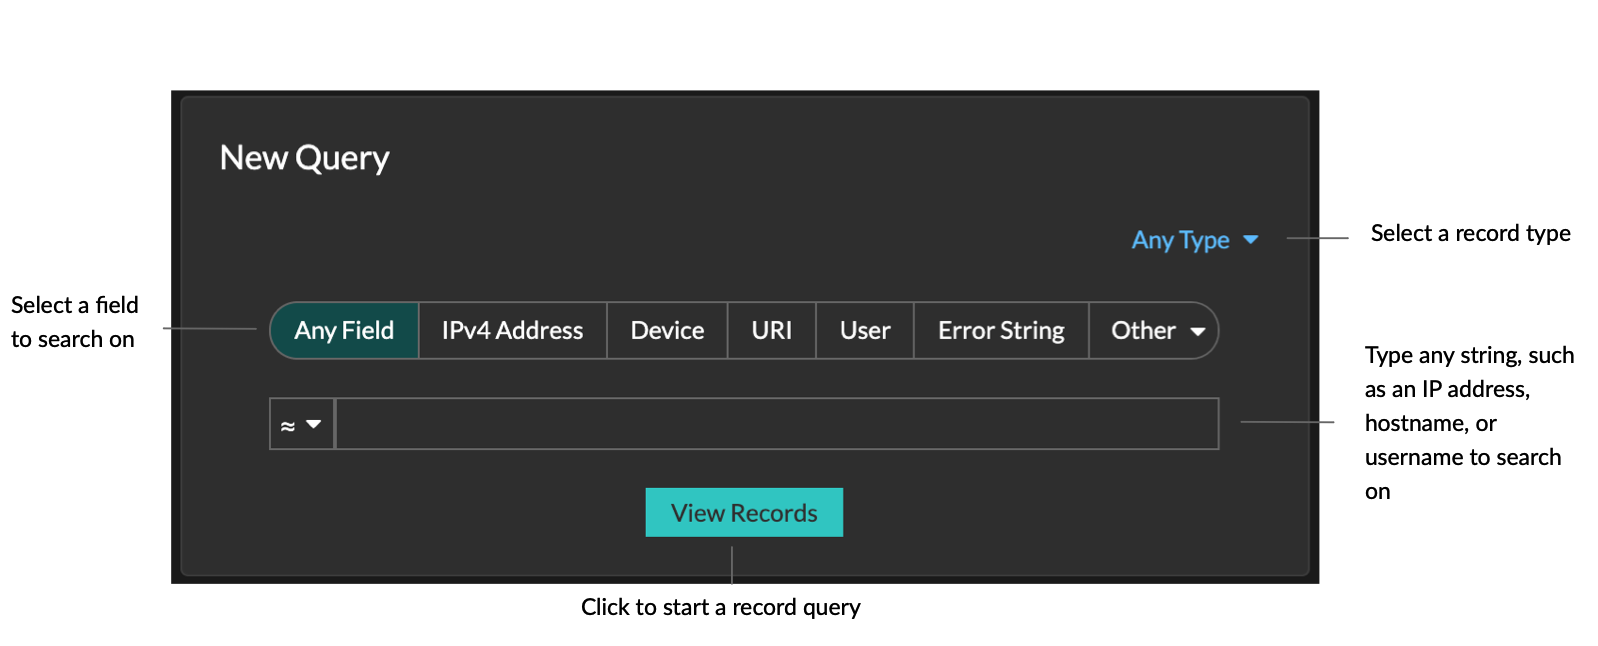
The results appear on the main Records page.
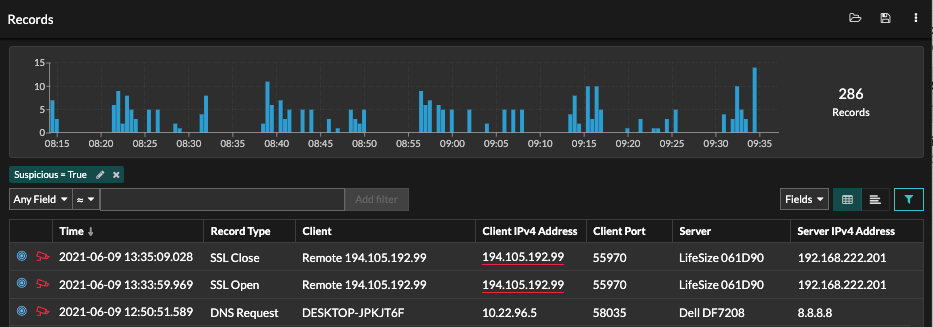
| Note: | A query can result in millions of records based on the time interval and filter criteria. If a query exceeds the maximum number of query results, a truncated number of records appear. (ExtraHop recordstore only.) |
Here are some ways you can drill down on record query results:
- From the records chart, hover over a time interval to view the number of records, or click-and-drag across the chart to narrow the record query results to a time interval.
- Click a hostname or IP address to view device or external endpoint details.
- Records that contain suspicious IP addresses, hostnames, and URIs appear with a red camera icon. Click the camera icon to view threat intelligence for the record.
- Click a packet icon to start a packet query that is filtered by this record.
- Record results appear in a table by default. Click the Table View or Verbose View
 icons
to toggle the record view.
icons
to toggle the record view. - A query automatically pauses if the number of record bytes scanned or returned is extremely large. If paused, the query displays the most recent records. Click Continue Query to resume searching.
- Click the Fields drop-down list to add additional record information to the record view.
- In table view, click-and-drag column headers to arrange the record information.
- Apply simple or advanced filters to find potential issues, such as overly-long processing times or unusual response sizes.
| Note: | To create a record query for a custom metric, you must first define the record relationship by linking the custom metric to a record type. |
Filter your records with a simple query
There are a number of ways you can filter your record query results to find the exact transaction you are looking for. The sections below describe each method and show examples you can start with to familiarize yourself.
If you are trying to filter records by simple criteria (say, if you want all HTTP transactions from a single server that generated 404s), you can create a simple query in one of the following ways:
- Add a filter or refine results from the left pane
- Add a filter from the trifield
- Add a filter directly from record results
For complex filtering, see Query records with an advanced filter.
Filtering record results from the left pane
When you click Records from the top menu, all of the available records for your selected time interval appear. You can then filter from the left pane to refine your results.
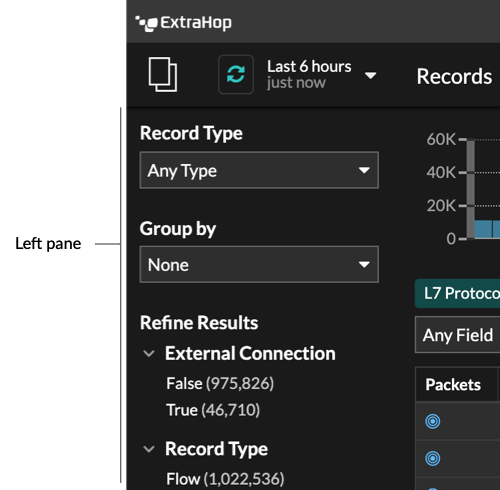
The Record Type drop-down menu displays a list of all of the record types that your ExtraHop system is configured to collect and store. A record type determines what data is collected and stored in the recordstore.
| Note: | Because you must write a trigger to collect records, you need a way to identify the type of data you will collect. There are built-in record types, which collect all of the available known fields for a protocol. You can start with a built-in record type (such as HTTP) and write a trigger to collect only the fields for that protocol that matter to you (such as URI and status code). Or, advanced users can create a custom record type if they need to collect proprietary information that is not available through a built-in record type. |
The Group By drop-down gives you a list of fields to further filter the record type by.
The Refine Results section shows you a list of common record filters for the selected record type with the number of records that match the filter in parenthesis.
Filtering record results through the trifield
Select a field from the Any Field drop-down (such as Server), select an operator (such as the equal sign (=)), and then type a hostname. Click Add filter, and the filter is added above the filter bar.
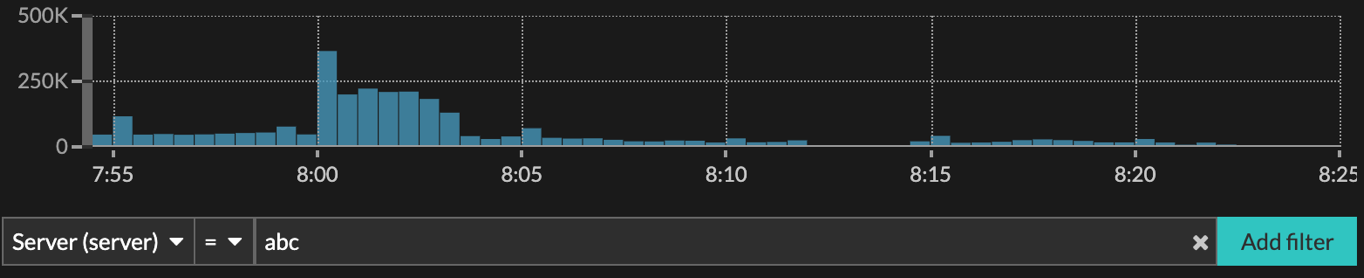
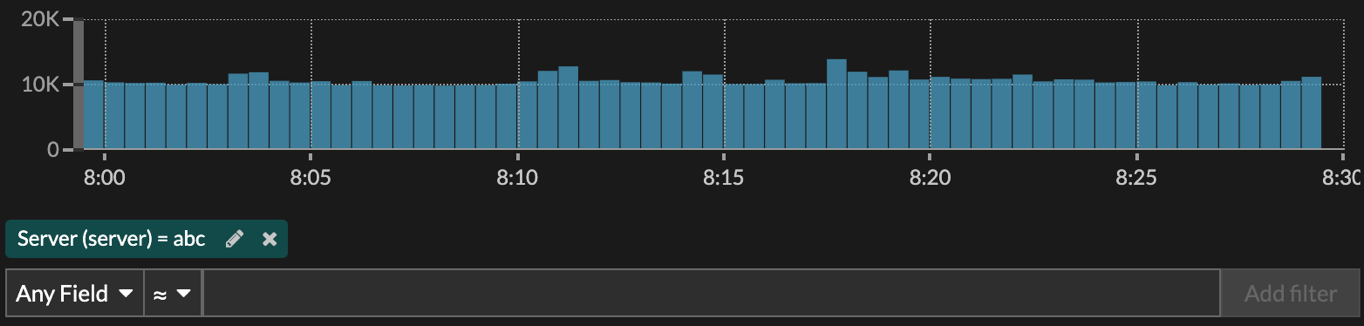
Your results only show records that match the filter; in our example this means we only see results for transactions that are for the server named abc.
The following operators can be selected, based on the selected field name:
| Operator | Description |
|---|---|
| = | Equals |
| ≠ | Does not equal |
| ≈ | Includes If records are stored on an ExtraHop recordstore, the includes operator matches whole words delineated by spaces and punctuation. For example, a search for "www.extra" would match "www.extra.com" but not "www.extrahop.com". For all other recordstores, the includes operator matches substrings, including spaces and punctuation. For example, a search for "www.extra" would match "www.extrahop.com", but a search for "www extra" would not match "www.extrahop.com". Regex and wildcard characters are not supported. |
| ≈/ | Excludes If records are stored on an ExtraHop recordstore, the excludes operator matches whole words delineated by spaces and punctuation. For example, a search for "extra" would exclude "www.extra.com" but not "www.extrahop.com". For all other recordstores, the excludes operator matches substrings, including spaces and punctuation. For example, a search for "www.extra" would exclude "www.extrahop.com", but a search for "www extra" would not exclude "www.extrahop.com". Regex and wildcard characters are not supported. |
| < | Less than |
| ≤ | Less than or equal to |
| > | Greater than |
| ≥ | Greater than or equal to |
| starts with | Starts with |
| exists | Exists |
| does not exit | Does not exist |
Filtering directly from record results
You can select any field entry displayed in either table view or verbose view in your record results and then click the pop-up operator to add the filter. Filters are displayed below the chart summary (except for the record type field, which is changed in the left pane).
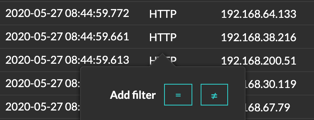
Finding records in the ExtraHop system
- Type a search term in the global search field at the top of the screen and click Search Records to start a query across all stored records.
- From a device overview page, click Records to start a query filtered by that device.
- From a device group overview page, click View Records to start a query filtered by that device group.
- From a detection card, click View records to start a query filtered with the transactions associated with the detection.
- Click the Records icon from a chart widget, as shown in the following figure.
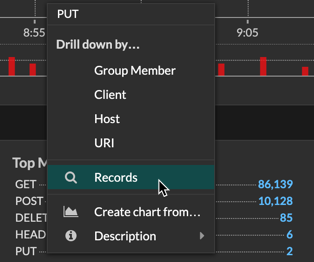
- Click the Records icon next to a detail metric after drilling down on a
top-level metric. For example, after drilling down on HTTP Responses by Server,
click the Records icon to create a query for records that contain a specific server
IP address.
Collect records
Certain types of records are enabled for collection by default. You can add or remove the types of records that are collected and sent to your recordstore from the Settings / Records page. These records primarily contain information about messages, transactions, and sessions sent over common L7 protocols such as DNS, HTTP, and SSL.
If you want to collect only specific details from transactions, you can create custom records through the ExtraHop Trigger API.
| Note: | You can manage these settings centrally from a console. |
Learn more about ExtraHop Records.
Before you begin
You must have a configured recordstore, such as an ExtraHop recordstore, Splunk, or Google BigQuery.-
Click the System Settings icon and then click Record
Collection.
Collect flow records
You can automatically collect and store all flow records, which are network-layer communications between two devices over an IP protocol. If you enable this setting, but do not add any IP addresses or port ranges, all detected flow records are captured. Configuring flow records for automatic collection is fairly straight-forward and can be a good way to test connectivity to your recordstore.
Before you begin
You must have access to an ExtraHop system with System and Access Administration privileges.Collect L7 records with a trigger
L7 protocols can be committed (collected and stored) as a record through a global trigger function. L7 records include messages, transactions, and sessions sent over common L7 protocols such as DNS, HTTP, and SSL.
In the following steps, you will learn how to collect records for any device that sends or receives an HTTP response.
Learn more about ExtraHop Records.
First, we will write a trigger to collect information from the built-in HTTP record type with the commitRecord() method, which is available on all protocol classes. The basic trigger syntax is <protocol>.commitRecord(). Then, we will assign the trigger to a web server. Finally, we will verify that the records are being sent to the recordstore.
Before you begin
- You must have a configured recordstore, such as an ExtraHop recordstore, Splunk, or Google BigQuery
- These instructions assume some familiarity with ExtraHop Triggers, which require experience with JavaScript. Alternatively, you can configure L7 record collection through the ExtraHop system.
-
Click the System Settings icon , and then click Triggers.
Next steps
Wait a few minutes for records to be collected, and then verify that your records are being collected in the next step by clicking Records from the top menu, and then clicking View Records to start a query.If you do not see any HTTP records after 5 minutes, click the Debug Log tab at the bottom of the page in the Trigger Editor to see if there are any errors you can resolve. If the trigger is running, the message "committing HTTP responses" is displayed. If records do not appear after the trigger is running, contact ExtraHop Support.
Collect custom records
You can customize the type of record details you generate and store on a recordstore by writing a trigger. We recommend that you also create a record format to control how the records display in the ExtraHop system.
Before you begin
- These instructions assume some familiarity with ExtraHop Triggers.
- If you are connected to a Google BigQuery recordstore, there is a custom records field limit of 300.
In the following example, you will learn how to only store records for HTTP transactions that results in a 404 status code. First, we will write a trigger to collect information from the built-in HTTP record type. Then, we will assign the trigger to a web server. Finally, we will create a record format to display selected record fields in the table view for our record query results.
Write and assign a trigger
Note that the trigger must be created on each sensor that you want to collect these types of records from. You can create the trigger on a console to collect your custom records from all connected sensors.
-
Click the System Settings icon , and then click Triggers.
-
Click the Editor tab to write the trigger
specifications.
The following figure shows an example configuration that only collects records when a 404 status code is detected. We also set a name (web404) for these types of records to identify them in a record query and added identifying information for debugging.
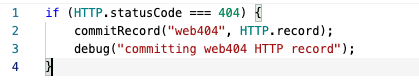
In the next steps, assign the trigger to a device or device group for which you want to monitor 404 status codes. -
Click the Assign Triggers icon, select the trigger you created in the previous
steps, and then click Assign Triggers. In the following
figure, we have selected our web server, web2-sea.
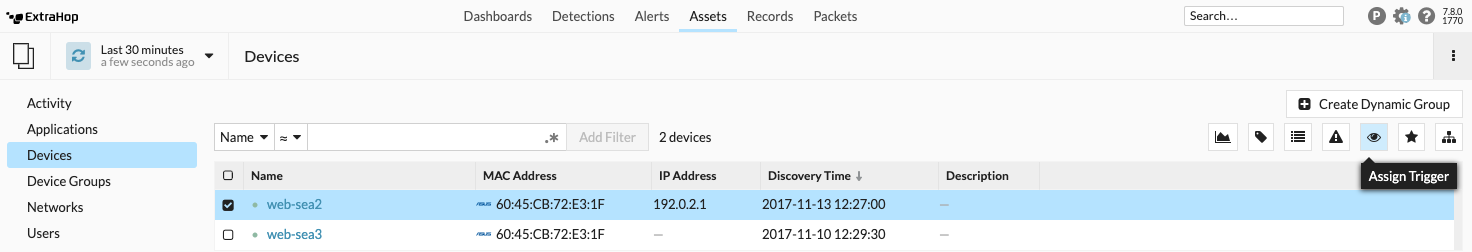 After assigning the trigger, return to the page and select the trigger you created. First, make sure your device has activity. Then, click the Debug Log tab to see if the trigger is committing your records. For the following example, we intentionally visited unavailable web pages to generate 404 errors.
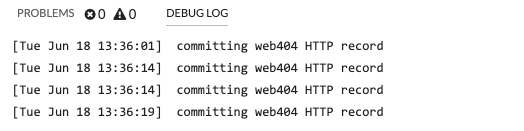
Create a custom record format to display your record results in a table
Record formats are the recommended way to display your records with only the fields you want to see. Without a custom record format, the fields for your custom record will not appear in any selectable lists, such as the Group By list.
-
Click the System Settings icon and then click Record
Formats.
-
Complete the following fields:
Display Name: Type a unique name for your record format.
Author: Identify the author for the record format.
Record Type: Type the same record type ID you created in the trigger. In our example, this value is web404.
Schema on Read: Paste the copied contents from step 4 into the text box. Edit the box to delete any unwanted fields. For our example in the figure below, we only kept the following fields: Client, Server, Method, Status Code, URI, and Processing Time.
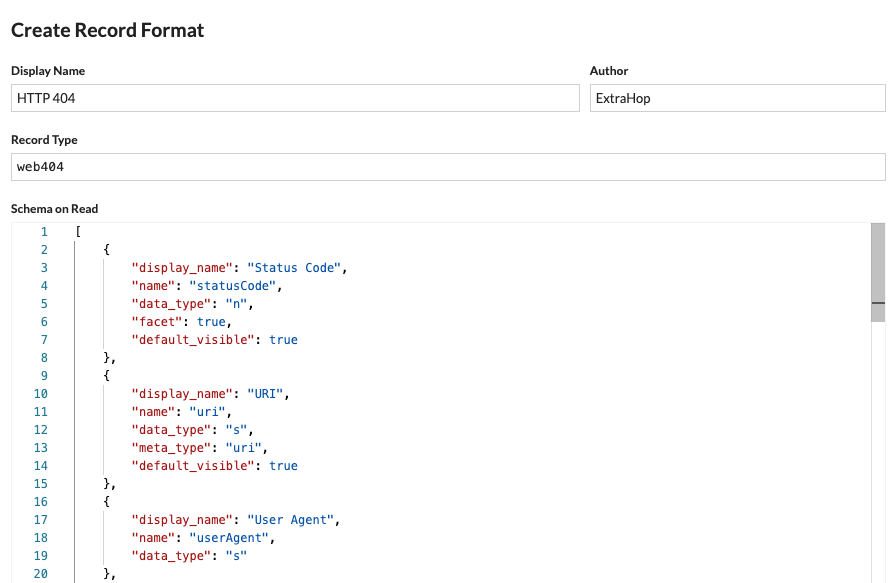
Record format settings
The Record Format Settings page displays a list of all built-in and custom record formats that are available on your ExtraHop sensors or console. If you need to create a custom record format, we recommend that you copy and paste the schema on read information from a built-in record format. Advanced users might want to create a custom record format with their own field-value pairs, and should apply the reference material provided in this section.
- Display Name
- The name displayed for the record format in the ExtraHop system. If there is no record format for the record, the record type is displayed.
- Author
- (Optional) The author of the record format. All built-in record formats display ExtraHop as the author.
- Record Type
- A unique alphanumeric name that identifies the type of information contained in the associated record format. The record type links the record format with the records that are sent to the recordstore. Built-in record formats have a record type that begins with a tilde (~). Custom record formats cannot have a record type that begins with a tilde (~) or an at symbol (@).
- Schema on Read
- A JSON-formatted array with at least one object, which consists of a field name and
value pair. Each object describes a field in the record and each object must have a
unique combination of name and data type for that record format. You can create the
following objects for a custom record format:
- name
- The name of the field.
- display_name
- The display name for the field. If the display_name field is empty, the name field is displayed.
- description
- (Optional) Descriptive information about the record format. This field is limited to the Record Format Settings page and is not displayed in any record query.
- default_visible
- (Optional) If set to true, this field displays in the ExtraHop system as a column heading by default in table view.
- facet
- (Optional) If set to true, facets for this field display in the ExtraHop system. Facets are a short list of the most common values for the field that can be clicked to add a filter.
- data_type
- The abbreviation that identifies the type of data stored in this field. The
following data types are supported:
Data Type Abbreviation Description application app ExtraHop application ID (string) boolean b Boolean value device dev ExtraHop device ID (string) flow interface fint Flow interface ID flow network fnet Flow network ID IPv4 addr4 An IPv4 address in dotted-quad format. Greater or less than filters are supported. IPv6 addr6 An IPv6 address. Only string-oriented filters are supported. number n Number (integer or floating point) string s Generic string - meta_type
- The sub-classification of the data type that further determines how the
information is displayed in the ExtraHop system. The following meta-types are supported for
each of the associated data types:
Data Type Meta Type String - domain
- uri
- user
Number - bytes
- count
- expiration
- milliseconds
- packets
- timestamp
Query records with an advanced filter
You can query records that are stored in the recordstore with an advanced filter.
| Note: | To create a record query for a custom metric, you must first define the record relationship by linking the custom metric to a record type. |
Next steps
- To learn how to query for a specific record, see our walkthrough for Discovering missing web resources.
- You can also automate this task through the REST API.
Filter your records with advanced query rules
For advanced queries, you can create and modify complex filters by clicking the Add
Advance Filter button ![]() or by
clicking the pencil icon
or by
clicking the pencil icon ![]() next to any filter that you have added.
next to any filter that you have added.
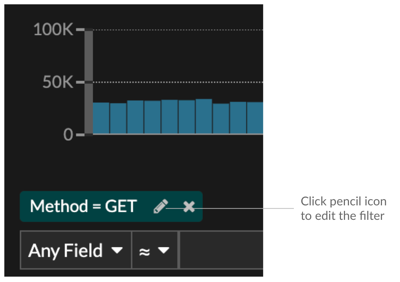
- You can specify multiple criteria with OR (Match Any), AND (Match All), and NONE operators
- You can group filters and nest them to four levels within each group
- You can edit a filter group after you create it
- You can create a descriptive name to identify the general purpose of the query
Create a complex filter with AND and OR operators
The following example shows how you can create an advanced query to filter your records with complex criteria. We will create a filter to return results for all HTTP records that include two URIs plus a status code greater than or equal to 400 or a processing time greater than 750 milliseconds.
| Important: | To try this example, you must have HTTP traffic on your network. |
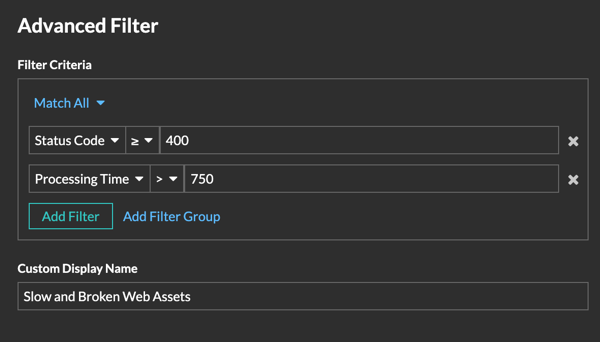
-
Click the Add Advanced Filter button
 . The button is on the right side of the page, above
the records search results.
. The button is on the right side of the page, above
the records search results.
-
In the Custom Display Name field, type a descriptive name
to make the filter easy to identify on the results page, otherwise the display
name shows the first filter and the number of other applied rules:

We will type "Slow and Broken Web Assets" in the field.
Next steps
You can click the Save iconEnable record queries for custom metrics
Custom metrics are typically created to collect specific information about your environment. You can configure settings that enable you to query and retrieve transaction-level records associated with a custom metric. In the Metric Catalog, the Record Relationships section enables you to associate a custom metric with a record type. If you queried for records from that custom metric, you would return results for all records of that record type, regardless of the other attributes configured for your custom metric. We recommend that you add filters to return meaningful results for your record queries.
By setting advanced filters, you automatically filter records by the specified criteria. Advanced filters are complex and can be nested to four levels.
Before you begin
Create a custom metric-
Click the System Settings icon and then click Metric
Catalog.
-
Click one or more record types in the list and then click outside of the list
to apply your selections. Additional options to filter record fields appear
below the selected record types.
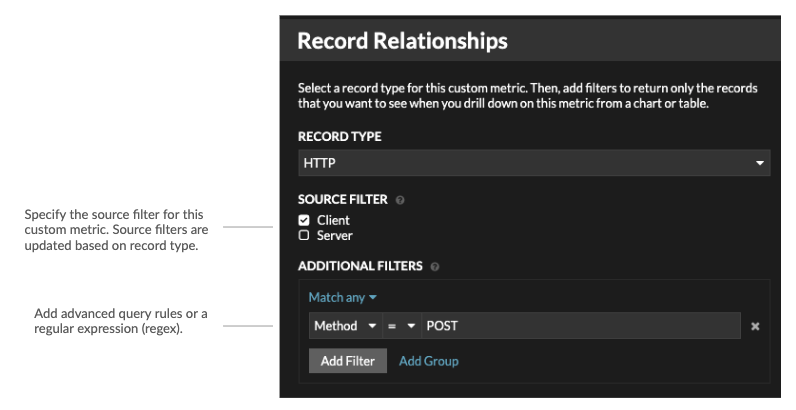
Next steps
- Create a record query for your custom metric by clicking the metric in a chart and then clicking Records.
Packets
A network packet is a small amount of data sent over Transmission Control Protocol/Internet Protocol (TCP/IP) networks. The ExtraHop system enables you to continuously collect, search, and download these packets with a Trace appliance, which can be useful to detect network intrusions and other suspicious activity.
You can search for and download packets from the Packets page in the ExtraHop system and through the Packet Search resource in the ExtraHop REST API. Downloaded packets can then be analyzed through a third-party tool, such as Wireshark.
| Note: | If you do not have a Trace appliance, you can still collect packets through triggers. See Initiate precision packet captures to analyze zero window conditions for an example. |
| Video: | See the related training: Packets |
Launch a quick packet query by clicking Packets from the top menu. The ExtraHop system queries for all packets and displays the Packet Query page. If you change the time interval, the query starts again. Either end of the gray bar displays a timestamp, which is determined by the current time interval. The time on the right displays the starting point of the query and the time on the left displays the endpoint of the query. The blue bar indicates the time range during which the system found packets. You can drag to zoom on a period of time in the blue bar to run a query again for that selected time interval.
The following figure provides an overview of the Packet Query page and features:
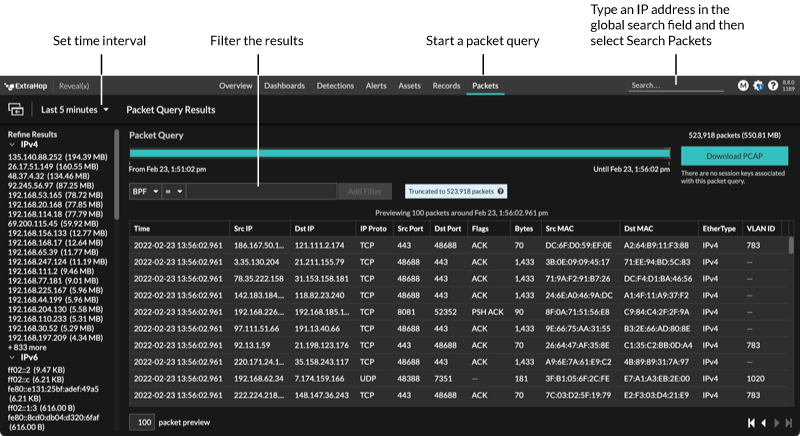
| Tip: | Filter packets with Berkeley Packet Filter syntax. |
There are multiple locations in the ExtraHop system from which you can initiate a packet query:
- Type an IP address in the global search field and then select the Search Packets
icon
 .
.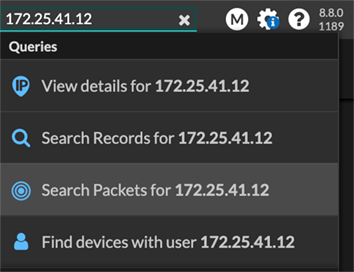
- Click Packets on a device page.
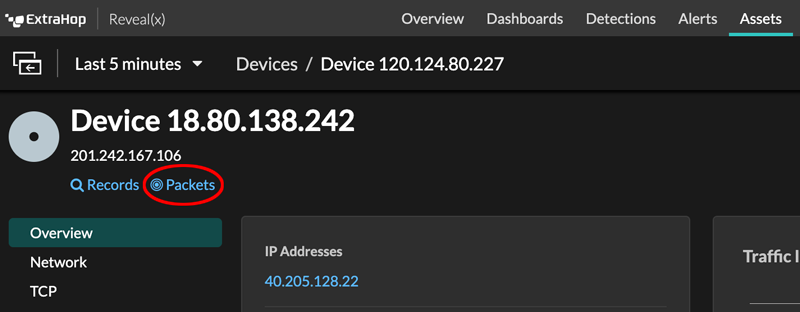
- Click the Packets icon next to any record on a record query results page.

- Click on an IP address or hostname in any chart with metrics for network bytes
or packets by IP address to see a context menu. Then, click the Packets icon
to query for the device and time interval.
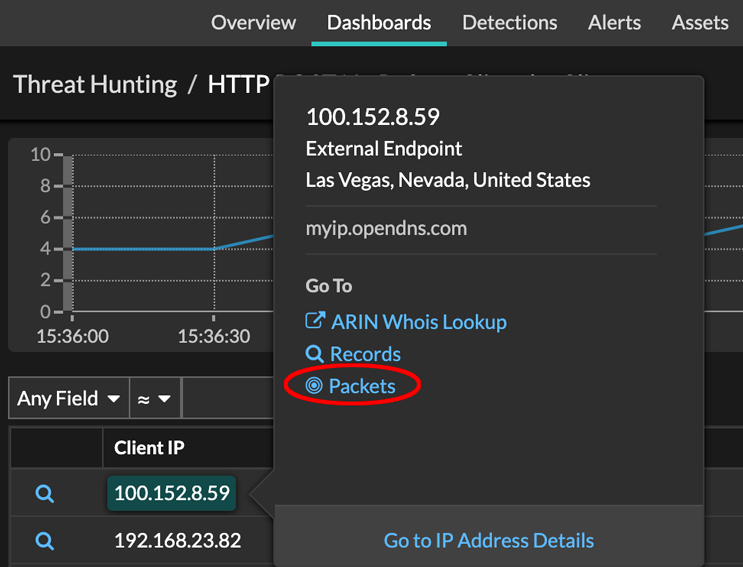
Configure a global packet capture
A global packet capture collects every packet that is sent to the ExtraHop system for the duration that matches the criteria.
- On Reveal(x) Enterprise systems, click Packets from the
top menu and then click Download PCAP.
To help locate your packet capture, click and drag on the Packet Query timeline to select the time range when you started the packet capture.
- On ExtraHop Performance systems, click the System Settings icon ,
click All Administration, and then click View and
Download Packet Captures in the Packet Capture section.
Analyze a packet capture file
The offline capture mode enables administrators to upload and analyze a capture file recorded by packet analyzer software, such as Wireshark or tcpdump, in the ExtraHop system.
Here are some important considerations before enabling offline capture mode:
- When the capture is set to offline mode, the system datastore is reset. All previously recorded metrics are deleted from the datastore. When the system is set to online mode, the datastore is reset again.
- In offline mode, no metrics are collected from the capture interface until the system is set to online mode again.
- Only capture files in the pcap format are supported. Other formats such as pcpapng are not supported.
Set the offline capture mode
Return the system to live capture mode
- In the System Configuration section, click Capture (offline).
- Click Restart Capture.
- Select Live, and then click Save.
Filter packets with Berkeley Packet Filter syntax
Search for packets with the Berkeley Packet Filter (BPF) syntax alone, or in combination with the built-in filters.
Berkeley Packet Filters are a raw interface to data link layers and are a powerful tool for intrusion detection analysis. The BPF syntax enables users to write filters that quickly drill down on specific packets to see the essential information.
The ExtraHop system constructs a synthetic packet header from the packet index data and then runs the BPF syntax queries against the packet header to ensure that queries are much faster than scanning the full packet payload. Note that ExtraHop supports only a subset of the BPF syntax. See Supported BPF syntax.
The BPF syntax consists of one or more primitives preceded by one or more qualifiers. Primitives usually consist of an ID (name or number) preceded by one or more qualifiers. There are three different kinds of qualifiers:
- type
- Qualifiers that indicate what type the ID name or number refers to. For example, host, net, port, and portrange. If there is no qualifier, host is assumed.
- dir
- Qualifiers that specify a particular transfer direction to and or from an ID. Possible directions are src, dst, src and dst, and src or dst. For example, dst net 128.3.
- proto
- Qualifiers that restrict the match to the particular protocol. Possible protocols are ether, ip, ip6, tcp, and udp.
Add a filter with BPF syntax
-
Click Download PCAP to save the packet capture with your
filtered results.
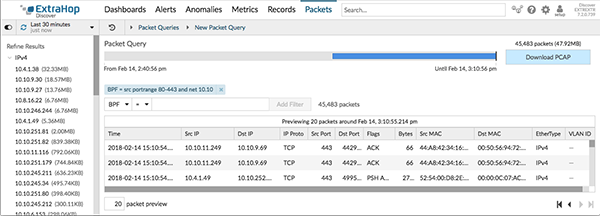
Supported BPF syntax
The ExtraHop system supports the following subset of the BPF syntax for filtering packets.
| Note: |
|
| Primitive | Examples | Description |
|---|---|---|
| [src|dst] host <host ip> | host 203.0.113.50 dst host 198.51.100.200 |
Matches a host as the IP source, destination, or either. These host expressions can be specified in conjunction with other protocols like ip, arp, rarp or ip6. |
| ether [src|dst] host <MAC> | ether host 00:00:5E:00:53:00 ether dst host 00:00:5E:00:53:00 |
Matches a host as the Ethernet source, destination, or either. |
| vlan <ID> | vlan 100 | Matches a VLAN. Valid ID numbers are 0-4095. VLAN priority
bits are zero. If the original packet had more than one VLAN tag, the synthetic packet the BPF matches against will only have the innermost VLAN tag. |
| [src|dst] portrange <p1>-<p2>
or [tcp|udp] [src|dst] portrange <p1>-<p2> |
src portrange 80-88 tcp dst portrange 1501-1549 |
Matches packets to or from a port in the given range. Protocols can be applied to a port range to filter specific packets within the range. |
| [ip|ip6][src|dst] proto <protocol> | proto 1 src 10.4.9.40 and proto ICMP ip6 and src fe80::aebc:32ff:fe84:70b7 and proto 47 ip and src 10.4.9.40 and proto 0x0006 |
Matches IPv4 or IPv6 protocols other than TCP and UDP. The protocol can be a number or name. |
| [ip|ip6][tcp|udp] [src|dst] port <port> | udp and src port 2005 ip6 and tcp and src port 80 |
Matches IPv4 or IPv6 packets on a specific port. |
| [src|dst] net <network> | dst net 192.168.1.0 src net 10 net 192.168.1.0/24 |
Matches packets to or from a source or destination or either, that reside in a
network. An IPv4 network number can be specified as one of the following values:
|
| [ip|ip6] tcp tcpflags & (tcp-[ack|fin|syn|rst|push|urg|) | tcp[tcpflags] & (tcp-ack) !=0 tcp[13] & 16 !=0 ip6 and (ip6[40+13] & (tcp-syn) != 0) |
Matches all packets with the specified TCP flag |
| Fragmented IPv4 packets (ip_offset != 0) | ip[6:2] & 0x3fff != 0x0000 | Matches all packets with fragments. |
Store SSL session keys on connected packetstores
When session key forwarding is configured on an ExtraHop system that is connected to a packetstore, the ExtraHop system can store encrypted session keys along with the collected packets.
Before you begin
Learn more about decrypting packets with stored keys.- Log in to the Administration settings on the ExtraHop system through https://<extrahop-hostname-or-IP-address>/admin.
- In the System Configuration section, click Capture.
- Click SSL Session Key Storage.
- Select Enable SSL Session Key Storage.
- Click Save.
Next steps
For more information about downloading session keys, see Download session keys with packet captures.
Download session keys with packet captures
You can download PCAP Next Generation (pcapng) file that includes all captured SSL session keys and encrypted packets. You can then open the packet capture file in a tool such as Wireshark, which can apply the session keys and display the decrypted packets.
Before you begin
- You must have a configured packetstore or packet capture disk before you can download packets and session keys from a sensor or a console. See our deployment guides to get started.
- The console must be licensed for SSL Shared Secrets.
- The SSL Session Key Storage setting must be enabled on the sensor.
- Reveal(x) Enterprise users must have either system access and administration privileges or limited privileges with packets and session keys access. Reveal(x) 360 users must have packets and session keys access.
View the decrypted payload in Wireshark
- Start the Wireshark application.
- Open the downloaded packet capture (pcapng) file in Wireshark.
When an SSL-encrypted frame is selected, the Decrypted SSL tab appears at the bottom of the Wireshark window. Click the tab to see the decrypted information in the packet capture as plain text.
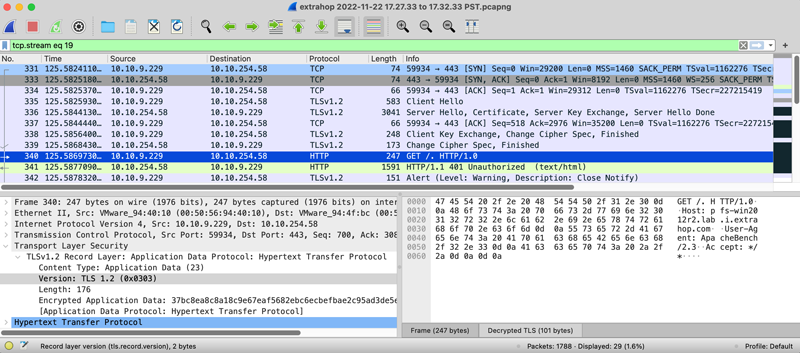
Triggers
Triggers are composed of user-defined code that automatically runs on system events through the ExtraHop Trigger API. You can write a trigger, which is a block of JavaScript, through the trigger API to extract, store, and visualize custom wire data events and metrics that are specific to your business, infrastructure, network, clients, and business applications.
Some of the most common workflows that you can perform through triggers include the following operations:
- Create an application container in which metrics are collected for specific devices. Application containers augment the device-based views that the ExtraHop system constructs by default.
- Create custom metrics and save them to the ExtraHop datastore. For example, user agent data generated by an HTTP request is not a metric built into the ExtraHop system. However, the ExtraHop Trigger API provides a user agent HTTP property, which enables you to write a trigger that collects user agent data as a custom metric.
- Generate records and write them to a datastore for long-term storage and retrieval.
- Send data to syslog consumers, such as Splunk, or to third party databases, such as MongoDB or Kafka, through an open data stream.
- Perform universal payload analysis (UPA) to access and parse TCP and UDP payloads from unsupported protocols.
- Initiate packet captures to record individual flows based on user-specified criteria. Your ExtraHop system must be licensed for packet capture to access this feature.
To view all triggers, click the System Settings icon ![]() and then click
Triggers. From the Triggers page, you can create a trigger or select the checkmark next to a
trigger to edit the trigger
configuration or modify the
trigger script.
and then click
Triggers. From the Triggers page, you can create a trigger or select the checkmark next to a
trigger to edit the trigger
configuration or modify the
trigger script.
Plan a trigger
Writing a trigger to collect custom metrics is a powerful way to monitor your application and network performance. However, triggers consume system resources and can affect system performance, and a poorly-written trigger can cause unnecessary system load. Before you build a trigger, evaluate what you want your trigger to accomplish, identify which events and devices are needed to extract the data you need, and determine whether a solution already exists.
- Identify the specific information you need to collect, by asking the following types of
questions:
- When will my SSL certificates expire?
- Is my network getting connections on non-authorized ports?
- How many slow transactions is my network experiencing?
- What data do I want to send to Splunk through an open data stream?
- Review the Metric Catalog to determine whether a built-in metric already exists that extracts the data you need. Built-in metrics do not create additional load on the system.
- Identify which system events produce the data that you want to collect. For example, a trigger that monitors cloud application activity in your environment might run on HTTP responses and on the open and close of SSL connections. For a complete list of system events, see the ExtraHop Trigger API Reference.
- Familiarize yourself with the API methods and properties available in the ExtraHop Trigger API Reference. For example, before you get too far in planning your trigger, check the reference to make sure that the property you want to extract is available, or to find out what properties are collected in a default CIFS record.
- Determine how you want to visualize or store data collected by the trigger. For example, you can view metrics on a dashboard or by protocol, you can send records to the recordstore.
- Determine if a trigger already exists that meets your needs or might be easily modified; always start with a pre-existing trigger whenever possible. Search the following resources for an existing trigger:
Building triggers
If you determine that you need to build a new trigger, familiarize yourself with the following tasks that must be completed:
- Configure the trigger to provide details such as the trigger name and whether debugging is enabled. Most importantly, specify which system events the trigger will run on. For example, if you want your trigger to run each time an SSH connection is opened, you will specify SSH_OPEN as the trigger event.
- Write the trigger script, which specifies the instructions the trigger will carry out when a system event configured for the trigger occurs. The trigger script can provide instructions for a simple task such as creating a custom device count metric called "slow_rsp" or a more complex effort such as monitoring and collecting statistics about the cloud applications accessed in your environment.
After the trigger is complete and running, it is important to check that the trigger is performing as expected.
- View the debug log for expected output from debug statements in the trigger script. The log also displays any runtime errors and exceptions that you must fix.
- Monitor the performance cost by tracking the number of cycles consumed by the trigger.
- Check System Health charts for trigger exceptions, drops from the trigger queue, and unexpected activity.
- Check that the trigger script adheres to the Triggers Best Practices Guide.
Navigate triggers
The Triggers page contains a list of current triggers with the following information:
- Name
- The user-defined name of the trigger.
- Author
- The name of the user who wrote the trigger. Default triggers display ExtraHop for this field.
- Description
- The user-defined description of the trigger.
- Assignments
- The devices or device groups the trigger is assigned to.
- Status
- Whether the trigger is enabled. If the trigger is enabled, the number of device assignments also displays.
- Debug Log
- Whether debugging is enabled. If debugging is enabled, output from debug statements in the trigger script are logged in the debug log output.
- Events
- The system events that cause the trigger to run, such as HTTP_RESPONSE.
- Modified
- The last time that the trigger was modified.
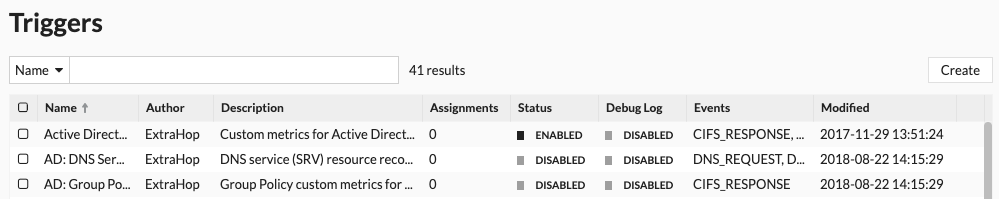
Build a trigger
Triggers provide expanded functionality of your ExtraHop system. With triggers, you can create custom metrics, generate and store records, or send data to a third-party system. Because you write the trigger script, you control the actions taken by the trigger upon specified system events.
Before you begin
Log in to the ExtraHop system with a user account that has the full write privileges required to create triggers.If you are new to triggers, familiarize yourself with the trigger planning process, which will help you narrow the focus of your trigger, or determine whether you need a build a trigger at all. Then, run through the process of building a trigger by completing the Triggers Walkthrough.
Configure trigger settings
The first step to building a trigger is to provide a trigger name, determine whether debugging is enabled, and most importantly, identify which system events the trigger will run on.
-
Click the System Settings icon and then click Triggers.
Write a trigger script
The trigger script specifies the instructions the trigger will carry out when a system event configured for the trigger occurs.
Before you begin
We recommend that you open the ExtraHop Trigger API Reference, which contains the events, methods, and properties you need for your trigger. A link is also available from the trigger editor window in the ExtraHop system.-
Click the System Settings icon , and then click Triggers.
-
In the right pane, type the trigger script in JavaScript-like syntax with
events, methods, and properties from the ExtraHop Trigger API Reference.
The following figure shows a sample script entered on the Editor tab:
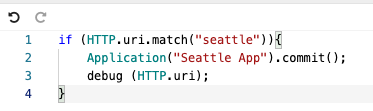
The editor provides an autocomplete feature that displays a list of properties and methods based on the selected class object. For example, type a class name and then type a dot (.) to display a list of available properties and methods as shown in the following figure:
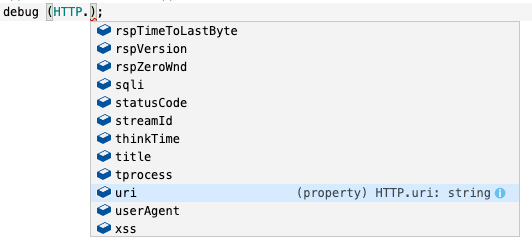
-
Click Save.
The editor provides syntax validation of your script. When you save the trigger, the validator calls out any invalid actions, syntax errors, or deprecated elements in the script. If available, the validator displays replacements for deprecated elements.
Warning: To avoid poor trigger performance, incorrect results, or a trigger that does not function, we strongly recommended that you fix the code or replace the deprecated element. The following figure shows a sample error message generated by the syntax validator:

Advanced trigger options
You must configure triggers to run on at least one event. Depending on the selected event, the Create Trigger pane displays advanced configuration options. For example, selecting the HTTP_RESPONSE event enables you to set the number of payload bytes to buffer each time that event occurs on the system.
| Option | Description | Supported events | ||
|---|---|---|---|---|
| Bytes Per Packet to Capture | Specifies the number of bytes to capture per packet. The capture
starts with the first byte in the packet. Specify this option only
if the trigger script performs packet capture. A value of 0 specifies that the capture should collect all bytes in each packet. |
All events are supported except the following list:
|
||
| L7 Payload Bytes to Buffer | Specifies the maximum number of payload bytes to buffer.
|
|
||
| Clipboard Bytes | Specifies the number of bytes to buffer on a Citrix clipboard transfer. |
|
||
| Metric cycle | Specifies the length of the metric cycle, expressed in seconds.
The following values are valid:
|
|
||
| Metric types | Specifies the metric type by the raw metric name, such as extrahop.device.http_server. Specify multiple metric types in a comma-delimited list. |
|
||
| Run trigger on each flow turn | Enables packet capture on each flow
turn. Per-turn analysis continuously analyzes communication between two endpoints to extract a single payload data point from the flow. If this option is enabled, any values specified for the Client matching string and Server matching string options are ignored. |
|
||
| Client Port Range | Specifies the client port range. Valid values are 0 to 65535. |
|
||
| Client Bytes to Buffer | Specifies the number of client bytes to buffer. The value of this option cannot be set to 0 if the value of the Server bytes to buffer option is also set to 0. |
|
||
| Client Buffer Search String | Specifies the format string that indicates when to begin
buffering client data. Returns the entire packet upon a string
match. You can specify the string as text or hexidecimal numbers. For example, both ExtraHop and \x45\x78\x74\x72\x61\x48\x6F\x70 are equivalent. Hexidecimal numbers are not case sensitive. Any value specified for this option is ignored if the Per Turn or Run trigger on all UDP packets option is enabled. |
|
||
| Server Port Range | Specifies the server port range. Valid values are 0 to 65535. |
|
||
| Server Bytes to Buffer | Specifies the number of server bytes to buffer. The value of this option cannot be set to 0 if the value of the Client bytes to buffer option is also set to 0. |
|
||
| Server Buffer Search String | Specifies the format string that indicates when to begin
buffering server data. You can specify the string as text or hexidecimal numbers. For example, both ExtraHop and \x45\x78\x74\x72\x61\x48\x6F\x70 are equivalent. Hexidecimal numbers are not case sensitive. Any value specified for this option is ignored if the Per Turn or Run trigger on all UDP option is enabled. |
|
||
| Run trigger on all UDP packets | Enables capture of all UDP datagrams. |
|
||
| Run FLOW_CLASSIFY on expiring, unclassified flows | Enables running the event upon expiration to accumulate metrics for flows that were not classified before expiring. |
|
||
| External types | Specifies the types of external data the trigger processes. The trigger only runs if the payload contains a type field with one of the specified values. Specify multiple types in a comma-separated list. |
|
Monitor trigger performance
After you have built a trigger, check to ensure that it is running as expected, without errors or unnecessary consumption of resources. If your trigger script includes a debug statement, check the debug log for debug output. You can also check the debug log for errors and exceptions. You can view performance information for an individual trigger and you can view several system health charts that indicate the collective impact of all of your triggers on the system.
To learn about the steps you must complete to create a trigger, see Build a trigger.
Check trigger output in the debug log
After you create or edit a trigger, you can view the Debug Log tab to check that the trigger is running as expected, without issues. The debug log displays debug output, errors, and exceptions. This tab only appears after the trigger is saved.
Note that debug output starts logging as soon as the trigger is assigned and saved; however, the log cannot display data that occurred prior to when the trigger was assigned and saved.
The following steps show you how to access the debug log:
- Log in to the ExtraHop system through https://<extrahop-hostname-or-IP-address>.
-
Click the System Settings icon , and then click Triggers.
- Click the name of the trigger you want to view.
- Click Edit Trigger Script.
- Click the Debug Log tab.
if (HTTP.uri.match("seattle")){
    Application("Seattle App").commit();
    debug(HTTP.uri);
}When a match occurs, the URI that contains the match is written to the debug log as shown in the following figure:
The debug log also displays any runtime errors or exceptions that occur, whether or not debugging is enabled on the Configuration tab. You should fix exceptions when they occur to minimize the performance impact on your system.
View the performance of an individual trigger
After you create or edit a trigger, you can view the Performance tab to view a graphical representation of the performance impact the trigger has on your environment. This tab only appears after the trigger is saved.
- Log in to the ExtraHop system through https://<extrahop-hostname-or-IP-address>.
-
Click the System Settings icon , and then click Triggers.
- Click the trigger you want to view.
- In the Edit Trigger pane, scroll down to the Capture Trigger Load chart.
The tab displays a trigger performance graph that tracks the number of cycles the trigger has consumed within a given time interval.
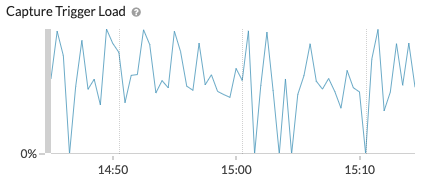
Next steps
If the trigger impact is high, re-evaluate the purpose of the trigger and consider the following options:- Ensure the trigger performs only necessary tasks and runs only on required devices or networks.
- Check for exceptions in the chart below Capture Trigger Load visit the System Health page, which provides additional trigger performance metrics such as the number of running triggers, trigger load, and trigger exceptions.
- Assess the efficiency of the trigger script and look for trigger optimization tips in the Triggers Best Practices Guide.
View the performance of all triggers on the system
After you have built a trigger, view several System Health charts that indicate the collective impact of all of your triggers on the system. You can monitor these charts for problems that affect system performance or result in incorrect data.
The System Health page contains several charts that provide an at-a-glance view of the triggers running on the ExtraHop system.
-
Click the System Settings icon , and then click System
Health.
Bundles
A bundle is a customized set of system configurations that can be saved and uploaded to an ExtraHop system.
| Video: | See the related training: Bundles |
The following system customizations can be saved as part of a bundle:
- Alerts
- Applications
- Dashboards
- Custom Detections
- Dynamic Device Groups
- Record Queries
- Record Formats
- Triggers
Learn more about creating and sharing bundles with the Bundle Best Practices Guide.
Install a bundle
ExtraHop bundles enable you to add pre-configured customizations to the ExtraHop system.
Before you begin
You must have a bundle JSON file. You can download a bundle from the ExtraHop system by navigating to , selecting the bundle, and then clicking Download Bundle from the right pane.-
Click the System Settings icon .
Appendix
Protocol modules
The ExtraHop system provides metrics through the following types of protocol modules:
| Module Type | Protocols |
|---|---|
| L2-L3 Metrics |
|
| L4 Metrics |
|
| Naming | DNS |
| Directory Services | LDAP |
| Web |
|
| Middleware |
|
| Database |
|
| Storage |
|
| File Transfer | FTP |
| SMTP | |
| Citrix VDI |
|
| Industry-Specific Protocols |
|
| Decryption | Any protocol encrypted over end-to-end SSL channel, can be decrypted using the SSL decryption module. |
For more information about ExtraHop protocol modules, visit extrahop.com.
Supported browsers
The following browsers are compatible with all ExtraHop systems. Apply the accessibility and compatibility features provided by your browser to access content through assistive technology tools.
- Firefox
- Google Chrome
- Microsoft Edge
- Safari
| Important: | Internet Explorer 11 is no longer supported. We recommend that you install the latest version of any supported browser. |
Common acronyms
The following common computing and networking protocol acronyms are used in this guide.
| Acronym | Full Name |
|---|---|
| AAA | Authentication, authorization, and accounting |
| AMF | Action Message Format |
| CIFS | Common Internet File System |
| CLI | Command Line Interface |
| CPU | Central Processing Unit |
| DB | Database |
| DHCP | Dynamic Host Configuration Protocol |
| DNS | Domain Name System |
| ERSPAN | Encapsulated Remote Switched Port Analyzer |
| FIX | Financial Information Exchange |
| FTP | File Transfer Protocol |
| HTTP | Hyper Text Transfer Protocol |
| IBMMQ | IBM Message Oriented Middleware |
| ICA | Independent Computing Architecture |
| IP | Internet Protocol |
| iSCSI | Internet Small Computer System Interface |
| L2 | Layer 2 |
| L3 | Layer 3 |
| L7 | Layer 7 |
| LDAP | Lightweight Directory Access Protocol |
| MAC | Media Access Control |
| MIB | Management Information Base |
| NFS | Network File System |
| NVRAM | Non-Volatile Random Access Memory |
| RADIUS | Remote Authentication Dial-In User Service |
| RPC | Remote Procedure Call |
| RPCAP | Remote Packet Capture |
| RSS | Resident Set Size |
| SMPP | Short Message Peer-to-Peer Protocol |
| SMTP | Simple Message Transport Protocol |
| SNMP | Simple Network Management Protocol |
| SPAN | Switched Port Analyzer |
| SSD | Solid-State Drive |
| SSH | Secure Shell |
| SSL | Secure Socket Layer |
| TACACS+ | Terminal Access Controller Access-Control System Plus |
| TCP | Transmission Control Protocol |
| UI | User Interface |
| VLAN | Virtual Local Area Network |
| VM | Virtual Machine |
Keyboard shortcuts
Keyboard shortcuts enable you to quickly navigate across the ExtraHop system or perform specific actions with a few keystrokes.
The following keyboard shortcuts apply across the entire ExtraHop system.
| Key | Action |
|---|---|
| ? | Show or hide a hot key help menu |
| G then S | Go to Dashboard |
| G then A | Go to Alerts |
| G then P | Go to Application Metrics |
| G then N | Go to Network Metrics |
| G then D | Go to Device Metrics |
| G then G | Go to Group Metrics |
| / | Global Search |
| O then M | Open Metric Explorer |
| G then E | Go to Settings |
| G then T | Go to Trigger Editor |
| G then H | Open Help |
| O then Q | View system information |
| Ctrl+S | Save widget configuration |
The following keyboard shortcuts only apply to dashboards.
| Key | Action |
|---|---|
| O then L | Toggle edit layout mode |
| O then P | Show dashboard properties |
| C then D | Copy the current dashboard |
| D then D | Delete the current dashboard |
| O then S | Toggle descriptions |
| Ctrl+Up Arrow+F | Toggle presentation mode |
| N then D | Create a new dashboard |
| N then F | Create a new folder |
| O then D | Toggle dock edit mode |
Thank you for your feedback. Can we contact you to ask follow up questions?