Drill down
An interesting metric naturally leads to questions about the factors associated with that metric value. For example, if you find a large number of DNS request timeouts on your network, you might wonder which DNS clients are experiencing those timeouts. In the ExtraHop system, you can easily drill down from a top-level metric to view the devices, methods, or resources associated with that metric.
When you drill down on a metric by a key (such as a client IP address, method, URI, or resource), the ExtraHop system calculates a topnset of up to 1,000 key-value pairs. You can then investigate these key-value pairs, referred to as detail metrics, to learn which factors are linked to the interesting activity.
Drill down from a dashboard or protocol page
Clicking a metric in a chart or legend helps you see which key, such as client IP address, server IP address, method, or resource, contributed to that value.
The following steps show you how to locate a metric and then drill down:
-
Click on a metric value or a metric label in the chart legend, as shown in the
following figure. A menu appears.
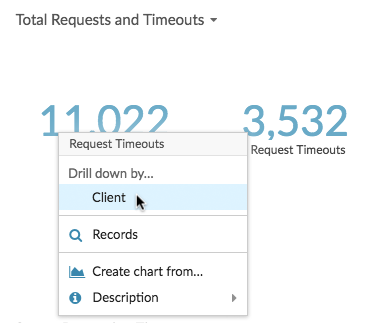
Tip: On a protocol page, you can also click a drill-down shortcut button in the Drill Down section, located in the upper right corner of the page. The type of shortcut buttons vary by protocol. 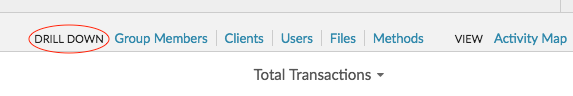
Next steps
Drill down on network capture and VLAN metrics
Click an interesting top-level metric about network activity on a Network capture or VLAN page to identify which devices are linked to that activity.
| Note: | For information about how to drill down on metrics from a flow network or flow network interface page, see the Drill down from a dashboard or protocol page section. |
- Log in to the ExtraHop system through https://<extrahop-hostname-or-IP-address>.
- Click Assets.
- Click Networks in the left pane.
- Click a network capture or VLAN interface name.
- Click a network layer in the left pane, such as L3 or L7 Protocols. Charts that display metric values for the selected time interval appear. For most protocols and metrics, a Device table also appears at the bottom of the page.
- Click the chart data, which updates the list to display only the devices that are associated with the data.
- Click a device name. A Device page appears, which displays traffic and protocol activity associated with the selected device.
Drill down from a detection
For certain detections you can drill down to see more details about the metric or key that contributed to the unusual behavior. The metric name or key appears as a link at the bottom of an individual detection.
| Note: | Detections with metrics or keys that do not have detail metrics do not include a
drill down option. Detections that only display anomalous protocol activity instead
of a metric also do not include a metric drill down option. For example, you cannot
drill down on a detection for Anomalous DNS Client activity, as shown in the figure
below. Instead, click the links for the device or application name,
Activity Map, or Records to learn
more about the anomalous activity.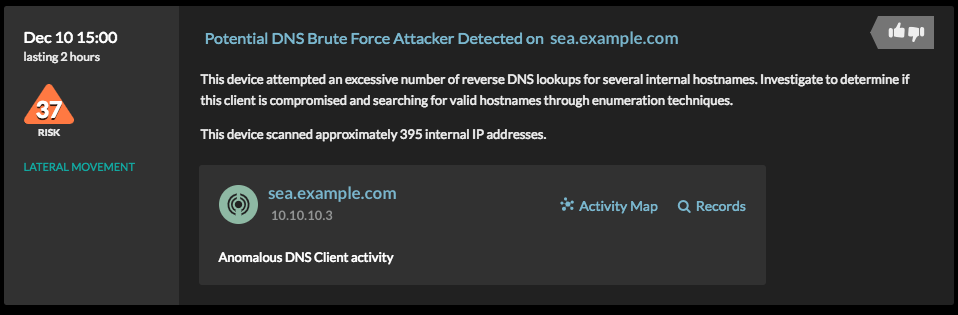 |
-
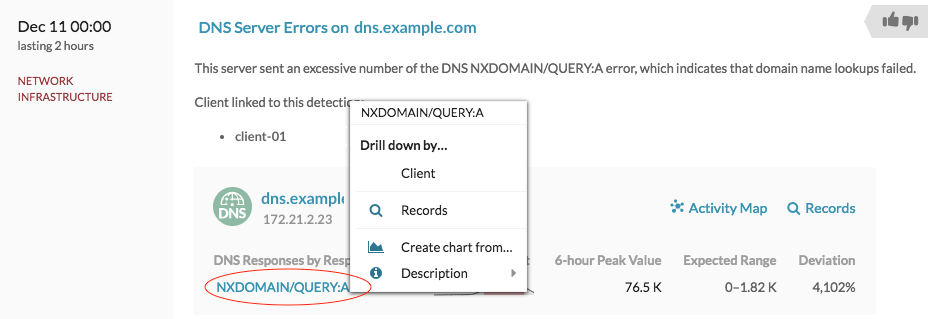
Find an interesting detection that is associated with a metric and click the
metric name or key. In the following figure, by clicking on the response code,
we can drill down to see all of the clients that received DNS responses with
NXDOMAIN/QUERY:A.
Drill down from an alert
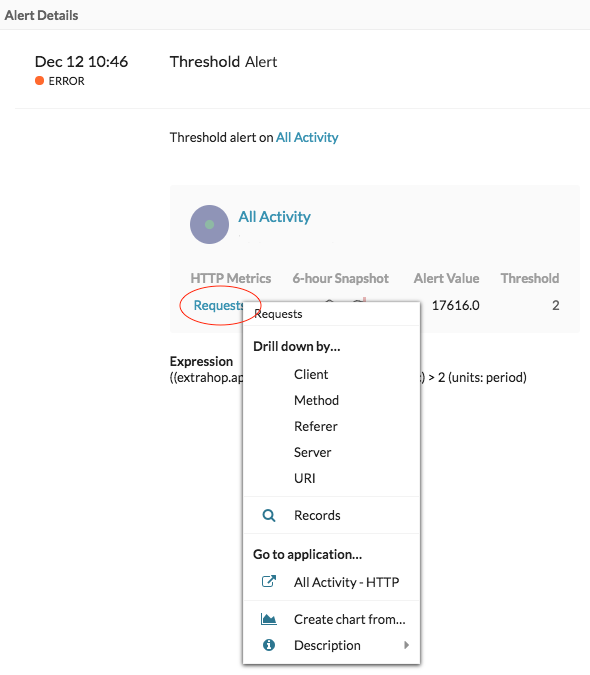
Click the metric name or key in a threshold alert to see which key, such as client, server, method, or resource, contributed to the metric value or unusual behavior.
-
Click a metric name or key, as shown in the following figure.
Investigate detail metrics
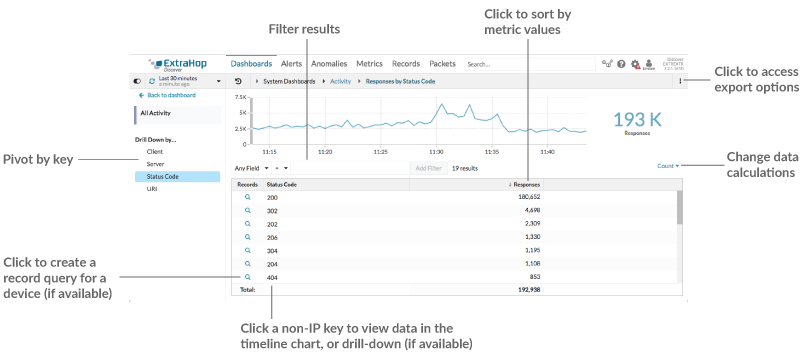
After you drill down on a metric from a dashboard, protocol page, detection, or alert, you can investigate metric values by key on a detail metric page. Filter metric data or select different keys, such as status codes or URIs, to view data from different perspectives.
The following figure shows you how to filter, pivot, sort, or export data on a detail metric page.
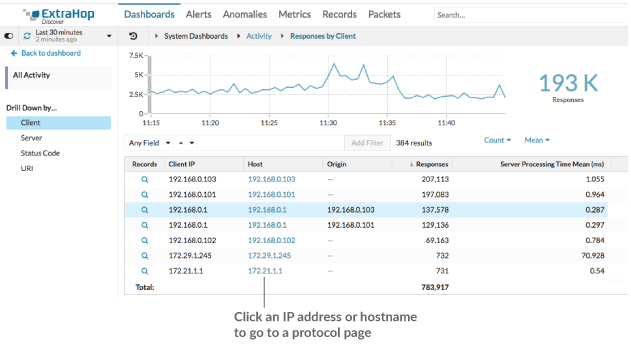
If you drilled-down on a metric by IP, Client, or Server, IP addresses and hostnames (if observed from DNS traffic) appear in the table. Additional options are now available to you. For example, you can directly navigate to a client or server protocol page, as shown in the following figure.
- Filter results
-
A detail page can contain up to 1,000 key-value pairs. There are two ways to find specific results from data: filter results or click a key in the table to create another drill-down filter.
To filter results, click Any Field, and then select a field, which varies by key. For example, you can select Network Locality for Client or Server keys. Then, select one of the following operators:
- Select = to perform an exact string match.
- Select ≈ to perform an approximate string match. The ≈
operator supports regular expression.
Note: To exclude a result, enter a regular expression. For more information, see Create regular expression filters. - Select ≉ to exclude an approximate string match from your results.
- Select > or ≥ to perform a match for values greater than (or equal to) a specified value.
- Select < or ≤ to perform a match for values less than (or equal to) a specified value.
- Click Add filter to save the filter settings. You can save multiple filters for one query. Saved filters are cleared if you select another key from the Details section in the left pane.
To complete the filter, enter or select a value that you want to filter results by, and then click Add Filter.
- Investigate threat intelligence data (ExtraHop Reveal(x) Premium and Ultra only)
- Click the red camera icon
 to
view threat intelligence details about
a suspicious host, IP address, or URI found in detail metric data.
to
view threat intelligence details about
a suspicious host, IP address, or URI found in detail metric data. - Highlight a metric value in the top chart
- Select an individual row or multiple rows to change chart data in the top chart on the detail metric page. Hover over data points in the chart to view more information about each data point.
- Pivot to more data by key
- Click key names in the Details section to see more detail metric values, broken down by other keys. For IP address or host keys, click a device name in the table to navigate to a Device protocol page, which displays traffic and protocol activity associated with that device.
- Adjust the time interval and compare data from two time intervals
- By changing the time interval, you can view and compare metric data from different times
in the same table. For more information, see Compare time intervals to find the metric delta.
Note: The global time interval in the upper left corner of the page includes a blue refresh icon and gray text that indicates when the drill-down metrics were last polled. To reload the metrics for the specified time interval, click the refresh icon in the Global Time Selector display. For more information, see View the latest data for a time interval. - Sort metric data in columns
- Click the column header to sort by metrics to view which keys are associated with the largest or smallest metric values. For example, sort on processing time to see which clients experienced the longest website load times.
- Change data calculation for metrics
- Change the following calculations for metric values displayed in the table:
- If you have a count metric in the table, click Count in the Options section in the left pane and then select Average Rate. Learn more in the Display a rate or count in a chart topic.
- If you have a dataset metric in the table, click Mean in the Options section in the left pane and then select Summary. When you select Summary, you can view the mean and the standard deviation.
- Export data
- Right-click a metric value in the table to download a PDF, CSV, or Excel file.
Drill-down a second time by a key filter
After you first drill down on a top-level metric by key, a detail page appears with a topnset of metric values broken down by that key. You can then create a filter to drill down a second time by another key. For example, you can drill down on HTTP responses by status code, and then drill down again by the 404 status code to find more information about the servers, URIs, or clients associated with that status code.
| Note: | The option to drill-down a second time is only available for certain topnsets. |
The following steps show you how to drill down from a chart and then drill down again from a detail metric page:
-
In the Drill down by… section, select a key, as shown in
the following figure.
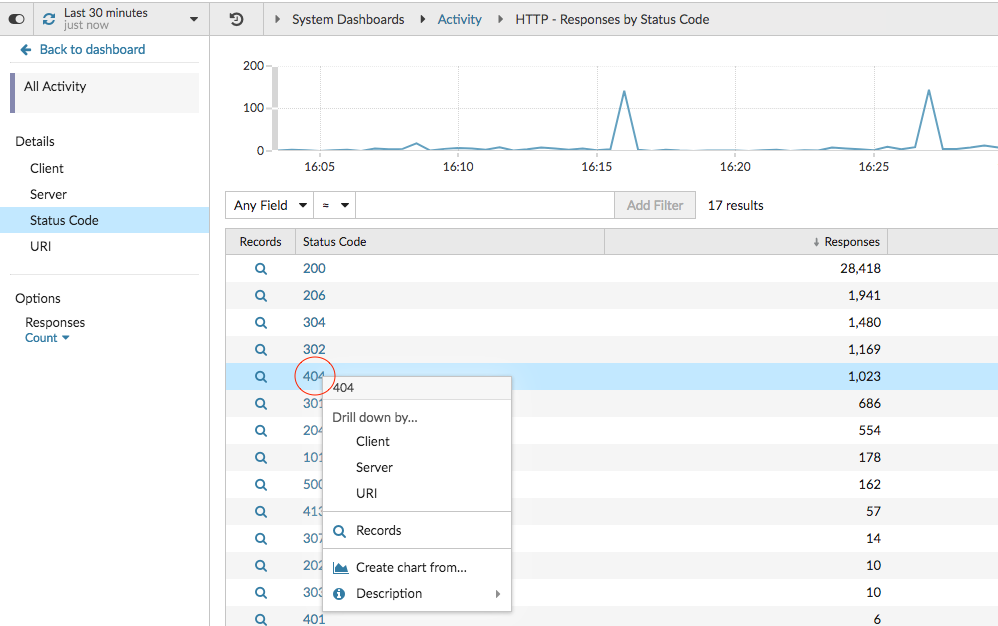
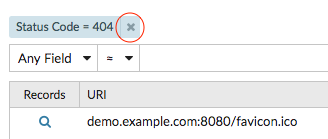
The key filter appears above the table. You can now view all the detail metrics associated with that single key. -
To remove this filter from the table and then apply the filter to the top
chart, click the x icon, as shown in the following
figure.
The filter in the chart persists as you select other keys in the Details section.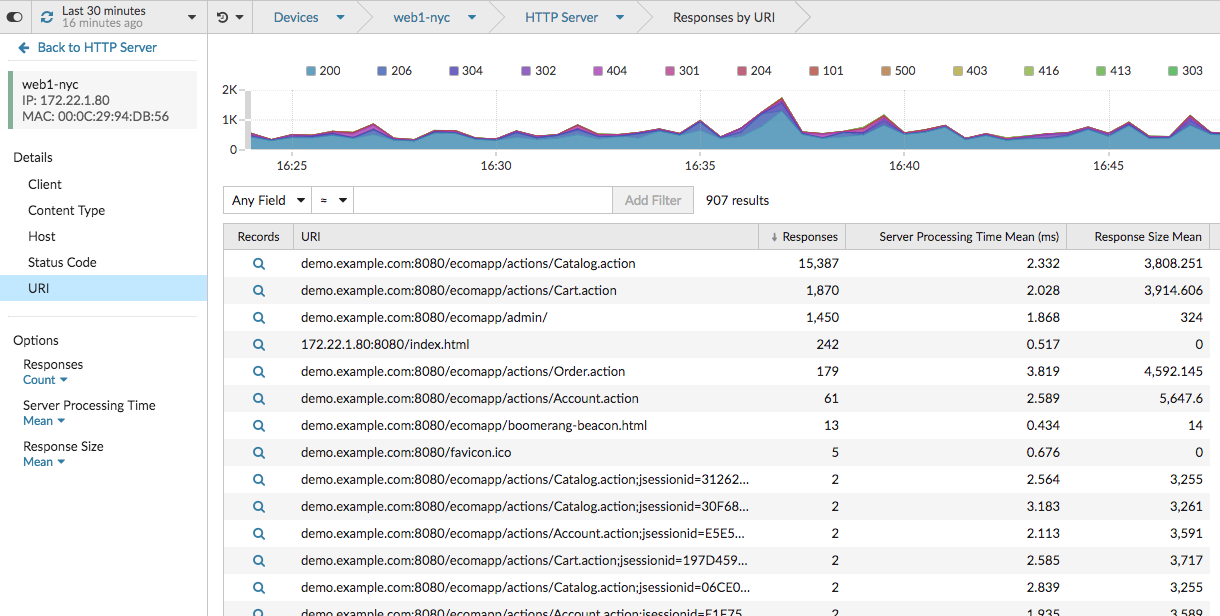
Add detail metrics to a chart
If you want to quickly monitor a set of detail metrics in a dashboard, without repeatedly performing the same drill-down steps, you can drill down on a metric when editing a chart in the Metric Explorer. Most charts can display up to 20 of the top detail metric values broken down by key. A key can be a client IP address, hostname, method, URI, referrer, or more. Table and list widgets can display up to 200 top detail metric values.
For example, a dashboard for monitoring web traffic might contain a chart displaying the total number of HTTP requests and responses. You can edit this chart to drill down on each metric by IP address to see the top talkers.
The following steps show you how to edit an existing chart and then drill down to display detail metrics:
-
Select a key from the drop-down list.
Note: If you have more than one source selected in your metric set, such as two devices, the sources are automatically combined into an ad hoc source group as you drill down. You cannot deselect the Combine Sources checkbox. To view drill-down metrics for each source, you must remove a source from the metric set and then click Add Source to create a new metric set. If detail metric data for a common key is available for all of the metrics in a metric set, the key for the detail metric automatically appears in the drop-down list, as shown in the following figure. If a key in the list is grayed out, the detail metric associated with that key is unavailable for all of the metrics in that metric set above. For example, client, server, and URI data are available for both HTTP Requests and HTTP Responses metrics in the metric set.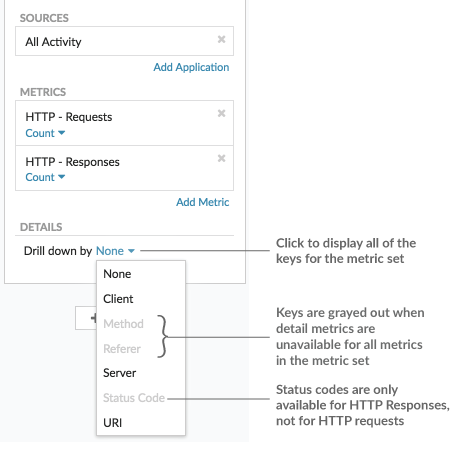
-
To remove a drill-down selection, click the x
icon.
Note: You can display an exact key match per metric, as shown in the following figure. Click the drill-down metric name (such as All Methods) to select a specific drill-down metric key (such as GET) from the drop-down list. If a key appears gray (such as PROPFIND), drill-down metric data is unavailable for that specific key. You can also type a key that is not in the drop-down list. 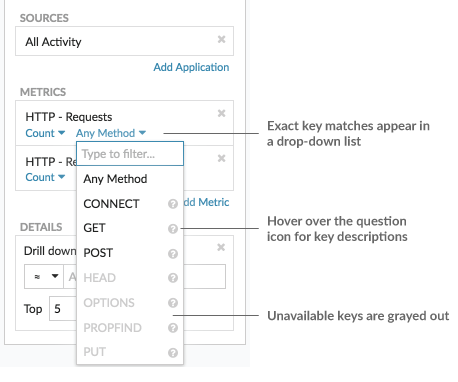
Thank you for your feedback. Can we contact you to ask follow up questions?